





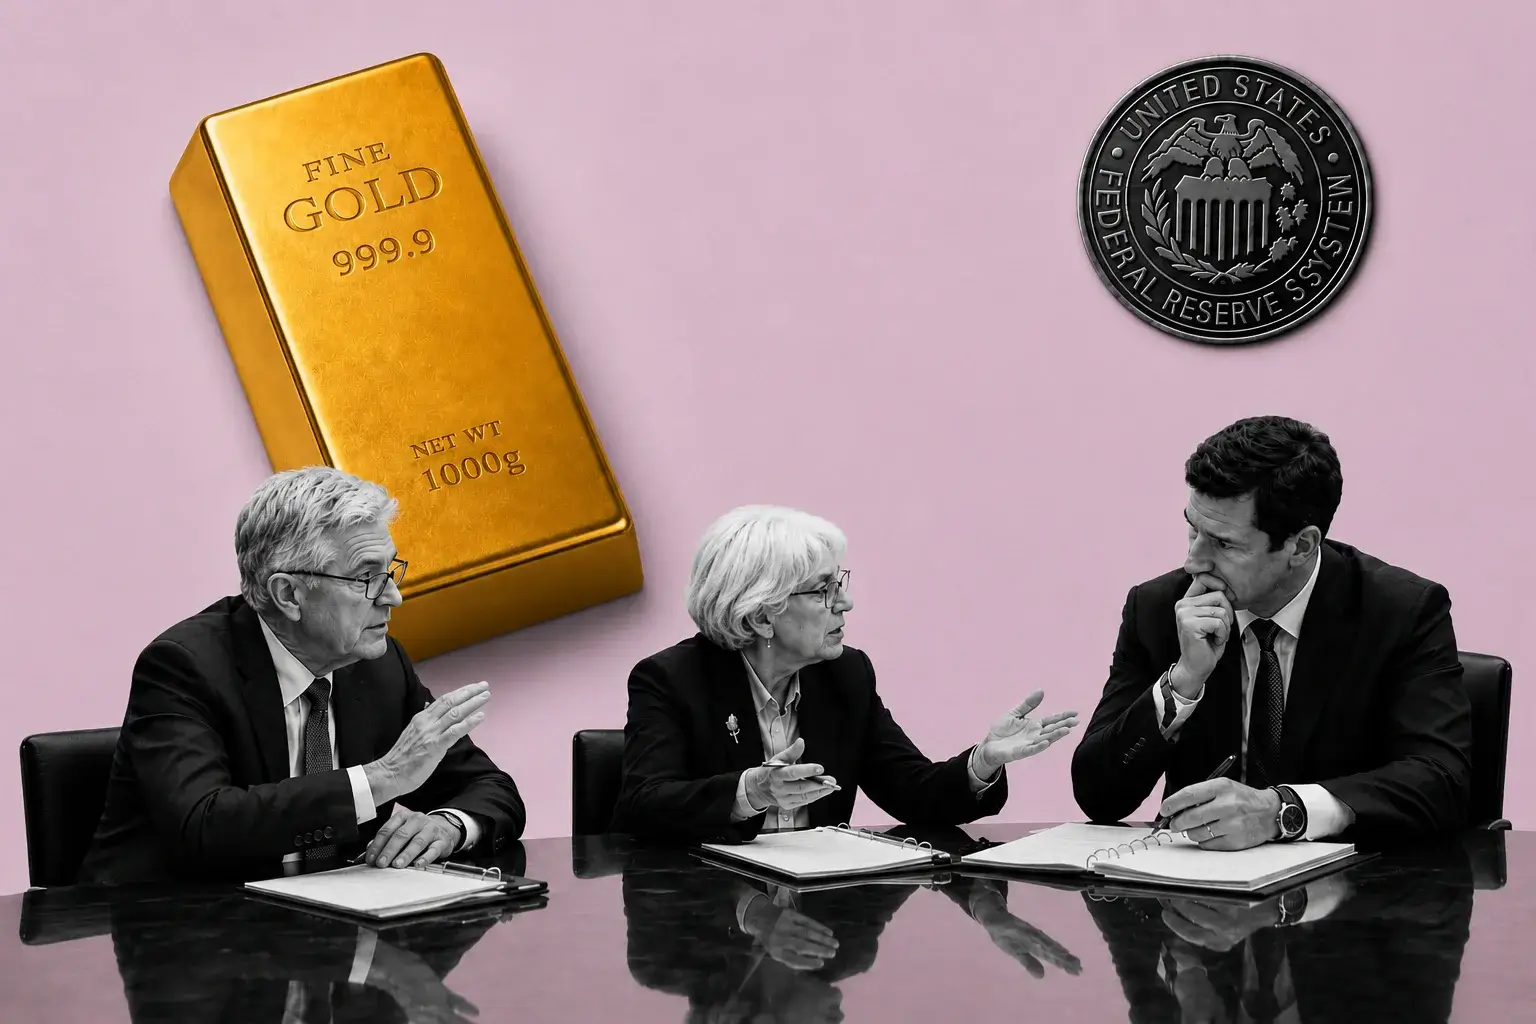
Gold (XAU/USD) Slides to $4,008.80 With the Iran War Now Bearish Bullion — $4,002 Decides Whether $3,895 or Morgan Stanley's $5,200 Prints Next
Escalating Gulf strikes lifted Brent to $84.63 and pushed inflation expectations higher | That's TradingNEWS
Key Points
- Gold trades at $4,008.80, down 28.3% from the $5,589 January 29 peak and 5.25% over the past month.
- The 10-year yield hit 4.60% near its 4.62% cycle high, lifting the opportunity cost of holding non-yielding bullion.
- The PBoC added 15 tonnes in June to reach 2,346 tonnes, around 9% of total reserves, across 20 straight months.
Gold futures sit at $4,008.80, down $43.00 or 1.06%, after opening the session at $4,068.90 — up 0.4% against Wednesday's close. Spot bullion is worse: the ask printed $4,010.33 at 11:03 EDT, off $57.22 on the day. The metal traded $4,041.10 at 8:02 a.m. ET and has been sold every hour since.
The month is ugly and the week is uglier. Gold has fallen 5.25% over the past thirty days and remains 20.89% higher than a year ago — a spread that tells you exactly how violent the reversal has been. On July 10 the metal printed $4,121.05, down 0.06%, and settled the week near $4,100 for a 1.5% five-session decline. On Monday, July 13, spot slid to test $4,000 directly and traded $4,013.64, off 2.60% on the session. Today it is back at the same line.
Three tests of $4,000 in four sessions. The June low was $4,002.
The thesis is the part most desks are still refusing to say plainly: gold has stopped trading as a haven and started trading as a rates asset. The US-Iran war is bearish for gold, not bullish, because the transmission runs through crude into headline inflation into Fed hiking expectations into real yields. Every escalation raises the opportunity cost of holding an asset that yields nothing. Until that chain breaks, $4,000 is the only level that matters and $5,589 is a historical footnote.
The rest of the complex confirms it. Silver sits at $56.90, down $1.27. Front-month Comex silver for August delivery plunged $1.803, or 3.06%, to $57.095. Platinum trades $1,656.30, off $28.90. Palladium sits $1,295.75, down $42.20. The whole precious complex is being repriced by the same input.
Against that, the metal found some support from softer US inflation data, which eased concerns over a near-term Federal Reserve hike. It lasted a day. Gold fell toward $4,000 on Thursday, resuming its decline as escalating attacks in the Middle East pushed oil sharply higher and revived the inflation problem the CPI print had briefly buried.
That reversal — soft CPI on Tuesday, oil-driven selling by Thursday — is the entire 2026 gold market in one week.
The War Is Bearish Gold and the Mechanism Is Oil
The counterintuitive result is mechanistically logical, and the sequence is precise. Military escalation triggers fears of crude supply disruption. Rising energy costs feed directly into headline inflation. Higher headline inflation reinforces the case for the Fed to keep rates elevated or raise them. Higher real yields increase the opportunity cost of holding a non-yielding asset. Institutional selling follows.
The geopolitical event acts as an inflation catalyst rather than a safe-haven trigger.
That is why gold tumbled as Gulf tensions failed to spark haven demand. The market is treating Hormuz risk as an interest-rate story: oil up, yields up, dollar firmer, gold's haven bid fades. It is not that the war does not matter. It is that the war matters through the wrong channel.
The oil side is doing its job. Brent trades $84.63, up 6.39% over the past month and 21.74% year over year. WTI holds above $80 after ripping more than 11% across three sessions. The US launched additional strikes against Iranian targets on Wednesday and Iran attacked US military bases in neighboring Gulf states on Thursday.
The timeline explains the whipsaw. Iran and the US signed a Memorandum of Understanding on June 17, and talks progressed peacefully if not smoothly. The removal of sanctions on Iranian oil and the lifting of the Hormuz blockade showed a working relationship existed. That relationship ended abruptly on July 6 when the Revolutionary Guard fired missiles at commercial ships, prompting retaliation. The MoU is now under significant strain.
Gold rallied on the February war and is falling on the July war. Same conflict, opposite response, because the rate regime flipped underneath it.
The escape hatch exists and it is narrow. A sustained, credible disruption to Hormuz that triggers a true risk-off rush — or forces a growth scare that drives yields down — would flip the sign. Trump said Tehran signaled willingness to resume negotiations, which cuts the other way. Absent one of those two extremes, the policy channel keeps dominating and keeps pressuring bullion.
From $5,589 to $4,008.80: Anatomy of a 28% Drawdown
Gold hit $5,589 an ounce on January 29, 2026. It trades at $4,008.80 today. That is a decline of $1,580.20, or 28.3%, in under six months.
The full path matters because it explains who is trapped. Bullion punched through $5,000 for the first time in history in January, kept climbing to $5,595 an ounce intraday, then shed nearly $1,200 in two days. The January 28 closing peak was $5,420. The World Gold Council logs the record at $5,405/oz on a closing basis in late January. The metal recorded more than 12 all-time highs across the first half of the year.
Then it broke. Gold traded a relatively tight range for the rest of Q1 before a major selloff in mid-March took it below $4,400. A bounce in April gave way to a gradual decline toward $4,100. The June low printed $4,002/oz.
Year to date the metal is down 7%. Average volatility ran 30% across the half.
The context nobody holding a January position wants to hear: gold ended 2025 at $3,431 per ounce after setting 53 all-time highs and delivering a 44% increase in annual average price over 2024. On January 29, year-over-year growth stood at 95.6%. At $4,008.80, the metal is up 20.89% year over year and sits $577.80 above where 2025 closed. The spot price remains broadly in line with where 2026 began.
That is the honest frame. This is not a collapse of the gold thesis. It is the unwind of a parabolic eight-week move that took the metal from $4,300 to $5,600 and priced in a decade of debasement in two months.
The structural argument holds that the uptrend established over the past two years remains intact, with the $1,000 correction from the January high sitting within the bounds of a technical pullback given the pace of the preceding rally. On that read, $4,550 — the late-December highs retested during the January-February selloff — was the primary floor.
That floor broke in March. It is now $460 above spot. Which is the problem with the constructive case: the consolidation range it depended on no longer exists.
March's 13% Wipeout and the Worst Two-Day Rout Since 1983
Two events did the damage, and both were liquidation rather than repricing.
The first was the January reversal. Gold shed nearly $1,200 in two days after touching $5,595 — the metal's worst two-day rout since 1983. That single session included a 9% collapse. Forty-three years of price history and nothing matched it.
The second was March. Gold tumbled approximately 13% during the month, hovering around $4,500 by month-end. That was the worst monthly decline in nearly two decades — the sharpest since 2009. Escalating hostilities in the Middle East triggered the selloff, which is the point: the war did that, through rate expectations, not through haven flows.
Wall Street's response to the January rout was to shrug and raise targets. A Reuters poll of 30 analysts and market participants put the median 2026 gold forecast at $4,746.50 per troy ounce — the highest annual consensus in Reuters polling history going back to 2012. The same survey a year earlier penciled in $2,700 for this year.
At $4,008.80, gold sits 15.6% below that median consensus with five and a half months left.
The liquidation mechanics explain the violence. Gold's traditional safe-haven status faced its most severe test in a decade and revealed a paradox: its liquidity makes it vulnerable during broad market stress. When institutions face margin calls or need cash quickly, they sell the most liquid asset in the portfolio — often gold. That is a liquidity trap, and it is the opposite of the behavior the haven narrative promises.
The tell was March 4. GLD recorded a $2.91 billion net cash outflow in a single day — the largest withdrawal in over a decade. That was not a view on gold. That was a cash raise.
Momentum money compounded it. The January peak presented the perfect exit for positioning that had ridden the move from $3,431, and the resulting selling pressure fed on itself. What remains is a demand base weighted toward buy-and-hold allocations rather than trend followers — a slower, sturdier bid that does not chase.
Real Yields at 4.60% and the Opportunity Cost of Holding Zero
The 10-year Treasury yield ripped to 4.60% on Thursday, approaching the near two-month high of 4.62% set July 13, as positioning shifted toward a Fed hike. That number is the gold price.
The mechanism runs through real yields — bond yields adjusted for inflation expectations — not nominal rates alone. A real yield measures what a holder genuinely earns after inflation. When the Fed signals more hiking than expected, real yields rise, and an asset that pays nothing gets repriced against an asset that pays 4.60%. When the Fed cuts or signals fewer hikes, real yields fall and gold benefits.
That is why a soft CPI print can lift gold before the Fed acts, and why it did — for a day.
June CPI fell 0.4% month over month, the largest monthly drop since April 2020, with the annual rate easing to 3.5% and core holding at 2.6%. Producer prices fell 0.3%, the first decline in nearly a year, driven by plunging energy costs. Gold caught a bid off both prints.
Then the bond market called it. Retail sales grew at a solid pace in June net of lower fuel turnover. Initial jobless claims fell to a two-month low at 208,000. The inflationary outlook and tight labor backdrop drove the FOMC to project a hike this year, and rate derivatives are positioned consistent with it. Implied odds of a September increase sit at 44%, down from 50% a day earlier — meaningfully off, but still pricing a hike as the live question rather than a cut.
The dollar compounds the pressure. Elevated yields, the hawkish pivot and a resilient US economy keep the greenback supported, with the index at 100.49. Note what that reverses: the dollar lost approximately 10% early in 2026 against a basket of major currencies, and that weakness was a primary engine of the run to $5,589. The engine is now running backwards.
There is a historical counterpoint the bears skip. Gold averaged +0.84% in the month following a 25-basis-point Fed hike. In three specific tightening cycles, gold rallied as hikes triggered growth fears. The hike is not automatically the end — it is the growth response to the hike that decides.
Warsh Withheld His Own Dot and the Plot Went Hawkish
Kevin Warsh was confirmed as Fed Chair in May 2026 and delivered his first congressional testimony on July 14 before the House Financial Services Committee — scheduled 90 minutes after the CPI release — followed by Senate Banking testimony on July 15 alongside the PPI print.
The June FOMC under Warsh produced a specific set of signals: rates held steady, forward guidance removed, the dot plot shifted hawkish, and Warsh's individual rate projection withheld entirely.
Read that last item carefully. A Fed chair who declines to publish his own dot is a Fed chair telling the market it does not get to price his reaction function. Combine it with removed forward guidance and you have deliberately manufactured uncertainty — which is exactly the regime in which a non-yielding asset with a 28% drawdown gets no bid.
The July meeting lands on July 28-29. Probability of a hold sits near 90%, with the market assigning a 66.3% chance rates stay unchanged at 3.50%-3.75%. On July 8, CME pricing showed 33% odds of a 25-basis-point hike at the July 29 decision. September remains live.
The World Gold Council's base case assumes at least one Fed hike in 2026, likely by October, alongside parallel tightening cycles from the Bank of England, Bank of Japan and European Central Bank. That is the part that gets underweighted: this is not a US-only tightening story. Four major central banks moving the same direction removes the currency-debasement differential that made gold work.
The macro overlay: global growth of 2.9% year over year in 2026, US growth at 2.1% — in line with its average since 2000 — US inflation peaking near 3.9% in Q2 before cooling slightly, and global inflation averaging 4.3% for the year.
Growth at trend, inflation peaking, four central banks tightening, real yields at cycle highs. There is nothing in that configuration that pays a holder to own gold, and the price is reflecting it precisely.
The escape is a growth accident. Bank of America's June fund manager survey found 58% of 198 managers overseeing $540 billion expect stagflation. If they are right, the hike arrives into a slowdown and gold's response flips.
The $4,100 Fair Value and a ±5% Band Already Under Assault
The World Gold Council published its Gold Mid-Year Outlook 2026 — "Point Break" — on July 1. Its Gold Valuation Framework links price to real yields, inflation expectations, the dollar and central bank demand. Under the base-case macro scenario, the model places fair value at approximately $4,100 per ounce within a tolerance band of ±5%.
That produces a second-half range of $3,895 to $4,305.
At $4,008.80, gold sits inside that band, 2.2% below the midpoint and 2.9% above the floor. The framework's conclusion is that the price is fairly aligned with macro consensus — which is a polite way of saying the metal is now correctly priced for a world with one Fed hike and 3.9% peak inflation, and that nothing about the current level is a dislocation.
That is the most important sentence in the gold market right now, and it cuts both ways.
It kills the bear case for a collapse. The WGC does not call for one. Under stable macro conditions, gold trades within roughly ±5% of $4,100 through year-end. That puts a floor at $3,895 that is analytical rather than technical.
It also kills the near-term bull case. If $4,100 is fair value under consensus assumptions, then getting to $5,200 or $6,000 requires the assumptions to break, not the price to catch up. The metal is not cheap. It is correct.
The outlook remains highly sensitive to macro and geopolitical change. A deterioration in global growth or renewed escalation in geopolitical risk could reignite upward momentum. The first half showed gold remains sensitive to heightened geopolitical concerns and abrupt shifts in sentiment, and showcased the growing relevance of Asian markets in price discovery.
The dollar is the wildcard the WGC flags explicitly. It held up during the US-Iran conflict and reacted positively to signs of resolution, but expectations for the second half vary widely as counterbalancing factors could push performance either way.
Elevated geopolitical tension — the US-Iran conflict specifically — was the dominant driver of gold's performance across the first half. It drove the metal to $5,589 in January and to $4,002 in June. Same driver, opposite outcome, six months apart.
The PBoC Bought 15 Tonnes and It Didn't Move the Price
Central banks are buying the drawdown aggressively, and the price is falling anyway. Both facts are true and the reconciliation is the whole structural argument.
The People's Bank of China purchased 15 tonnes of gold in June — its biggest monthly addition since October 2023, when it bought nearly 22 tonnes. That marked the twentieth consecutive month of accumulation. The PBoC now holds 2,346 tonnes, making up around 9% of the value of its total reserves. In May it added nearly 10 tonnes. Global central banks purchased an estimated 244 tonnes in Q1 2026. Poland continues accumulating.
Central banks are using the selloff to load up.
Here is why it has not stopped the decline. Central bank purchases provide a structural floor that is fundamentally different from private demand. They buy on decade-long reserve allocation mandates, not in response to daily price movements. That makes them price-insensitive buyers — which means they absorb supply but do not chase. A price-insensitive bid sets a floor. It does not set a trend.
Scale it. 15 tonnes is roughly 482,000 ounces. At $4,008.80 that is $1.93 billion of demand across an entire month. GLD lost $2.91 billion in a single session on March 4. The largest monthly sovereign purchase since 2023 is smaller than one day of ETF liquidation.
That is the arithmetic the structural bulls keep skipping.
The projection embedded in the bullish desks is that central bank purchases accelerate and provide price support, with total gold sales topping 800 tons this year. At 244 tonnes in Q1 and the PBoC running 15 tonnes monthly, that pace is achievable — and it still amounts to a floor rather than a catalyst.
The structural case has not reversed: central bank buying, fiscal expansion, reserve diversification, de-dollarisation, mine production growing at 1-2%. None of those turned off. What turned off is the marginal private buyer, and the marginal private buyer sets the price.
At 9% of reserves, the PBoC has room to keep going for years. That matters over a decade. It does not matter this quarter.
GLD's $2.91 Billion Exit and Where the Private Bid Went
The private demand collapse is the variable that explains the drawdown, and the ETF ledger is where it shows.
SPDR Gold Shares recorded a $2.91 billion net cash outflow on March 4, 2026 — the largest single-day withdrawal in over a decade. That liquidation from the most prominent gold-backed vehicle sent immediate ripples and raised the question the market is still answering: temporary rebalancing or genuine re-evaluation of gold's role.
The subsequent tape answered it. GLD fell roughly 12% from early April through early July. As of late May, the fund was up 4% year to date and 37% over twelve months even after a 5% monthly pullback. Both of those figures are now materially worse.
The pattern is institutional reduction of commodity exposure driven by models weighing risk against return in a 4.60% risk-free environment. Portfolio managers do not need a bearish view on gold to sell it. They need a Treasury that pays them to wait.
The competitive pressure is real and it is not only bonds. Gold's safe-haven status faces challenges from high Treasury yields and Bitcoin's positioning as digital gold — though that second argument has aged badly. Bitcoin sits at $64,195.94, down 26.1% year to date and 54.3% from its October 2025 peak. Both assets sold off together through Q2, and Bitcoin's rolling correlation with gold increased across the quarter.
The debasement trade — seeking assets that hedge against depreciating fiat — has been losing momentum, and other commodities also declined in Q2. That is the honest read: the entire real-assets-over-paper-assets regime is what is under pressure, not gold specifically.
The counterargument from the bullish desks holds that near-term volatility does not break a structural, continued diversification trend that has further to run amid a still well-entrenched regime of real asset outperformance versus paper assets.
The problem with that position is that the regime it invokes is precisely what stopped working. Gold, silver, platinum, palladium, Bitcoin and broad commodities all sold off together. That is not rotation. That is one factor unwinding across every expression of it.
Physical demand is confirming. Perth Mint silver bar and coin demand is collapsing, with appetite for physical metal evaporating.
GDX Down 21% in a Quarter and Still Up 50% on the Year
The miners took the leverage in both directions and the numbers are extreme.
The VanEck Gold Miners ETF shed 21% in the second quarter of 2026, sliding from $96 in early April to roughly $75 by June 30 — one of the ugliest three-month stretches for the sector in over a decade. Across the early April to early July window, GDX fell closer to 16% while GLD fell roughly 12%. Miners amplified the move, as they always do.
And GDX is still up almost 50% over the trailing year.
That gap between recent pain and the underlying trend is the entire contrarian argument. Over one year, gold gained 22% while miners gained 50%. Over five years, GLD returned 126% while GDX returned 144%. Over two years, gold is up 89% and miners are up 144%. When gold trends up, miners outrun it. When gold rolls over, they get hit harder.
The mechanism is operational leverage. Miners carry largely fixed costs to pull metal out of the ground, so once the gold price clears all-in sustaining cost, the incremental dollar drops almost entirely to margin. That produces exponential earnings growth on the way up and brutal compression on the way down.
GDX held over $22.7 billion in AUM across 69 gold mining companies as of early July. Agnico Eagle sits at 10.7% of net assets, Barrick at 7.9%. Newmont carries a market cap above $103 billion; AngloGold Ashanti approaches $42.5 billion. Franco-Nevada and Wheaton Precious Metals supply the royalty exposure. The junior vehicle, GDXJ, holds over $7 billion across 124 holdings at a 0.52% expense ratio.
Flows are negative. GDX detected an approximate $103.1 million weekly outflow, a 0.8% decrease week over week, with shares outstanding falling from 423,902,500 to 420,502,500.
The signal cutting the other way is what management teams are doing with cash. Genesis Minerals launched a rival $3.9 billion bid for Vault Minerals — the aggressive move producers make when they see ounces as cheap and their own cash flows as durable. Operators buying reserves at these prices is a different vote than the ETF flow ledger.
The honest framing: miners can grind lower for months before turning. The 50% trailing-year gain against a 21% quarterly loss is either the setup or the warning.
Silver at $56.90, the 70:1 Ratio and the Industrial Tell
Silver is the cleanest expression of what is actually happening, because it strips the monetary story out and leaves the machine.
Front-month Comex silver for August delivery plunged $1.803, or 3.06%, to $57.095. Spot sits at $56.90, down $1.27. On a prior session silver dropped 2.3% to $58.49. On the July 13 rout, silver fell 2.9% against gold's 2.60% — worse, as it always is when the market shifts from haven pricing to rates-and-dollar pricing.
The gold/silver ratio just hit 70:1.
That divergence is the diagnosis. Gold runs on a single engine: monetary demand. Central banks buy it, institutions hold it, long-term savers allocate to it as a purchasing-power hedge. Silver runs on two, and more than 60% of its demand is industrial. When the Fed path stays uncertain and industrial-demand expectations get suppressed, silver takes a hit gold does not.
The March collapse was the extreme version. Silver fell 43% from its $121.67 all-time high to $69.50 in under eight weeks after the Gulf war shocks — a drawdown that exposed its industrial identity over its monetary role. Energy costs surged, rate-hike fears spiked, and the metal got repriced as a commodity rather than money. Qatar's helium facility destruction threatened chip fab output, cutting directly into silver packaging demand.
From $121.67 to $56.90 is a 53.2% decline. Gold's drawdown is 28.3%. That 25-point spread is the market telling you precisely how much of the precious complex rally was industrial beta wearing a monetary costume.
Platinum at $1,656.30, down $28.90, and palladium at $1,295.75, off $42.20, are saying the same thing with less volume.
The positioning implication is direct: silver's higher beta makes it the cleaner downside expression of the same macro impulse driving gold. If energy keeps reigniting inflation fears and the rate channel keeps dominating, silver leads lower.
The risk to that read is sharp and worth respecting. If industrial demand fears flip into recession-deflation pricing fast enough, silver gets pulled into a broad precious-metal safe-haven bid and the ratio compresses violently. That is the same growth-accident scenario that rescues gold. Both metals are waiting on the identical trigger.
Read More
-
Yen Stalls at 160 Despite a 3% JGB and Tokyo Core CPI at 2.0% — Intervention Sits at 164, Friday's Payrolls Decide
02.09.2026 · TradingNEWS ArchiveEnergy
-
QQQ ETF ($706.22) Slides 7.4% Below Its High as the Market Reprices the AI Capex Bill — $686.57 Target if $700 Breaks
22.10.2026 · TradingNEWS ArchiveStocks
-
XRPI ($7.00) and XRPR ($10.74) Slide Toward 52-Week Lows as Spot XRP ETF Flows Stall at $708,510
22.10.2026 · TradingNEWS ArchiveCrypto
-
NG ($2.775) Decoupled From Europe’s €88 Gas Crisis as LNG Feedgas Hits 18.9 Bcf/d — $3.30 Upside on Cold Weather
22.10.2026 · TradingNEWS ArchiveCommodities
-
Dollar-Yen (157.35) Loses 157.65 as the Yen Rallies on Haven Demand — 155 Target if 156 Breaks
22.10.2026 · TradingNEWS ArchiveForex
The $6,300 Crowd Against the $2,994 Crowd
The forecast dispersion is the widest in the commodity complex, and the spread is the honest signal.
The bulls are stacked and loud. JP Morgan forecasts prices averaging $6,000/oz by the final quarter of 2026, rising toward $6,300/oz by the end of 2027, and has separately projected $8,000 by 2030 under continued reserve diversification and sustained fiscal deficits. Deutsche Bank sees prices topping $6,000 by end-2026. UBS calls for $6,200 and Société Générale for $6,000. Goldman Sachs reaffirmed $5,400 for year-end 2026 with a bear case at $3,800. Morgan Stanley maintains an upside bias with a $5,200 target that depends on one specific buyer type returning — the one most sensitive to the Fed.
From $4,008.80, JP Morgan's $6,000 implies 49.7% upside in five and a half months.
The bears are quieter and closer to the tape. OCBC expects gold to decline through the end of 2026 on rising Treasury yields, a stronger dollar and weaker private demand, while holding that the long-term trend remains upward. The most bearish modeling puts gold in a $3,365-$4,236 range for July, $3,542-$3,887 by month-end, and $2,875-$2,994 by year-end amid ongoing geopolitical tension and further Fed hikes.
That is a spread from $2,875 to $6,300 — a 119% gap between the extremes on a single asset over the same horizon.
The middle is where the money is. The Reuters poll median sits at $4,746.50 for 2026, the highest annual consensus in the survey's history back to 2012. The WGC framework lands at $3,895-$4,305. Those two are $441.50 apart at the boundary and represent the only forecasts derived from a valuation model rather than a directional view.
Reconcile them and the map is clear. The WGC range is where gold trades if macro consensus holds. The $5,200-$6,300 cluster requires the consensus to break bullishly — a growth accident, a dollar collapse, a Fed pivot. The $2,994 case requires it to break bearishly — more hikes, higher real yields, sustained private liquidation.
Gold's reputation as overvalued is at its lowest point since February 2024. That is a sentiment reading, not a valuation one, and it is the strongest argument the bulls have.
$4,002 Is the Whole Trade
Everything reduces to one number. The June low printed $4,002/oz. Spot tested $4,000 on July 13 and traded $4,013.64. Gold sits at $4,008.80 today after opening at $4,068.90.
That is a $6.80 cushion above the cycle low.
Map the downside. A clean break of $4,002 removes the last technical floor between spot and the WGC's analytical floor at $3,895 — a further 2.8% decline that the valuation framework says is inside the fair-value band, meaning nobody with a model would defend it. Below $3,895, Goldman's $3,800 bear case becomes the reference, and beneath that the structure is open to the $3,542-$3,887 month-end projections. The $3,431 level where 2025 closed is the line that would erase the year entirely.
Map the upside. Reclaiming $4,100 puts gold back at the WGC midpoint and neutralizes the break. Above $4,305 the fair-value band is exceeded and the market is pricing a macro change rather than a level. The intermediate pivot at $4,850 and the broken floor at $4,550 sit far enough above spot — 21% and 13.5% respectively — that they are irrelevant to this quarter. Morgan Stanley's $5,200 requires the Fed-sensitive buyer to return, and that buyer has been absent since March 4.
What has to break for the bulls: real yields need to fall from 4.60%, which requires either a genuine growth scare or a Fed that stops projecting hikes. The dollar needs to resume the 10% decline it delivered early in 2026 and then reversed. Private demand needs to return — GLD flows need to turn positive and hold, not for a session but for weeks. The 58% of managers expecting stagflation need to be right.
What has to break for the bears: nothing. Brent stays above $84. Iran keeps striking Gulf bases. Headline inflation reaccelerates through energy. The FOMC meets July 28-29 with September live. Real yields hold. Central banks keep buying 15 tonnes a month into a market that liquidates $2.91 billion in a day.
The base case sits at the line: gold chopping between $3,895 and $4,305 into the Fed, with the war supplying the inflation and the inflation supplying the yields and the yields supplying the selling. The metal is not broken. It is correctly priced for a world that pays 4.60% to wait.





