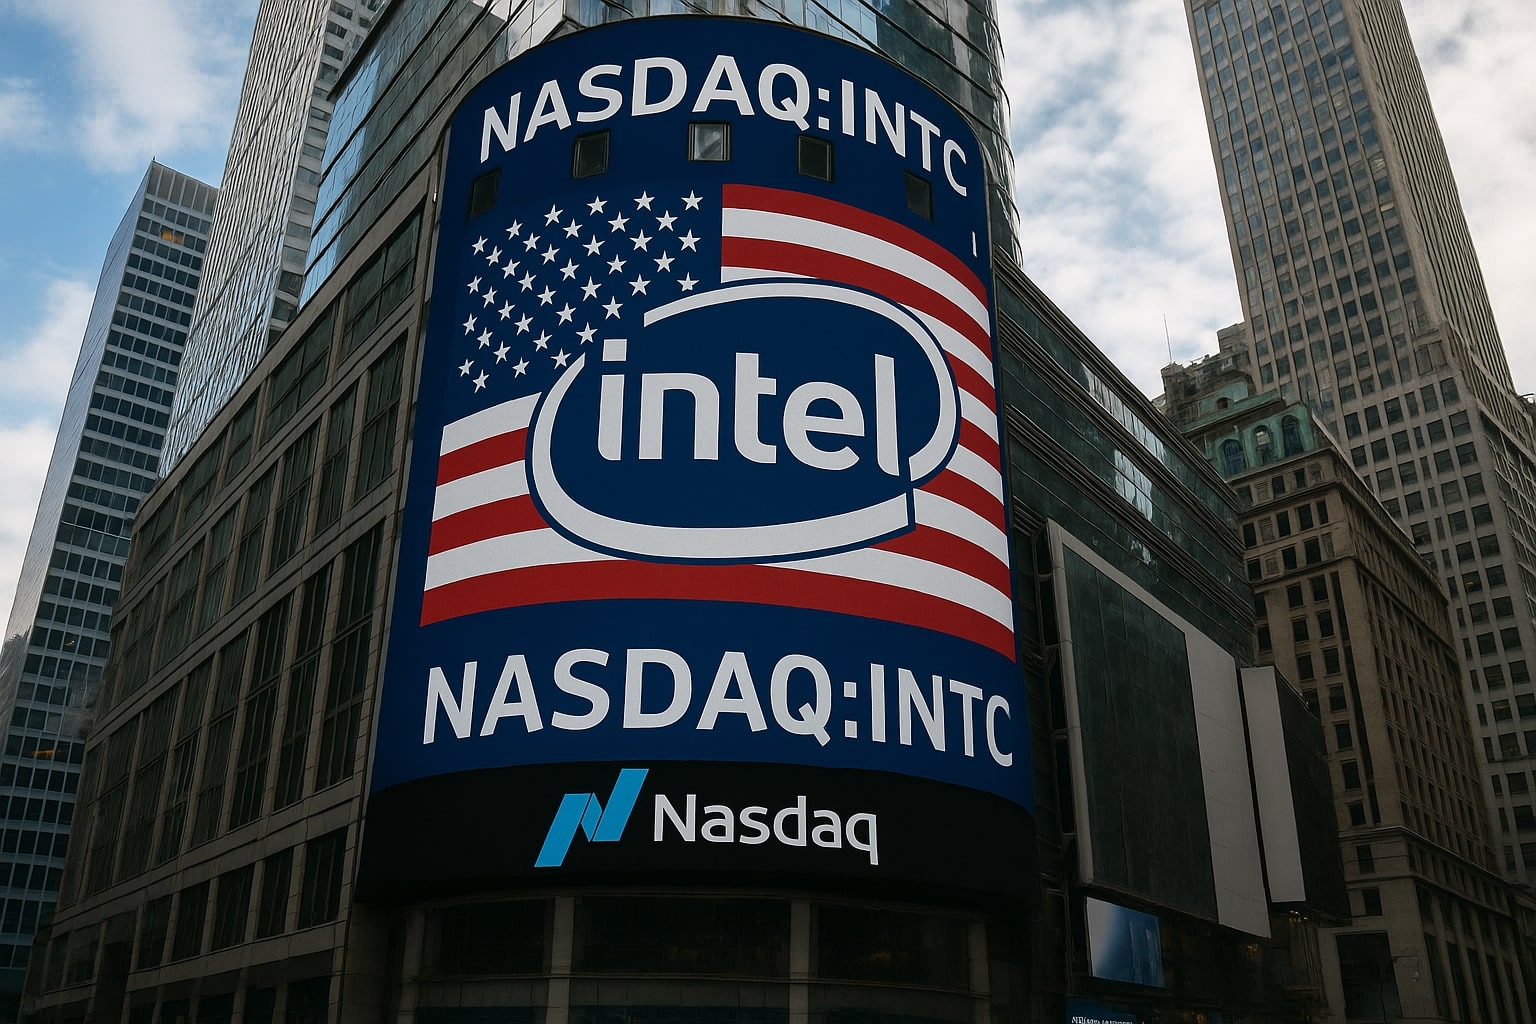
Intel Stock Price Forecast: NASDAQ:INTC Faces $20.5B Loss but U.S. Stake and Foundry Pivot Offer Survival Path
Shares trade at $24.34, near $106B market cap, as massive $18B CapEx, government backing, and foundry strategy reshape Intel’s future | That's TradingNEWS
NASDAQ:INTC Stock Analysis: Government Stake, Foundry Gamble, and Heavy Losses Shape Intel’s Future
Intel Share Price and Market Position
NASDAQ:INTC trades at $24.34 (-0.86%), placing its market capitalization near $106.5 billion, well below its $200+ billion valuation just three years ago. The stock has ranged between $17.67 and $27.55 over the past 52 weeks, lagging peers like Nvidia and AMD, which are riding the AI hardware boom. Trading volumes remain heavy, with over 103 million shares exchanging hands on average per day, reflecting high institutional churn and skepticism. Intel’s decline is rooted in collapsing profitability: after earning $19 billion net income in 2021, the company reported a staggering $20.5 billion net loss in 2025, underscoring the depth of its restructuring challenge.
Earnings Collapse and Guidance for 2025–2026
Intel’s Q2 2025 results showed revenue of $12.86 billion but a net loss of $441 million, translating to -0.10 EPS versus consensus for +0.01. Revenue growth is flat at $53.07 billion TTM, compared to $79 billion in 2021. Analysts expect a full-year 2025 EPS of just $0.12, before rebounding to $0.66 in 2026 as foundry orders begin to scale. Revenue estimates project $52.01 billion in 2025 and $53.77 billion in 2026, implying growth of only 3.4% next year. Gross margin has collapsed to 33%, down from 57% at Intel’s peak, while operating margin sits negative at -3.8%, underscoring persistent execution issues.
Massive Investment Program and Foundry Strategy
Intel is executing the most ambitious capital spending program in semiconductor history. CapEx for 2025 is guided near $18 billion, with mega-factories under construction in Arizona, Ohio, and Germany, designed for its 18A and 14A process nodes (1.8nm and 1.4nm). By 2030, Intel aims to double production capacity, transforming from a PC-centric chipmaker into a global foundry rival to TSMC and Samsung. Its Integrated Device Manufacturing (IDM 2.0) strategy is a high-risk, high-reward pivot. If execution succeeds, Intel could secure contracts from hyperscalers and even rivals, but failure would cement its decline.
Government Lifeline and Strategic Importance
The U.S. government has made Intel a national security priority. Washington recently committed $11.1 billion in direct equity, giving the U.S. a 9.9% stake in Intel. Combined with subsidies from the CHIPS Act, this effectively eliminates bankruptcy risk, as policymakers have made Intel “too important to fail.” Commerce officials compare Intel’s role to Boeing in aerospace or JPMorgan in finance: a systemic pillar. This backstop ensures Intel can complete its fabs, but it does not guarantee profitability. Unlike AMD or Nvidia, which rely on TSMC for fabrication, Intel must master advanced manufacturing itself—an uphill battle.
Competitive Dynamics Against TSMC, Samsung, AMD, and Nvidia
While Intel’s strategy leans on Western governments favoring domestic chip supply, rivals are not standing still. TSMC is building fabs in Arizona and Samsung in Texas, narrowing Intel’s geopolitical edge. However, both Asian players are keeping their most advanced production—2nm and below—in Taiwan and Korea, meaning their U.S. fabs will lag by at least one generation. This creates a niche for Intel, whose U.S. fabs will debut 18A technology as early as 2027. For customers like Microsoft and Apple, choosing Intel would offer both cutting-edge performance and reduced geopolitical risk, a crucial advantage in the event of Taiwan conflict scenarios.
In CPUs, Intel has been steadily losing market share to AMD, which has climbed to 21% server CPU share with its EPYC lineup. In GPUs, Intel remains a marginal player against Nvidia, which dominates AI accelerators, and AMD, which is carving a foothold. Intel’s hope is not to reclaim these markets directly but to win manufacturing contracts from them through Intel Foundry Services.
Debt, Cash Flow, and Balance Sheet Risks
Intel’s balance sheet reflects the strain of this transformation. The company holds $21.2 billion in cash but a debt load of $50.8 billion, giving it a net debt-to-EBITDA ratio above 3.9x, well past Fitch’s comfort threshold. Intel was recently downgraded to BBB with a Negative outlook, meaning refinancing could become costlier. Free cash flow is negative at -8.3 billion, as CapEx exceeds operating cash inflows. Intel’s EBITDA has collapsed from $34 billion in 2021 to barely $9 billion today, underscoring how steep the climb back will be.
Insider and Institutional Positioning
Institutional investors own 69.6% of Intel, with insider holdings negligible at 0.08%. Short interest remains elevated at 120 million shares, representing 2.75% of float, reflecting skepticism about Intel’s turnaround. To monitor management trades, see the Intel insider transactions. Interestingly, despite losses, insider selling has been minimal, indicating alignment with the long-term strategy. Still, the market remains divided, with analysts split between targets as low as $14 (Rosenblatt) and as high as $28. Consensus sits near $22, implying limited upside in the short term.
Valuation Compression and Market Discount
At today’s $24.34, Intel trades at a 2.0x price-to-sales ratio and 1.1x price-to-book, far below its historical 2.4x multiples. Its forward P/E of 222x reflects depressed near-term earnings, but if profits normalize to $10–$15 billion by 2028, multiples would compress sharply. A scenario where Intel earns just $10 billion net income on restored revenue above $70 billion could justify a $200 billion–$250 billion market cap, doubling from today’s levels. More bullish forecasts, assuming profitability returns to 2021 levels of $19 billion, would imply valuations closer to $400 billion, nearly 4x higher.
Technical Trading Outlook
INTC is consolidating above its 50-day moving average of $22.16 and 200-day average of $21.72, suggesting near-term support is intact. Resistance sits at $27.55, its one-year high. A breakout above that level would signal investor conviction in the foundry strategy. On the downside, a drop below $22 could trigger retests of $20 and $18, especially if execution falters or debt concerns intensify.
That's TradingNEWS
Read More
-
SCHD ETF: $28.41 Price, 3.67% Yield And The Real Story After Broadcom’s Exit
12.01.2026 · TradingNEWS ArchiveStocks
-
XRP ETFs XRPI At $11.95 And XRPR At $16.98 While $750M Flees Bitcoin And Ether Funds
12.01.2026 · TradingNEWS ArchiveCrypto
-
Natural Gas Price Forecast: NG=F Snaps Back from $3.17 Lows as UNG and BOIL Surge
12.01.2026 · TradingNEWS ArchiveCommodities
-
USD/JPY Price Forecast - USDJPY=X Stalls Just Under 158 While Markets Game a Break or Reversal Near 160
12.01.2026 · TradingNEWS ArchiveForex


