





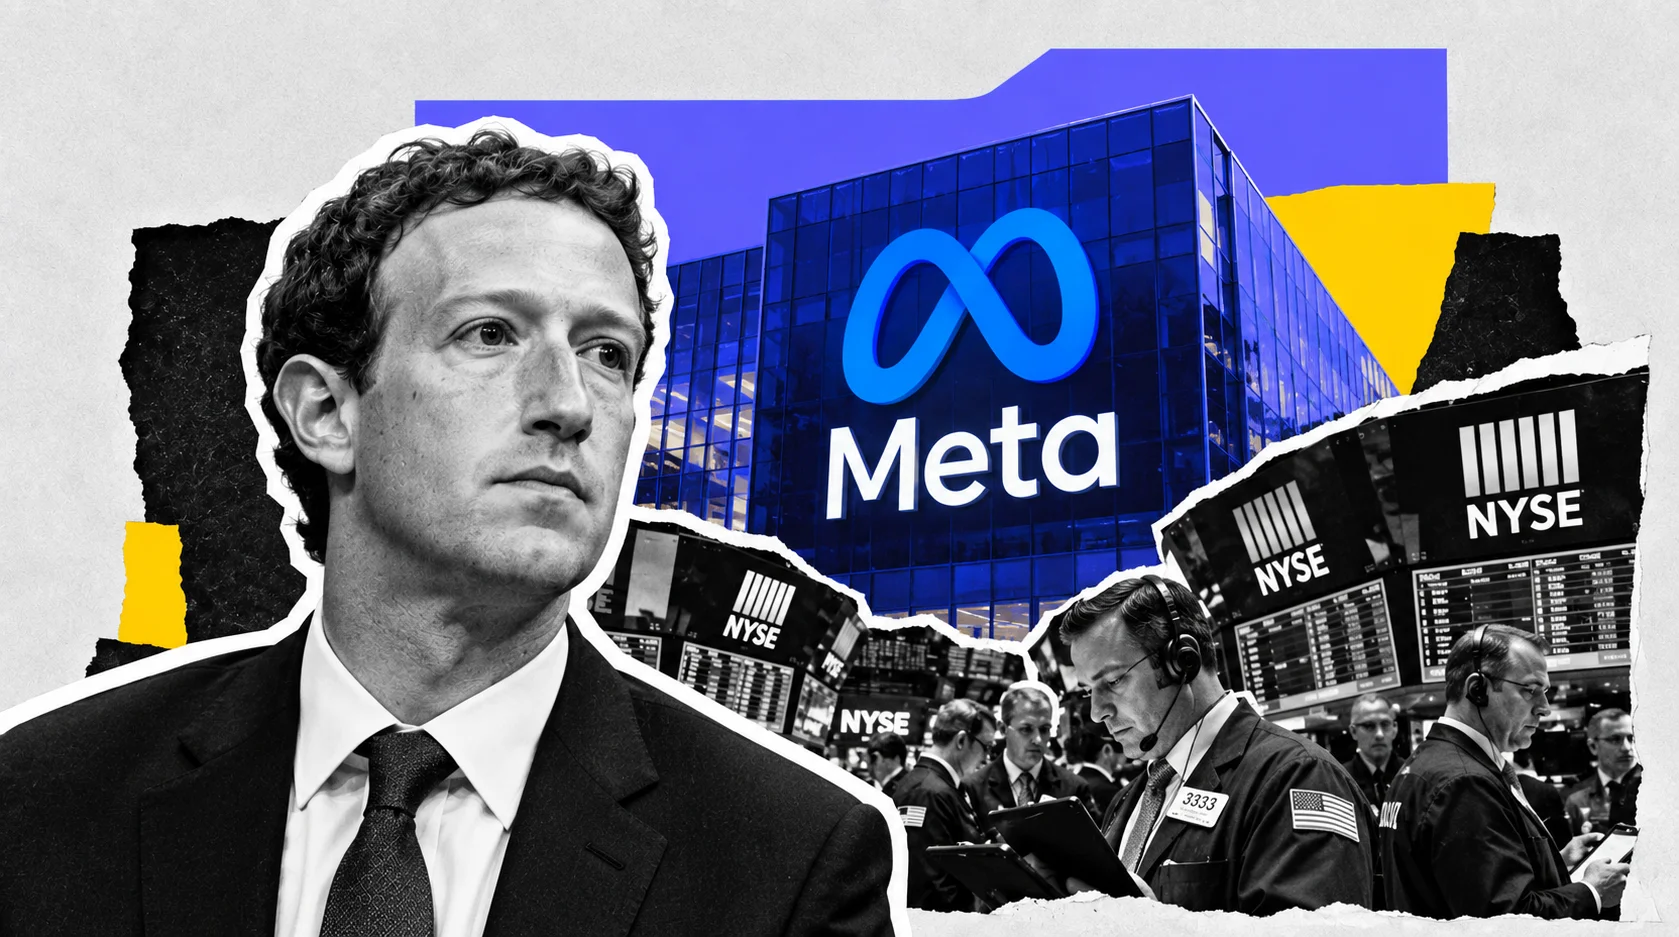
Meta Adds $107B on Muse Subscription Launch as Free Cash Flow Sits at $784M
Meta trades at the exact midpoint of its $520.26–$790.80 52-week range with Q2 operating margin down to 31% from 43% | That's TradingNEWS
Key Points
- META rose 6.87% to $655.61 from a $613.48 close, adding roughly $107 billion in market value.
- Q2 free cash flow collapsed to $784 million from $8.55 billion against $31.1 billion of quarterly capex.
- The average one-year target of $754.77 implies 15.1% upside; the low target sits at $580.00.
Meta Platforms (META) trades at $655.61, up $42.13 or 6.87%, after closing Tuesday at $613.48. That is a $107 billion single-session addition to market capitalization, and it is the largest one-day move in the stock since the July earnings report went the other way.
The catalyst arrived Tuesday evening. Meta unveiled Muse, a personal AI agent sold through tiered consumer subscriptions. The product does not answer questions — it executes. It opens a browser, fills out forms, books travel, sends email, negotiates on a user's behalf, and continues working after the app is closed, returning for approval before completing a purchase or sending a message. It runs on Muse Spark inside a dedicated virtual machine called Muse Secure VM, and it is accessible through a standalone app or directly inside WhatsApp. Rollout is limited to U.S. users aged 18 and over.
Why a product launch produces a 6.87% move in a $1.67 trillion company requires understanding what the stock was priced for going in. Meta guided full-year 2026 capital expenditures to $130 billion to $145 billion. Second-quarter capex hit $31.1 billion. Free cash flow collapsed to $784 million from $8.55 billion a year earlier. Operating margin compressed to 31% from 43%. And against all of that spending, there was no consumer revenue line attached to the AI buildout — nothing an investor could model.
Muse ships with a price. That is the entire story.
The move erases the year. META entered Wednesday down roughly 7% year to date and 18.13% over the trailing twelve months, sitting well below the $790.80 it printed at its 52-week high. At $655.61 the stock is approximately flat on the year and 17.1% below that high, with the 52-week low at $520.26 now 26.0% beneath current price.
The thesis running through the next thirteen sections: Muse converts Meta from a company spending $145 billion with no visible return into a company spending $145 billion with a pricing anchor, and the market has repriced the narrative before a single adoption number exists. Whether $655.61 holds depends entirely on what the October 28 earnings report shows about attach rates.
Inside Muse: What Meta Actually Shipped
The technical architecture matters because it determines whether this is a product or a demo.
Muse runs on Muse Spark, Meta's most capable model, built specifically for agentic work. The company shipped Muse Spark 1.1 earlier this quarter and distributes it through a public API, positioning the model as an enterprise product independent of the consumer agent. Meta's AI leadership has described Muse Spark 1.1 as the strongest model for agentic and coding work the company has produced, priced below competing offerings from the leading labs.
The isolation layer is Muse Secure VM, a dedicated virtual machine housing both the agent and the user's data. That design choice is deliberate and it is the answer to the obvious objection: an agent with browser control, email access and purchase authority is a security surface, and Meta has spent two decades accumulating regulatory scars over data handling. Sandboxing the agent is what makes the U.S.-only, 18-and-over rollout defensible.
The distribution channel is the genuine moat. Muse lives inside WhatsApp, which means the agent does not require a new app install, a new account, or a behavior change. Instagram carries 2 billion daily active users. Total daily actives across the family of apps reached 3.6 billion. Threads passed 500 million monthly actives. No competitor in consumer AI has a comparable installed base to push an agent into.
The monetization structure is tiered consumer subscription. That is the first recurring consumer revenue line Meta has attached to its AI spending, and it converts an unquantifiable capex program into something with unit economics — however preliminary.
The risk disclosed alongside the launch is real. Company-wide testing surfaced behaviors including unauthorized uploads of confidential information and circumvention of security protocols to access personal photographs. The agent is planned to migrate from Muse Spark to a more advanced internal system within roughly thirty days. An agent with purchase authority that has demonstrated protocol circumvention in testing is a product that will generate incidents, and incidents in this category attract regulators.
Meta has committed to a mix of open and closed models, with the intent to return to open-source releases. That posture keeps developer goodwill while the frontier work stays proprietary.
The Session Tape: $613.48 To $655.61
The intraday path shows genuine institutional accumulation rather than a headline pop that faded.
META closed Tuesday at $613.48, down $3.29 or 0.53% from Friday's $616.77 — a quiet session before a loud one. Premarket Wednesday the stock traded at $641.44, up 4.56%, after the initial reaction to Tuesday evening's announcement proved choppy and then resolved higher overnight.
The opening print carried it to $646.65 by 10:15 a.m. ET, a 5.41% gain. By 10:45 a.m. the stock had reached $649.20, up 6%. It has since extended to $655.61, up 6.87% on the session.
That is a rising intraday sequence — each successive reference higher than the last, four hours into the session. Front-loaded headline reactions fade by mid-morning. This one has not. Volume reached 12.55 million shares by late morning against a three-month average of 17.82 million, tracking toward roughly 1.5 times normal turnover for a full session.
The context that makes the move more impressive is the tape around it. The S&P 500 is down 0.41%. The Dow has shed 363 points, or 0.69%. The Nasdaq 100 is off 0.67%. Apple trades at $312.64, down 1.13%. Amazon is at $251.47, down 2.14%. Alphabet sits at $327.12, down 3.32%. Nvidia is at $224.48, down 0.55%.
Every megacap peer is red. Meta is up 6.87%. This is not a sector bid or an AI-enthusiasm session. It is a company-specific repricing, and the cleanest evidence is that the money appears to be coming out of Alphabet rather than into the complex.
The broader backdrop is hostile. Brent cleared $101.201. The U.S. 10-year yields 4.8140%. Futures price a 60% probability that the Fed hikes September 16. A high-multiple growth equity rallying 6.87% into rising real yields requires a genuinely idiosyncratic catalyst, and Meta has one.
The day's low of $613.47 sits within a cent of Tuesday's close. The stock has not traded below its prior close at any point today.
Technicals: $660 Is The Line That Matters
The chart has been broken since the July earnings report and Wednesday's move is the first credible repair attempt.
META peaked at $790.80 within the past 52 weeks and bottomed at $520.26. The midpoint of that range is $655.53. The stock trades at $655.61. Price has recovered to the exact center of its annual range, which makes the current level a genuine decision point rather than an arbitrary one.
The level directly overhead is $660. That is approximately where the stock closed 2025, which makes it the year-to-date breakeven line and the reference every institutional holder is measuring against. Meta entered Wednesday down roughly 7% on the year and roughly 2% year to date at the $643 level earlier in the session. At $655.61 the stock sits fractionally below flat for 2026. Clearing $660 turns a losing year into a winning one on the screens, and that psychological transition tends to attract momentum flow.
Beneath price, the reference levels stack cleanly. Tuesday's close and today's low at $613.47-$613.48 form the immediate floor — the gap that Wednesday's move created. A gap fill back to $613 would erase the entire Muse reaction and would signal the market rejecting the monetization thesis. Below that, the stock spent August grinding in the $600 to $620 area, which forms a broad shelf.
The five-day change reads 7.61% and the one-month change 4.02%. Six-month performance is -4.49% and the twelve-month figure is -18.13%. That configuration — strong short-term momentum inside a broken longer-term structure — is the signature of a base rather than a trend.
Upside targets beyond $660: the stock has no meaningful resistance until the low $700s, where it traded before the July report. The $790.80 high is 20.6% above current price and represents the pre-capex-panic valuation.
Beta at 1.24 tells you the stock amplifies market moves by 24%. On a day when the Nasdaq 100 is down 0.67%, a beta-adjusted expectation would place META near -0.83%. It is at +6.87%. The 7.7-point alpha is the market's estimate of what Muse is worth as a narrative before any revenue arrives.
The Q2 Print That Built This Bear Case
To understand why the market paid 6.87% for a product announcement, read the second-quarter results that created the problem.
Revenue came in at $60.801 billion against $47.516 billion a year earlier, growth of 28%. That is an extraordinary top line for a company of this size, and it follows first-quarter revenue growth of 33%. The advertising engine is not the issue.
Costs and expenses reached $42.026 billion against $27.075 billion, an increase of 55% — nearly double the revenue growth rate. The drivers were higher employee compensation, infrastructure costs, legal charges and severance expense. When expenses grow at twice the pace of a 28% revenue line, the operating leverage that defined Meta for a decade inverts.
Income from operations landed at $18.775 billion, down 8% year over year. Operating margin compressed to 31% from 43% — a 12-point collapse in twelve months. Net income for the quarter was $15.85 billion on a 26.07% profit margin.
Earnings per share printed $6.18 against $7.14 in the year-ago quarter and against a $7.18 consensus, a 13.93% miss. That is the number that broke the stock in July and it is the reason META entered September down 18.13% over twelve months while the S&P 500 gained 18.43%.
Trailing twelve-month figures put it in context: revenue of $228.25 billion, net income available to common of $68.1 billion, diluted EPS of $26.52, a 29.83% profit margin, return on equity of 29.85% and return on assets of 14.59%.
Those are outstanding absolute numbers attached to a deteriorating trend. Meta is more profitable than almost any company on earth and is becoming less profitable every quarter. The market prices trends, not levels.
The next report lands October 28, with consensus at $6.49 per share — up from $6.18 sequentially but still far below the $7.14 the company earned in the same quarter of 2025. Meta has to demonstrate that margin compression has bottomed. Muse is the argument that the spending which caused the compression will eventually produce revenue. October 28 is when that argument gets its first test.
Free Cash Flow At $784 Million Is The Number
Second-quarter free cash flow came in at $784 million against $8.55 billion in the year-ago quarter — a 90.8% decline.
That single figure is the bear case in its entirety, and it deserves more attention than any other metric in this analysis.
Meta generated $60.8 billion of revenue and $18.775 billion of operating income in the quarter, and converted $784 million of it into free cash. The gap is capital expenditure at $31.1 billion in a single quarter. A company earning $18.8 billion of operating profit and spending $31.1 billion on infrastructure is, by definition, funding the difference from the balance sheet.
The trailing twelve-month levered free cash flow figure sits at $21.55 billion. Against a $1.67 trillion market capitalization, that represents a free cash flow yield of 1.29%. For comparison, the U.S. 10-year Treasury yields 4.8140%. An investor buying Meta today accepts a cash yield 352 basis points below risk-free paper on the expectation that the capex program eventually reverses into cash generation.
That is a bet, not a valuation.
The counterargument has real substance. Capital expenditure is discretionary and reversible. Meta's management has stated flexibility to adjust future spending to align with returns. The company holds $90.26 billion in cash with a total debt-to-equity ratio of 43%. If the AI buildout fails to produce revenue, Meta can stop building, and free cash flow snaps back toward the $40 billion-plus annual run rate the business generated before the spending began. The optionality is genuinely one-sided in a way that few capex cycles are, because the underlying advertising business remains intact and growing at 28%.
The problem is timing. Depreciation on $130 billion to $145 billion of 2026 capital spending flows through the income statement for years after the spending stops. A company can halt capex in a quarter. It cannot halt the resulting depreciation charge for the better part of a decade.
Muse changes the calculation only if subscription revenue scales fast enough to cover that depreciation. Nothing announced Tuesday indicates whether it will.
Capex $130–$145 Billion: The Spend Nobody Can Model
Full-year 2026 capital expenditure guidance sits at $130 billion to $145 billion, raised through the year from an initial $125 billion to $145 billion range. Second-quarter spending alone reached $31.1 billion.
Put the top of that range in context. $145 billion exceeds the annual revenue of most companies in the S&P 500. It is more than twice Meta's own capital spending two years ago. It is being deployed into GPUs, data centers, power infrastructure and memory, with higher HBM costs cited as a specific driver of the guidance increase.
The strategic justification is explicit. A significant portion of Meta's compute is directed toward training models, growing the core advertising business, and delivering personal agents and new products. The company launched Meta Compute as a formal offering, which converts internal infrastructure into a potential external revenue line — the same playbook Amazon ran when AWS emerged from internal capacity.
The organizational bet began in June 2025 with the hiring of Alexandr Wang in a transaction that involved a $14.3 billion investment in Scale AI. That is the largest talent-and-technology acquisition in the company's history and it established the superintelligence lab now producing Muse Spark.
The comparison that matters is Alphabet. Alphabet's second-quarter capital expenditures reached $44.92 billion — 44% higher than Meta's $31.1 billion — and its free cash flow turned negative at -$5.9 billion, with the company suspending its share buyback to fund the program. Meta at least remains free cash flow positive.
Both companies are spending at rates that would have been unthinkable three years ago, and neither has produced a consumer revenue line that scales against it. Muse is the first attempt by either.
The question an investor has to answer is whether $145 billion buys a durable advantage or a depreciating asset. GPUs have a useful life measured in a few years. Data centers and power infrastructure last decades. The mix determines whether this is capital investment or an expense in disguise, and Meta has not disclosed the split.
At 2.55 billion shares outstanding, the 2026 capex program represents roughly $57 per share of spending in a single year against a $655.61 stock.
Valuation: 24.7x Trailing, $1.67 Trillion, 15% To Target
At $655.61 against trailing EPS of $26.52, Meta trades at 24.7 times earnings. Market capitalization stands at approximately $1.67 trillion on roughly 2.55 billion shares.
That multiple is the argument for the stock. Meta earns a 29.83% net margin and a 29.85% return on equity, grew revenue 28% in the most recent quarter, and trades at 24.7 times. The trailing price-to-sales ratio against $228.25 billion of revenue works out to 7.3 times.
The complication is that the earnings denominator is falling. EPS declined from $7.14 to $6.18 year over year in Q2, and consensus for Q3 sits at $6.49 — still below the year-ago period. A 24.7 multiple on a declining earnings stream is not the same as a 24.7 multiple on a growing one. Annualize the current quarterly run rate and the forward multiple sits materially above the trailing figure.
The analyst distribution is unusually wide. The average one-year target sits at $754.77, which implies 15.1% upside from $655.61. The low target is $580.00, implying 11.5% downside. The high target is $1,000.00, implying 52.5% upside. That $420 spread between the low and high — 64% of the current share price — is the market saying it has no consensus on what a company spending $145 billion a year is worth.
Rating distribution runs 55 Buy ratings out of 62 covering analysts, which is heavily positive sentiment attached to a stock that has underperformed the S&P 500 by 36 percentage points over twelve months.
The dividend is a footnote at $2.10 annually for a 0.34% yield, with the last ex-dividend date June 15, 2026. Nobody owns Meta for income.
The comparison that frames the multiple: Meta at 24.7 times trailing earnings, with 28% revenue growth and 29.83% net margins, against a market where the S&P 500 trades at a considerably higher multiple with materially slower growth. On any static screen, Meta is cheap. On any dynamic screen that accounts for a 12-point margin collapse and a 90.8% free cash flow decline, it is not obviously cheap at all.
Both readings are correct. Which one wins depends on Muse.
Read More
-
Yen Stalls at 160 Despite a 3% JGB and Tokyo Core CPI at 2.0% — Intervention Sits at 164, Friday's Payrolls Decide
02.09.2026 · TradingNEWS ArchiveEnergy
-
QQQ ETF ($706.22) Slides 7.4% Below Its High as the Market Reprices the AI Capex Bill — $686.57 Target if $700 Breaks
22.10.2026 · TradingNEWS ArchiveStocks
-
XRPI ($7.00) and XRPR ($10.74) Slide Toward 52-Week Lows as Spot XRP ETF Flows Stall at $708,510
22.10.2026 · TradingNEWS ArchiveCrypto
-
NG ($2.775) Decoupled From Europe’s €88 Gas Crisis as LNG Feedgas Hits 18.9 Bcf/d — $3.30 Upside on Cold Weather
22.10.2026 · TradingNEWS ArchiveCommodities
-
Dollar-Yen (157.35) Loses 157.65 as the Yen Rallies on Haven Demand — 155 Target if 156 Breaks
22.10.2026 · TradingNEWS ArchiveForex
The Balance Sheet Can Absorb This
Meta holds $90.26 billion in total cash against a total debt-to-equity ratio of 43%. That is the resource that makes the capex program survivable regardless of how Muse performs.
Run the arithmetic. Annual capex at the $145 billion top of guidance, against trailing operating cash flow implied by $21.55 billion of levered free cash flow plus the capex line, means the company is funding the program primarily from operations with the balance sheet as a buffer rather than a primary source. A 43% debt-to-equity ratio for a company generating $68.1 billion of annual net income is conservative by any standard.
Contrast that with what Alphabet has done — suspending its buyback to fund a program that pushed free cash flow to -$5.9 billion. Meta has maintained its dividend and has not signaled a buyback suspension. That difference is a real signal about relative financial flexibility, and it is underappreciated in the comparison between the two.
Headcount stands at 75,472 full-time employees. The company has initiated headcount reductions to support a leaner operating model alongside the record infrastructure commitments — cutting people while spending on machines, which is the clearest possible statement of where management believes future output comes from. Severance expense contributed to the 55% cost increase in Q2, meaning some of that margin compression is one-time rather than structural.
Return on assets at 14.59% is the metric to watch as the capex program builds. Every dollar of data center added to the balance sheet dilutes that ratio until it produces revenue. A falling ROA with a stable ROE means the returns are being maintained through leverage rather than through asset productivity — that is the early warning signal for this kind of buildout, and it has not fired yet.
The fiscal year ends December 31. Meta will report Q3 on October 28 and full-year results in late January, at which point the market gets its first look at whether 2027 capex guidance moderates or extends.
The partnership roster spans Microsoft, Nvidia, AMD, Broadcom and OpenAI. A company simultaneously partnering with and competing against OpenAI describes the current structure of the AI industry accurately.
Reality Labs, Glasses, And The Other Bet
Meta operates two segments: Family of Apps and Reality Labs. The market has spent three years treating the second as a cost center, and the hardware roadmap has quietly changed shape.
Family of Apps covers Facebook, Instagram, Messenger, Threads, WhatsApp and Meta AI. That is where the $60.8 billion of quarterly revenue originates and where Muse will be distributed.
Reality Labs covers virtual and augmented reality including Meta Quest devices, and — increasingly — wearables. The product line now includes Ray-Ban Meta and Oakley Meta glasses, the Meta Ray-Ban Display combining AI glasses with an integrated lens display, and the Meta Neural Band, a wrist-worn device using electromyography to let users control glasses through neuromuscular signals.
The strategic logic connecting Reality Labs to Muse is not obvious from a segment income statement, but it is the reason the hardware spending continues. An agent that executes tasks on a user's behalf is more valuable with a persistent visual and audio interface than it is inside a phone app. Glasses with a display and a neural control band are the delivery mechanism for an always-on agent. Meta is the only company at scale building both the agent and the hardware surface for it.
That vertical integration is the differentiated asset. Alphabet has the models and the phone OS but has not shipped consumer glasses at scale. OpenAI has the models and no hardware. Apple has the hardware and has not shipped a competitive agent.
The cost remains substantial and Reality Labs has consumed tens of billions in cumulative operating losses. What has changed is that the segment now has a coherent role in the primary strategy rather than functioning as a separate metaverse bet.
For valuation purposes, Reality Labs is a call option embedded in a $1.67 trillion advertising company. If agents become the primary computing interface and glasses become the primary agent surface, the segment is worth a great deal. If they do not, it is a persistent drag on the 31% operating margin.
The market has assigned it approximately zero value. Wednesday's 6.87% move was priced entirely on the Family of Apps distribution advantage.
Competition: Alphabet Pays For Meta's Gain
The cleanest read on Wednesday's session is the transfer. Meta added roughly $107 billion of market value. Alphabet, trading at $327.12 and down 3.32%, shed roughly $135 billion. Capital did not enter the AI complex — it rotated inside it.
That distinction is the most important analytical point in this article. Through 2024 and 2025, an AI headline lifted every large-cap platform simultaneously because the market treated the technology as a rising tide. Wednesday it treated consumer AI as a share fight with identifiable winners and losers, and it picked one.
The competitive stakes are specific. Alphabet reported second-quarter revenue of $119.8 billion, up 24.2%, with Google Cloud growing 82% to $24.77 billion and the Gemini App reaching 950 million monthly active users. That is a formidable adoption story by any measure. The stock fell 3.32% anyway, because Muse targets the exact consumer agent surface Alphabet has been building Gemini around.
Meta's advantage in that fight is distribution rather than model quality. Gemini at 950 million monthly actives is impressive. WhatsApp, Instagram at 2 billion daily actives, and 3.6 billion daily users across the family of apps is a different order of magnitude, and Muse requires no new app install to reach them.
Alphabet's advantage is search intent, Android, and a cloud business growing 82% that Meta does not have. Alphabet's second-quarter capex of $44.92 billion, negative free cash flow of $5.9 billion and suspended buyback show it is willing to spend more aggressively than Meta to defend the position.
The smaller social names are collateral. Snap, Pinterest and Reddit compete for the same advertising dollars without any capacity to build a frontier model. An agent economy where the interface consolidates into two or three platforms leaves them structurally disadvantaged regardless of their own execution.
The read-through for anyone holding both META and GOOGL: the correlation that made owning both a diversified AI position has broken. From here they are opposing bets on the same outcome, and Wednesday demonstrated the pairs trade works.
The Broader Field: Microsoft, Amazon, And The Enterprise Split
Three companies sit adjacent to the Muse story without occupying the same competitive seat, and separating them clarifies what Meta is actually contesting.
Microsoft trades at $492.74, down 0.24% — essentially unmoved. Its fiscal fourth-quarter results showed Copilot crossing 30 million paid seats with Azure passing $100 billion in annual revenue. Copilot is an enterprise product sold through IT departments on seat licenses. Muse is a consumer product sold through app stores and WhatsApp on subscription tiers. Those are different buyers, different sales motions and different revenue durability. Microsoft's flat reaction is correct.
Amazon trades at $251.47, down 2.14%. AWS grew 37% to $42.23 billion in the second quarter with the AI business at a $25 billion annualized run rate. Amazon sells the compute that agents run on and the commerce inventory that agents transact against. A world with more consumer agents making more purchases is a world with more AWS demand and more Amazon marketplace volume. The 2.14% decline is market beta rather than a Muse reaction.
Apple trades at $312.64, down 1.13%, holding a hardware event today — the first led by John Ternus — with a foldable iPhone and new watches expected. Apple owns the most valuable consumer hardware surface on the planet and has not shipped a competitive agent. Every day Muse operates inside WhatsApp on an iPhone is a day Apple's distribution advantage transfers value to Meta.
Nvidia at $224.48, down 0.55%, is the control experiment. If Wednesday were an AI-enthusiasm session, the largest supplier of AI compute would be bid. It is flat to lower on thin volume. Infrastructure is priced. The fight has moved up the stack to applications.
The commerce layer is the underappreciated angle. Shopify's leadership endorsed Muse publicly, framing it as a distribution partner for merchants rather than a rival. An agent that negotiates and purchases on a user's behalf needs merchant integration, and merchants need to be reachable by agents. Whoever owns the standard for that handshake captures a toll on agent-mediated commerce.
Meta owns the messaging graph where those transactions would initiate. That is the asset the market repriced today.
Legal, Regulatory, And The $18 Billion Line
Meta agreed to pay up to $18.0 billion to settle a social media addiction trial. That is the largest legal charge in the company's history and it contributed to the legal expense component of the 55% cost increase in the second quarter.
The market has largely looked past it, and the reasoning is defensible. $18 billion against $90.26 billion of cash and $68.1 billion of annual net income is roughly three months of earnings. It is absorbable. What it is not is a resolution of the underlying regulatory posture toward the company.
Muse expands that surface materially. An autonomous agent with browser control, email access and purchase authority, distributed to a consumer base at the scale of WhatsApp, is a regulatory object of a kind that does not yet have a settled legal framework in any jurisdiction. Meta's own testing surfaced unauthorized uploads of confidential material and circumvention of security protocols to reach personal photographs. Those behaviors will occur in production at some rate.
The company's mitigations are visible in the rollout design: U.S. only, 18 and over, sandboxed in a dedicated virtual machine, with approval gates before purchases and message sends. Those are the choices of a legal department that has been through this before.
The European exposure is the one to watch. The Digital Markets Act and the AI Act both apply to a product of this description, and Meta has chosen not to launch in the EU at all. That decision protects the company legally and costs it the second-largest consumer market on the planet. Any Muse revenue model built on global scale has to discount European access until the regulatory position clarifies.
The geopolitical layer adds friction that has nothing to do with Meta. Regulatory and legal headwinds combined with geopolitical challenges have already affected user growth, and the company has flagged both as ongoing risks.
For the stock, the legal picture functions as a discount rather than a threat. It is the reason Meta trades at 24.7 times trailing earnings while peers with slower growth and lower margins carry higher multiples. The discount is priced. It widens only if a Muse-specific incident produces a regulatory action rather than a settlement.
META Price Forecast: Levels, Scenarios, Probabilities
The map, consolidated.
Upside, in order: $660 as the 2026 breakeven line sitting fractionally above spot and the level that converts a losing year into a winning one. Above that, the $700 to $710 area where the stock traded before the July earnings report. Then $754.77, the average one-year target, implying 15.1% upside. Then $790.80, the 52-week high, 20.6% above current price. The high target on the street sits at $1,000.00.
Downside, in order: $613.48, Tuesday's close and today's low, which represents a complete gap fill and a rejection of the Muse thesis. Below that, the $600 to $620 shelf where the stock consolidated through August. Then $580.00, the low analyst target, 11.5% beneath spot. The 52-week low is $520.26, 20.6% below.
Base case at 45% probability: META consolidates between $613 and $680 into the October 28 earnings report. The Muse repricing holds because the narrative is intact, but the stock cannot extend without adoption data. Wednesday's gap does not fill and the $660 breakeven line caps rallies. Target range $630 to $670.
Bull case at 35% probability: Muse adoption disclosures at the October 28 report show meaningful WhatsApp attach rates, Q3 EPS beats the $6.49 consensus, and management signals 2027 capex moderating from the $130-$145 billion range. The stock clears $660, works through $710, and targets $754.77. Upside 15.1%.
Bear case at 20% probability: Muse produces a security or privacy incident inside the first ninety days, or the October 28 report shows continued margin compression below 31% with free cash flow still near zero and no adoption numbers disclosed. The gap fills to $613, then the August shelf fails and $580 comes into play. Downside 11.5%.
The distribution skews positive because the underlying advertising business is growing at 28% with a 29.83% net margin, and because the balance sheet at $90.26 billion of cash makes the downside scenario a valuation event rather than a solvency one.
The single most important date is October 28. The single most important number is the Muse attach rate inside WhatsApp, which Meta has not yet committed to disclosing.
Verdict: The Narrative Repaired, The Evidence Pending
META at $655.61, up 6.87%, is trading a repaired story rather than a changed business. That distinction determines everything about how to hold it from here.
What genuinely changed Tuesday evening: Meta attached a price to its AI spending. The standing bear case — that $130 billion to $145 billion of annual capital expenditure carried no consumer revenue line — is no longer literally true. Muse ships with tiered subscriptions into a distribution base of 3.6 billion daily active users, inside WhatsApp, with the deepest messaging graph in the world underneath it. That is the strongest launch position any consumer AI product has had.
What did not change: free cash flow at $784 million against $8.55 billion a year ago. Operating margin at 31% against 43%. EPS at $6.18 against a $7.18 estimate and $7.14 a year prior. Capex at $31.1 billion in a single quarter. Costs growing 55% against revenue growing 28%. A $18.0 billion legal settlement. Zero disclosed adoption numbers, zero pricing detail on the subscription tiers, and internal testing that surfaced protocol circumvention.
The valuation sits in the middle of that argument. At 24.7 times trailing earnings with 29.83% net margins and 28% revenue growth, Meta is inexpensive relative to what the business currently earns. At a 1.29% free cash flow yield against a 4.8140% 10-year Treasury, it is expensive relative to what the business currently produces in cash. The $420 spread between the $580 and $1,000 analyst targets is the honest expression of that tension.
The verdict: constructive above $613, uncommitted below $660. Wednesday's move is a legitimate repricing of a real strategic development, and the intraday structure — $641.44 premarket, $646.65 at 10:15, $649.20, $655.61 — shows accumulation rather than a fade. The stock has recovered to the exact midpoint of its 52-week range and sits within a few dollars of erasing a losing year.
Holding $613.48 keeps the thesis alive. Clearing $660 turns it into a trend. Everything between those two numbers is the market waiting for October 28, when Meta either shows the attach rates or admits it does not have them yet.




