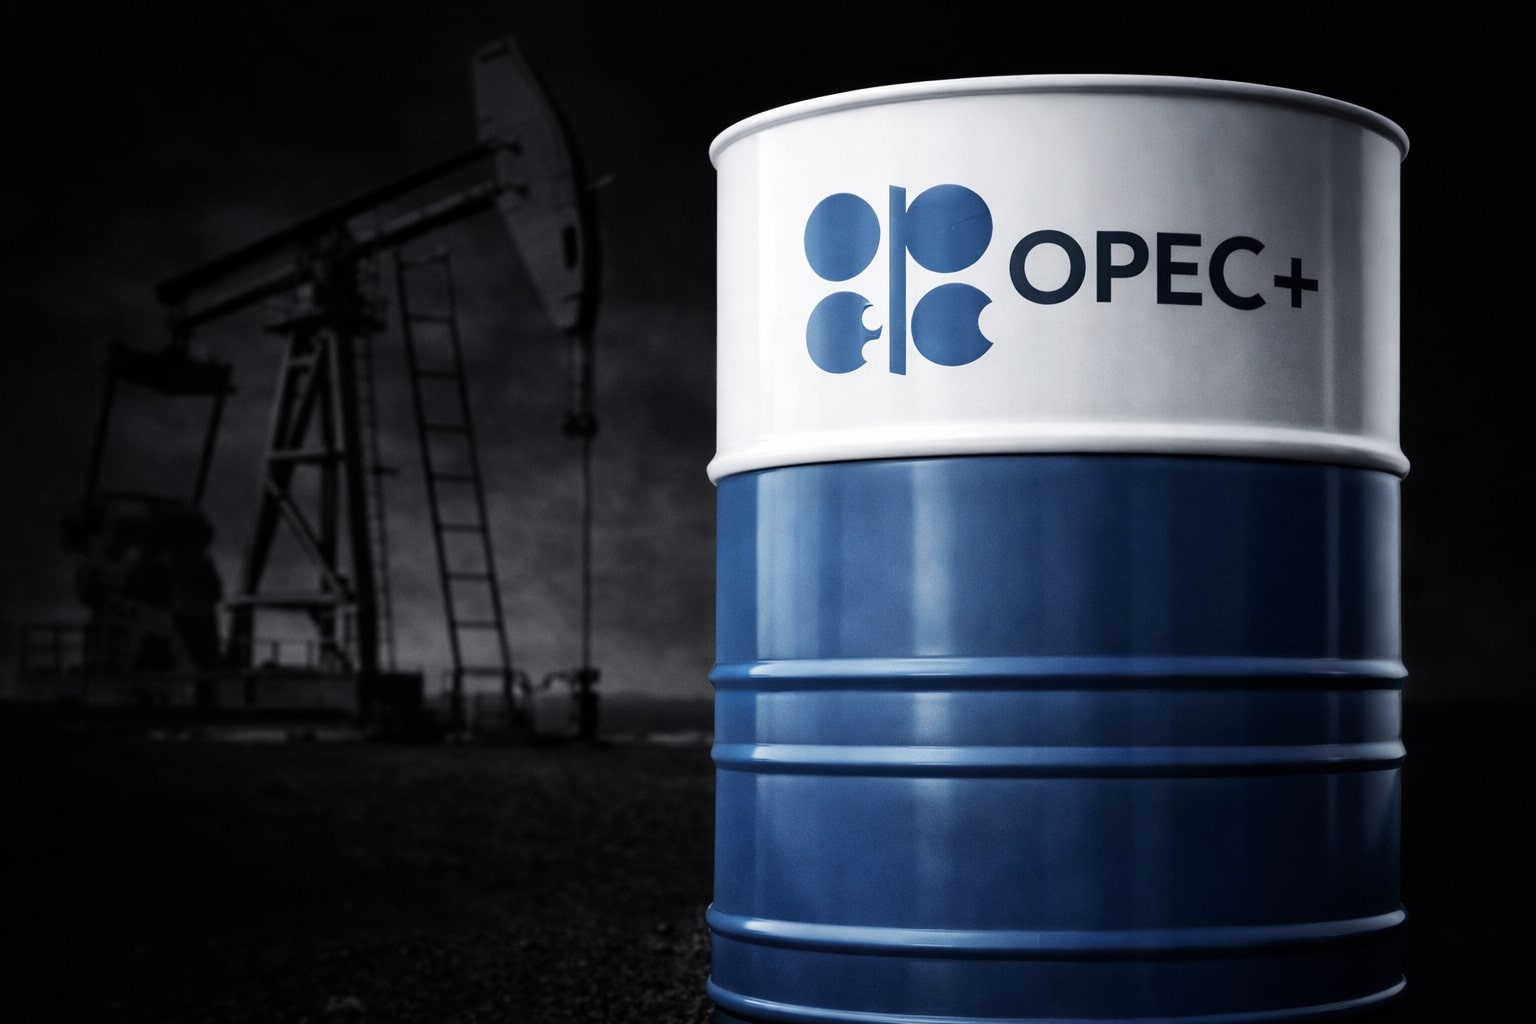
Oil Price Analysis Shows WTI and Brent Bracing for Upside Break as U.S. Shale Economics Force Higher Floors
Despite unexpected 7.7 million-barrel crude build and softer refinery margins, tightening shale breakevens in the mid-$60s and OPEC+ supply discipline underpin a bull-leaning setup with $75 next on deck | That's TradingNEWS
Supply Dynamics Underpinning WTI (CL=F) At Sixty-Nine Forty-Five
Crude inventories swelled by a surprising 7.7 million barrels in the week to July 25, lifting U.S. commercial stocks to 426.7 million barrels—still 6 percent below the five-year seasonal average but far above the 1.5 million-barrel build reported by the API the prior day. Despite this build, West Texas Intermediate (CL=F) held firm at $69.45 per barrel as traders weighed the drawdowns in gasoline and distillates. Global benchmark Brent (BZ=F) mirrored the strength, trading at $72.47 after EIA data showed crude exports hovering near record highs. The disconnect between headline inventory builds and price resilience underscores a market balancing tight prompt supplies with ample longer-dated barrels.
Shale Economics Force Higher Price Floors For U.S. Production
Standard Chartered’s commodities team estimates that the breakeven for new U.S. shale wells has climbed into the mid-$60s, up from the mid-$50s just two years ago, as steel, labor and fracturing costs surge. Rystad Energy’s May analysis echoed this, placing new-well economics around $68 per barrel. Baker Hughes data revealed U.S. oil rigs contracting for a 13th straight week to a 46-month low of 415, with Permian rigs in Midland at 91 and Delaware at 146. A sustained WTI price below $70 risks a precipitous decline in shale output unless capital budgets expand, making $75–$80 the more realistic floor for maintaining U.S. supply.
OPEC+ Production Strategy And Long-Run Price Calibration
Standard Chartered projects that front-month Brent will average $61 in 2025, climbing to $78 in 2026 and $83 in 2027, while NYMEX WTI is expected at $58, $75, and $80 over that same span. J.P. Morgan’s forecasts assign Brent $66 in 2025 and $58 in 2026, with WTI at $62 and $53. The EIA’s STEO pegs Brent at $68.89 this year and $58.48 next, with WTI at $65.22 and $54.82. These mid-cycle estimates reflect OPEC+’s commitment to maintain production levels near current quotas, preventing a price collapse while capping upside until non-OPEC supply growth slows.
Geopolitical Catalysts And Tariff Threats From Washington
President Trump’s threats of secondary tariffs on purchasers of Russian oil have compelled Indian state refiners—IndianOil, BPCL, HPCL and MRPL—to halt Russian purchases this week, pivoting to Middle Eastern and West African grades. Russia once supplied one-third of India’s crude; that flow now faces potential 25 percent levies, driving prompt Brent volatility around $70. Meanwhile, U.S. sanctions on Iranian shipping and new China-Russia energy ties keep maritime logistics under scrutiny, adding episodic price spikes around geopolitical headlines.
Refining Margins, Product Flows And Seasonal Demand
U.S. Gulf Coast refiners processed an average 17.9 mb/d of crude in Q2, up 0.4 mb/d year-on-year, even as gasoline inventories climbed 2.0 million barrels and distillates drew 1.1 million barrels. Reformulated gasoline margins hit $12.50 per barrel in late July, slipping from spring highs as demand cooled. Summer driving season lifted product draws but refinery maintenance schedules in August may inject renewed crack-spread volatility, supporting crude once refiners ramp back up.
Technical Landscape: CL=F Carving A Bullish Flag Pattern
On the daily chart, WTI has traced a narrowing range between $68 and $71, forming a flag consolidation off the July rebound from $66.50. The 50-day moving average at $69.20 and the 200-day at $67.80 align to provide dynamic support. A breakout above $71.25—the flag’s upper trendline—would target a measured move toward $75, while a drop below $68 could retest $66. RSI sits at 58, neither overbought nor oversold, indicating room for directional conviction once the pattern resolves.
Insider Insights And Industry Positioning
Major oil majors have remained net buyers of their own shares this quarter, with insider transactions on TradingNews.com profiles showing ExxonMobil (XOM) executives purchasing stock when crude dipped below $67, signaling their comfort with current valuations. Chevron (CVX) insiders similarly added to holdings in June as Brent oscillated in the low $70s. The insider confidence aligns with our bullish view, as management teams hedge their production risk by accumulating equity at these price points.
Strategic Outlook: Tactical Caution Amid Fundamental Strength
The interplay of robust shale breakevens, OPEC+ discipline, and persistent geopolitical frictions supports a bullish tilt on WTI (CL=F) and Brent (BZ=F), with $75 serving as a near-term upside pivot. Dips into the $68–$69 zone offer strategic entry opportunities for investors targeting a breach above $71.25. Protective stops just below $67 balance shale sensitivity and global demand risks. With longer-dated contracts firmly anchored at $70, the next directional catalyst may stem from the August inventory cycle or OPEC+ signals at the forthcoming ministerial meeting.
That's TradingNEWS
Read More
-
SCHD ETF: $28.41 Price, 3.67% Yield And The Real Story After Broadcom’s Exit
12.01.2026 · TradingNEWS ArchiveStocks
-
XRP ETFs XRPI At $11.95 And XRPR At $16.98 While $750M Flees Bitcoin And Ether Funds
12.01.2026 · TradingNEWS ArchiveCrypto
-
Natural Gas Price Forecast: NG=F Snaps Back from $3.17 Lows as UNG and BOIL Surge
12.01.2026 · TradingNEWS ArchiveCommodities
-
USD/JPY Price Forecast - USDJPY=X Stalls Just Under 158 While Markets Game a Break or Reversal Near 160
12.01.2026 · TradingNEWS ArchiveForex


