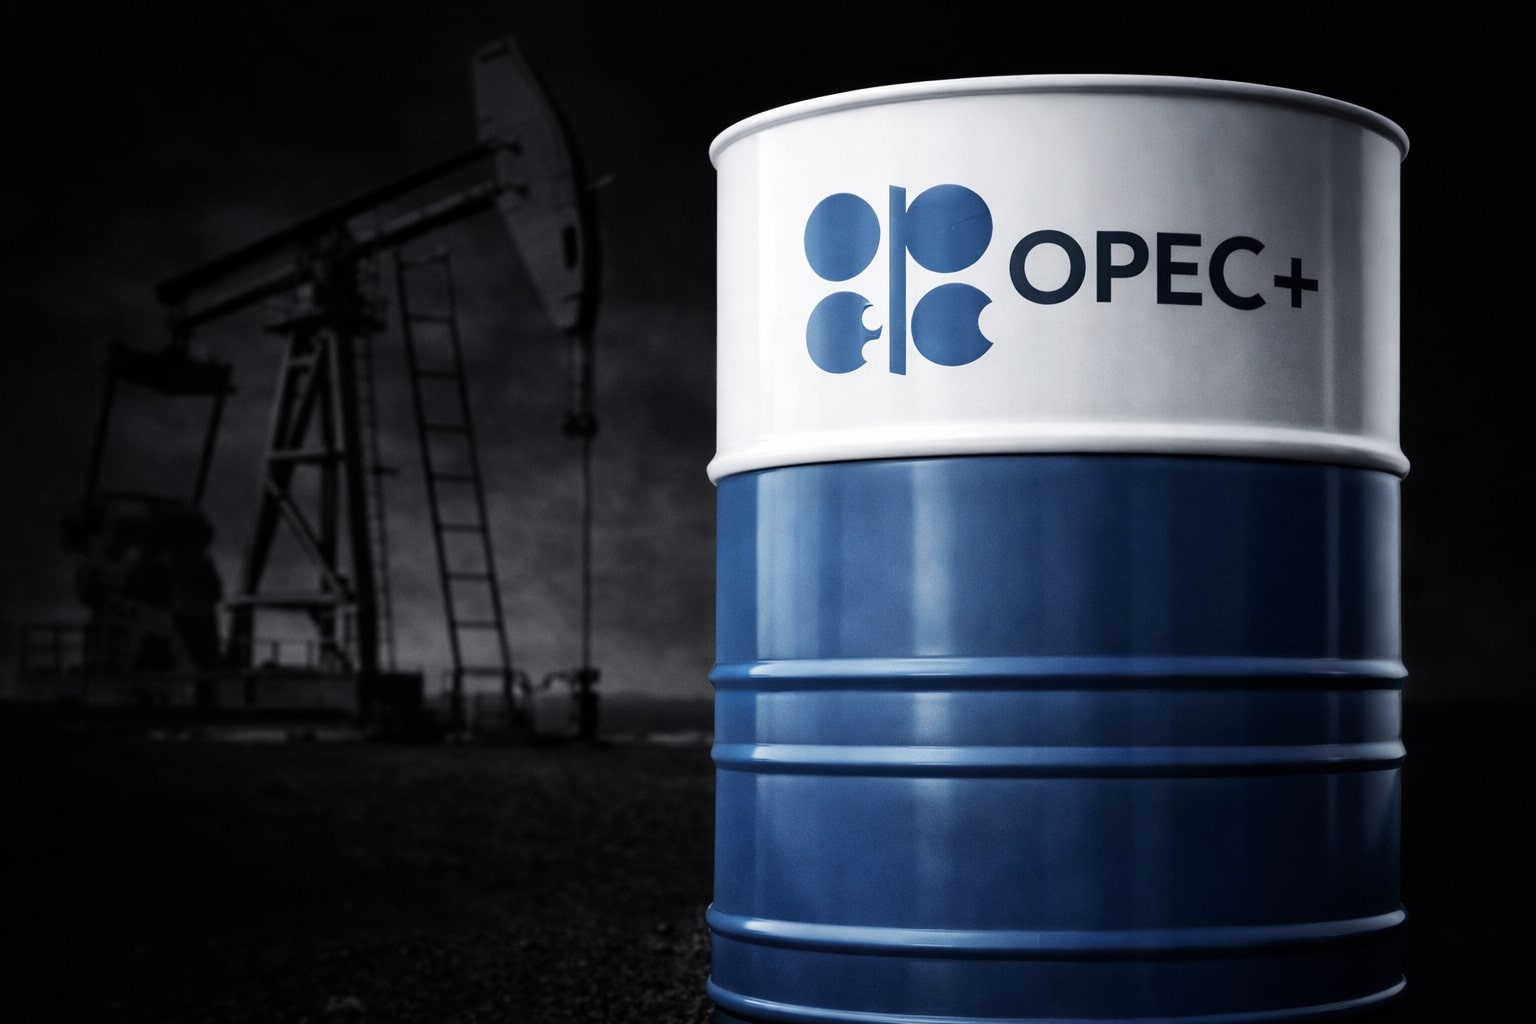
Oil Price Forecast: WTI (CL=F) Falls to $58.06 and Brent (BZ=F) Hits $62.56 as Global Supply Surges and OPEC+ Loses Grip
Crude markets extend losses as U.S. output hits a record 13.86M bpd, Russian barrels re-enter trade flows, and weak Chinese demand deepens the global oil glut | That's TradingNEWS
Oil Price Forecast: WTI (CL=F) Drops Below $60 as Global Glut, OPEC+ Strains, and U.S. Output Crush Market Support
WTI (CL=F) and Brent (BZ=F) Collapse Under Supply Pressure
Crude markets are facing their most intense oversupply phase since 2020. WTI (CL=F) settled at $58.06, down 1.59%, while Brent (BZ=F) closed at $62.56, losing 1.29% as investors dumped positions following renewed peace talks between Washington and Moscow that could unlock millions of barrels of Russian exports. The weekly loss reached 3.4% for WTI and 2.8% for Brent, extending a month-long decline driven by surging production and weak demand from Asia.
U.S. crude inventories continue to climb, with total stockpiles surpassing 480 million barrels, their highest since 2021. The global balance is deteriorating fast as supply expands across both OPEC and non-OPEC nations, pushing prices below key technical support levels.
Surging U.S. Output Reshapes Market Dynamics
The United States remains the central shock absorber of the oil market. Output surged to a record 13.86 million barrels per day (bpd) in November, reinforcing America’s dominance as the world’s largest producer. This surge has dismantled OPEC+’s control over pricing. The Energy Information Administration (EIA) confirmed that U.S. shale continues to scale efficiently, with new rigs in the Permian and Bakken basins producing at record yield per well.
While U.S. producers like ExxonMobil (NYSE:XOM) and Chevron (NYSE:CVX) boost volumes, exports from the Gulf Coast are flooding global markets. The result is a direct compression in global benchmarks as U.S. barrels replace Middle Eastern and Russian grades across Europe and Asia.
OPEC+ Loses Pricing Power Amid Internal Divisions
OPEC+’s latest policy shift—choosing to defend market share instead of prices—marks a return to the 2014 strategy that triggered a prolonged bear market. Despite cuts, the coalition’s overall production rose to 108.2 million bpd, as several members exceeded quotas to safeguard revenue.
Saudi Arabia faces fiscal stress with breakeven oil near $83 per barrel, while Russia, burdened by sanctions and war costs, continues discounted exports near $36 per barrel through shadow fleets.
The International Energy Agency (IEA) projects a 4% global surplus by 2026, with OPEC+ expected to resist deeper cuts. That imbalance signals that the group’s ability to influence prices has eroded permanently.
Peace Talks Between the U.S. and Russia Add to Bearish Sentiment
Oil’s latest drop accelerated after Washington pushed a Russia–Ukraine peace framework, which could eventually reintroduce up to 48 million barrels of stranded Russian crude into circulation. Sanctions remain in place, but traders are pricing in future loosening. The anticipation of returning barrels from Rosneft and Lukoil further weighs on near-term contracts.
Russian supply resilience—despite Western restrictions—has become a core factor suppressing prices. Data shows Russian seaborne exports averaging 3.4 million bpd, barely below pre-war levels.
China’s Weak Demand and Strategic Stockpiling
China’s October crude imports rose 8.2% year-on-year, but actual consumption is stagnating. Industrial diesel demand remains subdued amid real estate contraction and logistics slowdown, while EV adoption is cutting gasoline use. Analysts estimate China’s strategic petroleum reserves now exceed 1.3 billion barrels, indicating that much of its import strength is storage-driven rather than consumption-led.
The decoupling between imports and end-user demand suggests future inventory overhangs once storage capacity peaks, a scenario that could push prices even lower in 2026.
India’s Energy Shift: U.S. LPG Deals Redefine Trade Flow
India, previously reliant on discounted Russian crude, has diversified through a new deal with the United States to import 2.2 million tonnes of LPG annually—around 10% of total demand. The transaction, valued near $1 billion, underscores a shift toward cleaner fuels and away from politically risky Russian supply.
This diversification also aligns with U.S. trade diplomacy as President Trump threatens tariffs of up to 500% on countries continuing to buy Russian oil. The reallocation of Indian import demand weakens Asia’s appetite for Middle Eastern and Russian barrels, compounding the global oversupply in crude.
Read More
-
SCHD ETF: $28.41 Price, 3.67% Yield And The Real Story After Broadcom’s Exit
12.01.2026 · TradingNEWS ArchiveStocks
-
XRP ETFs XRPI At $11.95 And XRPR At $16.98 While $750M Flees Bitcoin And Ether Funds
12.01.2026 · TradingNEWS ArchiveCrypto
-
Natural Gas Price Forecast: NG=F Snaps Back from $3.17 Lows as UNG and BOIL Surge
12.01.2026 · TradingNEWS ArchiveCommodities
-
USD/JPY Price Forecast - USDJPY=X Stalls Just Under 158 While Markets Game a Break or Reversal Near 160
12.01.2026 · TradingNEWS ArchiveForex
Australia’s LNG Plateau and Structural Weakness in Gas Supply
Australia, the world’s third-largest LNG exporter, faces stagnation in domestic gas production, stuck at 13 million cubic meters per month since 2021. ConocoPhillips’ new discovery in the Otway Basin brought optimism but does not offset declining exploration. Investment flight—highlighted by Abu Dhabi National Oil Company abandoning a $19 billion Santos acquisition—reveals how environmental policy and regulation are freezing expansion.
This stagnation amplifies regional LNG competition, with Asia well-supplied, keeping gas-linked oil demand muted.
Technical Breakdown and Market Structure
WTI futures breached major support at $59.20, triggering algorithmic selling and cascading liquidations. Next support levels sit at $56.70 and $52.80, where long-term buyers might re-enter. Brent faces resistance near $65.80 and $67.50. RSI levels across both benchmarks remain near 34, confirming bearish momentum without signs of reversal.
Forward curves have flattened, with December 2025 contracts pricing at $60.40, indicating traders expect prolonged weakness. Implied volatility sits at 38%, its highest since March 2023.
Macro Factors: Dollar Strength and Demand Contraction
A surging U.S. dollar—now at a six-month high—has made oil more expensive for non-dollar economies. This currency effect suppresses global demand by raising import costs in Europe and Asia. Additionally, freight and refining margins are narrowing. U.S. gasoline inventories fell to 12-year lows, yet consumption remains under pressure due to higher vehicle efficiency and EV substitution.
Outlook for 2026 and Trading Position
Current fundamentals imply further softness through Q1 2026 unless geopolitical risks or OPEC+ intervention shift supply dynamics. The IEA forecasts demand growth of only 770,000 bpd in 2026 versus 3.1 mb/d of new supply, creating a structural ceiling on prices.
Investors eye WTI (CL=F) within the $52–$65 range, while Brent (BZ=F) may hover between $60–$74. U.S. energy equities like ExxonMobil (NYSE:XOM), Chevron (NYSE:CVX), and ConocoPhillips (NYSE:COP) could face short-term margin compression as realizations fall, though their integrated operations buffer cash flow.
Final Position: Hold with Bearish Bias on Crude Benchmarks
WTI and Brent remain trapped in a supply-heavy regime with macro headwinds and weak demand. Unless OPEC+ enforces aggressive cuts or China’s consumption accelerates, crude is likely to consolidate below $65 into early 2026. Institutional flows favor defensiveness in downstream and gas-linked equities rather than crude exposure.


