





Record ETF Week Cannot Lift XRP Off $1.38 — The CLARITY Vote on September 15 Is the Only Binary Left
Cumulative inflows crossed $1.66B with net assets at $1.44B, yet the complex still owns under 2% of a 59B token float | That's TradingNEWS
Key Points
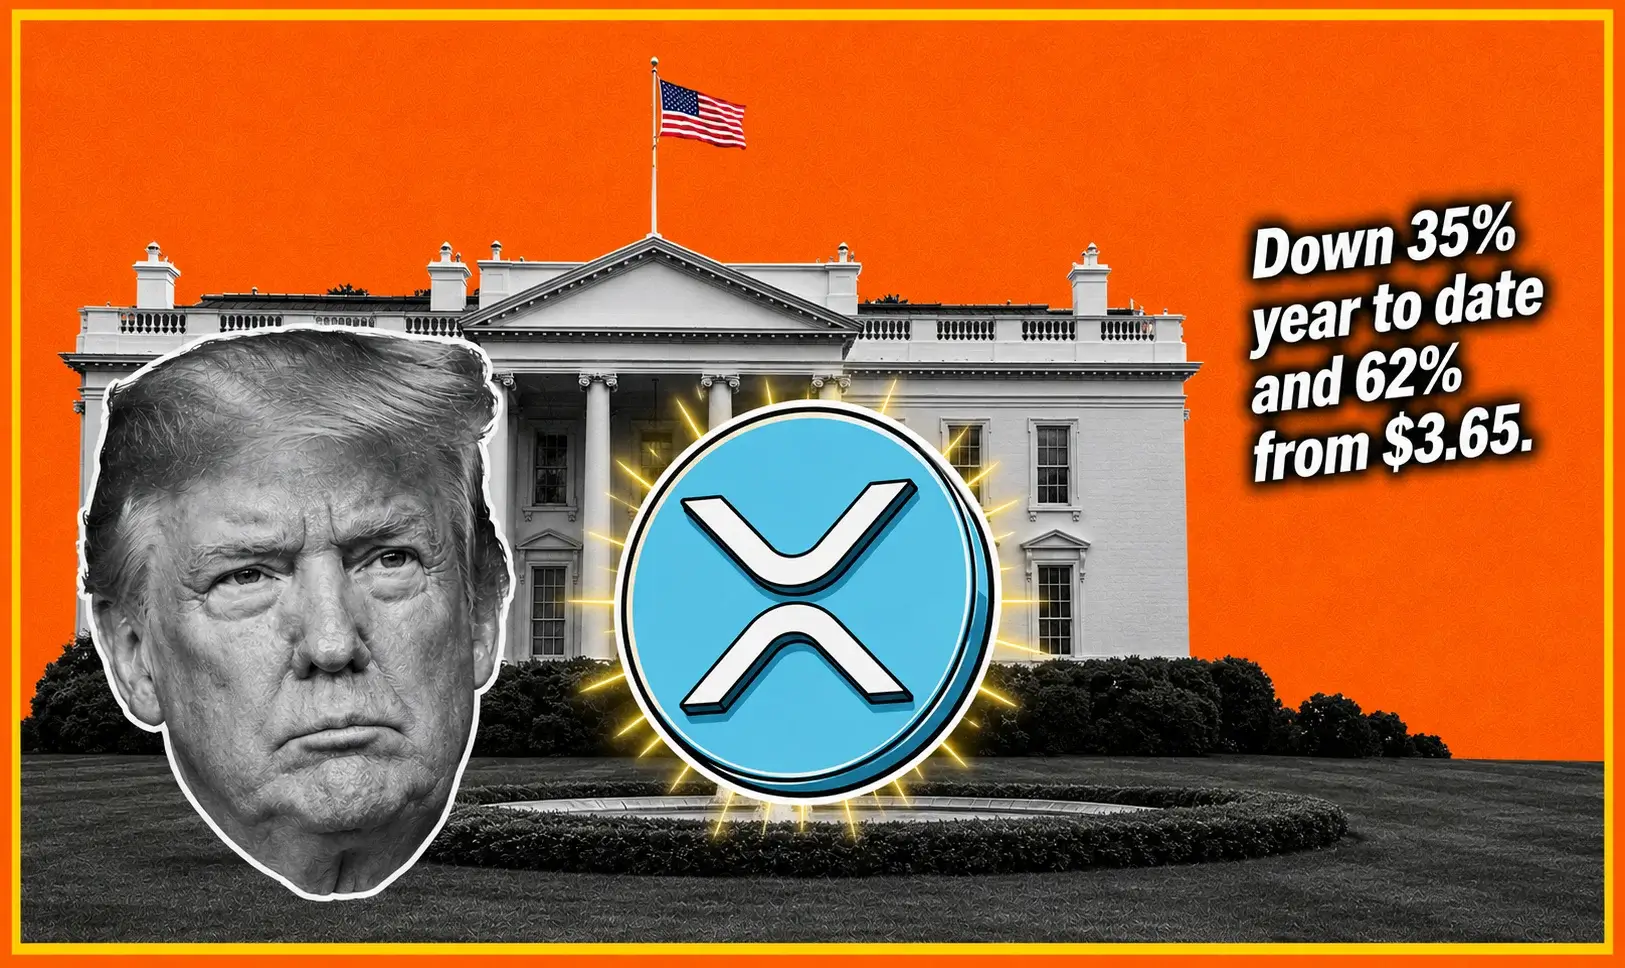
- XRP trades near $1.40 after peaking at $1.698, down 35% year to date and 62% from $3.65.
- Spot XRP ETFs took $110.49 million last week, the first week above $100 million since December 2025.
- Bitwise and Franklin's XRPZ hold 64% of the $1.66 billion cumulative inflow between them.
XRP trades around $1.40 into the final session of August, having completed one of the more violent round trips in the majors. The token closed at $1.38 on August 29, down 2.3% over twenty-four hours and 7.8% across the week. On Monday it slipped another 0.8% while Bitcoin held near $78,000 and Solana fell 0.6%.
The move that produced this level was enormous and it was fast. XRP set a cycle low at $0.9877 in mid-August with a failed rally attempt stalling at $1.0005. From there it ran 71.8% to $1.698 — a 56% gain in a single week, the sharpest weekly move since the post-SEC-settlement rally in August 2025. The August peak registered at $1.66 on a closing basis and $1.698 to $1.70 intraday.
Then it gave back roughly 20%.
The 2026 context is punishing. XRP spent most of the summer grinding between $0.90 and $1.10, settled below the dollar mark in mid-August, and has shed roughly 35% since January. Against the $3.65 high set in the summer of 2025, the token trades 62% lower. Circulating supply exceeds 59 billion tokens against a fixed maximum of 100 billion, putting market capitalization near $84 billion at current prices.
The technical picture improved on the bounce. XRP broke above a descending resistance line on the hourly chart, with analyst Ali Martinez declaring the breakout confirmed and identifying $1.70 as the next target. Support between $1.35 and $1.38 is the level that has to hold, and CoinMarketCap has flagged that losing $1.35 would deepen the correction.
The composition of the rally is what should concern holders. It ran on short liquidations, renewed ETF inflows, and broader crypto momentum led by Bitcoin's breakout above $77,000. Two of those three are spent.
The thesis for this forecast: XRP's ETF complex just posted its strongest week since December 2025 and the token fell 7.8% in the same five sessions. That divergence is not bullish accumulation — it is proof that $110 million of weekly institutional flow cannot move an $84 billion asset. XRP trades on Bitcoin beta, forced covering, and one legislative date in September.
ETFs Took $110.49 Million and the Token Fell 7.8%
The flow data was genuinely a record, and it did nothing.
U.S. spot XRP exchange-traded funds attracted $110.49 million in net inflows during the week ending August 28 — their strongest weekly performance of 2026 by a wide margin. That figure more than doubled the previous 2026 high of roughly $60.5 million set in mid-May, and it was the first weekly result above $100 million since December 2025. It remains below the all-time weekly record of $243.95 million set in late November 2025.
Every session of the week posted net inflows. The strongest was Wednesday, August 26, at $28.14 million — the largest single-day contribution since January 5, when the funds took in more than $46 million, and described as the best day in more than seven months. August 28 added another $26.20 million.
Cumulative net inflows now stand at approximately $1.66 billion with total net assets at $1.44 billion across all funds. Weekly trading volume climbed to $363.03 million, the busiest week since the products launched, with a daily volume record near $125 million.
Against that, the token traded near $1.38 on August 29, down 7.8% over seven days.
Most of 2026 told a quieter story. Negative weeks hit in late January, mid-March and briefly in July, followed by a near-dead stretch of inflows through early August immediately before this breakout. That pattern — long dormancy punctuated by a single strong week — is not the same thing as sustained institutional adoption.
The bullish framing on offer is that funds are accumulating into weakness rather than chasing strength. That reading is defensible. The mechanical reality is simpler: creations and redemptions of ETF shares do not equate to immediate spot market purchases, managers execute according to each product's mechanism, and $110 million spread across five sessions is roughly 0.13% of XRP's market capitalization.
Flow that small does not set price. It sets a floor under it, slowly.
The Divergence: XRP Bought While Bitcoin Was Sold
The August 28 session produced the cleanest cross-asset signal in the crypto ETF complex all month.
U.S. spot XRP ETFs posted a $26.20 million net inflow. U.S. spot Bitcoin ETFs posted $201.81 million in net outflows, ending a nine-day inflow streak that had accumulated roughly $3.04 billion. Ethereum funds took in $102.18 million, extending their own streak to a tenth consecutive session and $1.52 billion.
So on a single day, capital left Bitcoin products and entered both Ethereum and XRP products. That is rotation inside the institutional bucket rather than exit from the asset class.
For XRP specifically, the read is more nuanced than the headline. Its inflow of $26.20 million was one-quarter the size of Ethereum's and would need to run for eight consecutive sessions to offset Bitcoin's single-day outflow. XRP's steadier demand relative to Bitcoin's heavy selling is real, and it is real at a scale that barely registers.
The week's composition reinforces it. Bitcoin ETFs took roughly $924.5 million for the week and $3.3 billion for August. Ethereum took $824 million for the week and $1.52 billion across ten sessions. XRP took $110.49 million and called it a record.
The size gap is the structural problem. Combined U.S. spot Ethereum ETF assets sit at $12 billion to $13 billion. Bitcoin's complex holds roughly $97.6 billion. XRP's holds $1.44 billion — roughly 1.5% of Bitcoin's and 11% of Ethereum's.
Seven U.S. spot XRP ETFs now hold nearly a billion tokens between them. Against a circulating supply above 59 billion, that is under 2% of the float.
The corollary matters for the forecast. When Bitcoin ETF flows turn negative and the whole complex shrinks, XRP's relative outperformance in flow terms does not translate into price outperformance, because XRP's price is set by spot and derivatives markets that dwarf its ETF wrapper. Monday proved it: XRP fell 0.8% while Bitcoin held flat.
Three Issuers Control 93% of the Flow
The concentration inside the XRP ETF complex is extreme even by the standards of a young product category.
Bitwise's XRP fund commands the leading position with cumulative inflows exceeding $600 million. Franklin Templeton's XRPZ follows with $462.86 million. Together with Canary Capital, those three issuers account for approximately 93% of all inflows into the category.
Two funds therefore hold roughly $1.06 billion of the $1.66 billion cumulative total — about 64% between them.
That structure has the same fragility profile as BlackRock's dominance of the Ethereum complex, where ETHA supplied $1.02 billion of a $1.42 billion nine-day streak. A category this top-heavy is stable while flows are positive and breaks fast when the flagship reverses, because there is no diversified base of smaller issuers to absorb redemptions.
The mechanism that makes inflows matter is worth stating precisely. As capital enters these regulated vehicles, fund issuers execute open-market purchases of XRP. Persistent weekly inflows above the $100 million threshold systematically withdraw circulating tokens from exchange inventories, tightening available float.
One week above $100 million does not do that. Sustained months of it would.
The distinction between flows and purchases also deserves care. Flows measure the difference between creations and redemptions of shares. They do not necessarily equate to immediate XRP acquisitions on the spot market on any given day, since managers execute according to each product's specific mechanism. The lag between a recorded inflow and an actual bid can run days.
That timing gap is one honest explanation for why $110.49 million of inflows coincided with a 7.8% price decline. The other explanation is that the sellers were larger.
For the forecast, the operative question is whether the week ending August 28 was the start of a trend or a single burst. The 2026 record before this week was $60.5 million in mid-May, and that week was followed by a near-dead stretch. History says burst.
$1.66 Billion Cumulative Against an $84 Billion Market Cap
Scale is the argument that most XRP ETF coverage refuses to make.
Cumulative net inflows since launch total approximately $1.66 billion. Total net assets across all funds sit at $1.44 billion. XRP's market capitalization at $1.40 with more than 59 billion tokens circulating is roughly $84 billion.
The entire ETF complex owns under 2% of the token.
Compare that to Bitcoin, where spot ETF net assets represent 6.52% of total market value — a share large enough that flows demonstrably move spot price, as demonstrated when $1.92 billion in a single week took Bitcoin from $63,000 to $80,000. XRP's wrapper is not remotely at that threshold.
Nor is the fund complex growing fast enough to reach it soon. At $110.49 million per week sustained — which has happened exactly once in 2026 — the complex would add $5.7 billion annually, taking roughly two years to reach Bitcoin's proportional share, assuming XRP's price stays flat.
That is the honest framing of the institutional thesis. It is directionally correct, structurally sound, and years from mattering.
What ETF flow does provide is a floor mechanism and a signalling function. Regulated wrappers give allocators a compliant route into the asset, which broadens the buyer base permanently even if it does not move price today. Cumulative flows crossing $1.66 billion is a new all-time high for the category, and all-time highs in cumulative flow do not reverse easily because the assets sit in advisory accounts rather than trading books.
The counterweight is what Bitcoin's complex shows: cumulative flow can rise while the calendar year runs negative. Bitcoin ETFs have taken $54.6 billion cumulatively since January 2024 and are still net negative by about $2.8 billion in 2026. Cumulative totals accumulate. They do not indicate current demand.
XRP's cumulative $1.66 billion tells you the product works. It does not tell you anyone is buying today.
The September 1 Escrow Unlock Has Stopped Mattering
Tomorrow, Ripple unlocks 1 billion XRP from escrow. It has done this on the first of every month for years, and the market no longer reacts.
Ripple holds most of the XRP that is not circulating inside a set of escrow contracts, releasing it in scheduled installments designed to manage supply and minimise market disruption. Because XRP's total supply of 100 billion was issued at the ledger's inception, there is no ongoing issuance or mining reward — the escrow schedule is the only new supply mechanism that exists.
Several of this year's unlocks have passed with barely a reaction, because Ripple locks most of the released tokens straight back into escrow. The net supply addition is a fraction of the headline billion.
That is a genuine improvement in market structure over the 2018–2021 period, when monthly unlocks reliably pressured price. It is also the reason the escrow release is no longer a tradeable event, and any analysis that leads with it is analysing a market that no longer exists.
The scarcity narrative is worth handling honestly. XRP's fixed supply is frequently cited alongside price discussion as a structural support. It is a ceiling on inflation, not a source of demand. Sixty-two percent of the supply is already circulating, and the remainder arrives on a published schedule that every participant can model.
The more relevant supply-side development is the ETF withdrawal mechanism. Seven funds holding nearly a billion tokens have permanently removed roughly the equivalent of one monthly escrow release from exchange inventory. If weekly inflows above $100 million persist, tokens leave float faster than escrow adds them.
That crossover is the actual supply thesis, and it requires the August 28 week to become the norm rather than the exception.
For September 1 specifically: expect nothing. The unlock is priced, mechanical, and largely re-escrowed within days.
September 15: The CLARITY Act Cloture Vote
The single most important date on XRP's calendar is a Senate procedural vote, and it lands the day before the Fed decides.
Senate floor action on the CLARITY Act is confirmed for September 15, with a scheduled cloture vote carrying potential direct implications for XRP's regulatory classification. The legislation has sat one Senate vote away from unlocking institutional capital for months, and XRP has shed 35% since January while it waited.
The stakes are structural rather than sentimental. A market structure bill that definitively classifies XRP as a non-security removes the last compliance obstacle for banks, custodians and asset managers that have been running the token through legal review since the SEC case concluded. That is a different category of buyer than the retail and advisory flow currently reaching the ETFs.
The timing is also unfortunate. September 15 sits one day before the FOMC decision on September 16, where hike odds currently stand at 58% following Federal Reserve Chair Kevin Warsh's Jackson Hole remarks. A CLARITY passage into a hawkish Fed produces two opposing impulses in twenty-four hours, and the macro one has been winning all year.
The regulatory backdrop otherwise favours XRP more than at any point in its history. The SEC case ended. Ripple secured conditional approval for a national trust bank charter. The company raised capital at a $50 billion valuation and spent roughly $4 billion on acquisitions. Seven spot ETFs launched and trade.
There is also a symbolic alignment worth noting: this year's Jackson Hole symposium theme, set by the Kansas City Fed, was "Financial Innovation: Implications for Payments and Policy" — putting the year's central macro stage directly on XRP's home turf. The token did not benefit.
Separately, Evernorth, an XRP treasury company, has gained SEC clearance and is teeing up a shareholder vote on a Nasdaq listing, though its XRP holdings currently sit well below cost.
September 15 is the binary. Everything before it is noise.
XRP Won Everything and Fell Anyway
The most instructive fact about this asset in 2026 is that every catalyst holders were waiting for arrived, and the price declined regardless.
The SEC case ended. Seven U.S. spot ETFs launched and now hold nearly a billion XRP. Ripple secured conditional approval for a national trust bank. The company raised at a $50 billion valuation and deployed roughly $4 billion on acquisitions. Institutional adoption of RLUSD and Ripple Payments has progressed. Regulatory posture in Washington turned friendly.
XRP spent most of 2026 falling anyway. It is down 35% since January and 62% from the $3.65 high set in mid-2025.
That disconnect deserves a serious explanation rather than a dismissal. Two candidates hold up.
The first is that the catalysts were already priced. XRP rallied hard into the SEC settlement in August 2025 and into the ETF launches. Buying the rumour and selling the news is the oldest pattern in the market, and this asset ran it twice.
The second is that Ripple's commercial success does not accrue to the token. Institutional adoption of RLUSD — a dollar stablecoin — generates revenue for Ripple, not demand for XRP. Ripple Payments can settle in multiple assets. The escrow structure means Ripple's own token holdings are the largest single overhang. A $50 billion private valuation for the company and an $84 billion market cap for the token are measuring different things.
The optimistic version of the same observation is that institutional adoption of RLUSD and Ripple Payments creates organic demand that does not show up in ETF flow data, and that the gap between commercial progress and token price may be narrowing. That is a fair argument and it is unproven.
The forecasting record on this asset should temper everyone. Ripple's own deals reached the same bullish conclusion seven times out of ten and the price still fell.
Winning the argument and winning the trade are different things, and XRP has now done the first without the second for eighteen months.
The Level Map: $1.35, $1.60, $1.698, $2.00
The technical structure is unusually clean because the entire move happened in two weeks.
Immediate support is the $1.35 to $1.38 zone, which analyst work has identified as the level that determines whether the correction stops or deepens. XRP closed at $1.38 on August 29 and trades near $1.40 now — it is sitting directly on that shelf. A loss of $1.35 opens the door back toward $1.20 and then the $1.05 to $1.10 demand zone where buyers stepped in earlier in the month.
Beneath that, $1.0005 was the failed rally level in mid-August and $0.9877 marks the cycle low. Those are the structural floor.
Overhead, the map is stacked. First resistance is $1.60, followed by $1.68 and then $1.698 to $1.70 at the August intraday peak. Ali Martinez has identified $1.70 as the confirmed breakout target after XRP cleared its short-term descending resistance line.
Above $1.70, the zone that actually matters is $1.80 to $2.00 — where significant selling pressure emerged during the January 2026 bounce. That band is the most important number in any XRP forecast, and a sustained break above $2.00 would change the medium-term structure entirely.
Reaching $2 by September 30 requires 42.9% appreciation from present levels.
Momentum readings are mixed and improving from a very low base. Earlier in August the MACD line had fallen to -0.0253 and RSI to 36.06, both cycle lows, with price below the 20-day, 50-day, 100-day and 200-day EMAs. The 71.8% rally repaired the shorter averages but the longer ones remain overhead.
Volatility has been running near 14.5% over thirty days with 14 of 30 green days — a coin flip with large steps. The Fear and Greed Index sits in greed territory around 65.
Range call into September 15: $1.28 to $1.70, with the CLARITY vote as the break trigger in either direction.
Read More
-
Yen Stalls at 160 Despite a 3% JGB and Tokyo Core CPI at 2.0% — Intervention Sits at 164, Friday's Payrolls Decide
02.09.2026 · TradingNEWS ArchiveEnergy
-
QQQ ETF ($706.22) Slides 7.4% Below Its High as the Market Reprices the AI Capex Bill — $686.57 Target if $700 Breaks
22.10.2026 · TradingNEWS ArchiveStocks
-
XRPI ($7.00) and XRPR ($10.74) Slide Toward 52-Week Lows as Spot XRP ETF Flows Stall at $708,510
22.10.2026 · TradingNEWS ArchiveCrypto
-
NG ($2.775) Decoupled From Europe’s €88 Gas Crisis as LNG Feedgas Hits 18.9 Bcf/d — $3.30 Upside on Cold Weather
22.10.2026 · TradingNEWS ArchiveCommodities
-
Dollar-Yen (157.35) Loses 157.65 as the Yen Rallies on Haven Demand — 155 Target if 156 Breaks
22.10.2026 · TradingNEWS ArchiveForex
Bitcoin Beta and the $77,000 Correlation
XRP's price is currently a leveraged expression of Bitcoin, and the August data proves it precisely.
The 56% weekly surge was explicitly attributed to a combination of short liquidations, renewed ETF inflows, and broader crypto market momentum led by Bitcoin's breakout above $77,000. Remove the Bitcoin leg and the move does not happen.
That Bitcoin move had a specific, non-crypto cause. The U.S. Treasury announced it would double the maximum size of long-dated buyback operations, with the first at $4 billion or larger scheduled for September 9. Long-end yields compressed, risk appetite surged, and between August 19 and 22 short liquidations totaled $3.5 billion across major exchanges — with $1.29 billion closing inside a single hour on August 19. Across a 45-hour window, more than $3 billion in derivatives positions were forcibly closed, with shorts absorbing roughly $2.77 billion, about 92% of the total.
XRP sits in the same derivatives books. Its 71.8% run from $0.988 to $1.698 was the higher-beta version of the same cascade.
That fuel is spent. Roughly 110,000 short positions liquidated between August 19 and 22 cannot be liquidated twice. Bitcoin open interest has been contracting since — down 3.8% to 318,600 BTC on August 31 from 331,100 BTC on August 21 — while funding rates rise, the configuration that flips squeeze risk from shorts to longs.
Monday's cross-asset tape shows the beta relationship intact and inverted. Bitcoin traded near $78,000 essentially flat, absorbing a live U.S. strike on Iranian territory and a 3.5% Brent move without reacting. XRP fell 0.8%. Solana fell 0.6%.
Bitcoin dominance has climbed above 60% from 58.2% in April. Rising dominance during a rally means the marginal buyer is institutional and accessing the asset through regulated wrappers, not dispersing into altcoins.
XRP does not lead. It amplifies, in both directions, and the amplification is currently pointing down.
Warsh, 58%, and Why XRP Trades the Fed
The macro variable dominates everything on this chart, and it turned hostile on Friday.
Warsh told Jackson Hole that inflation data are more concerning than labor-market trends, that inflation is unlikely to return to target on its own, and that the Fed will have work to do if policymakers are not confident underlying inflation is heading to 2%. He cited PCE at 3.7% and described financial conditions as not restrictive.
September hike odds jumped to 59.7% from 35.4% on Thursday and 39.9% a week earlier. December odds moved to 80%. The two-year Treasury yield ripped 11.97 basis points to 4.352%, its highest since July 24. The dollar index rose 0.4% to 99.57, its strongest single-day gain in about two months.
Bitcoin fell 3.34% to $77,413.77 that session. Gold dropped 3.19%. Silver lost 4.3%. XRP fell with them.
The mechanism for a non-yielding, zero-cash-flow asset is arithmetic. Higher expected policy rates raise the opportunity cost of holding it, strengthen the dollar it is priced in, and remove the liquidity assumption that underpins the entire speculative complex. With the two-year at 4.36% and the thirty-year at 5.21%, the risk-free alternative has never been more competitive against a token with no yield.
The counter-argument is that 58% is a lean rather than a done deal. The Fed tends to validate market pricing once it crosses 60% to 70%, and certainty reads above 90%. Robin Brooks of the Brookings Institution has argued a September hike would be aimed at anchoring the ten-year and avoiding a repeat of the post-July 29 bond selloff — performative tightening whose principal aim is keeping financial conditions loose, which would leave the debasement trade working.
If that reading is right, a hike is survivable and possibly bullish for the whole complex. If the market treats it as genuine tightening, XRP retests $1.20.
Treasury's first doubled buyback operation lands September 9. That is the mechanism that started this rally.
Standard Chartered Cut From $8 to $2.80
The forecast dispersion on this asset is the widest of any major token, and the direction of revisions has been uniformly down.
Standard Chartered previously carried an $8 target and cut it to $2.80 under moderate conditions. Bitwise has published $4.94. The retail analyst community clusters between $4 and $20, which is a range wide enough to be meaningless. Algorithm-driven models such as CoinCodex sit far more conservatively at $1.70 to $2.00.
Most 2026 forecasts cluster between $2.50 and $5.00 with a midpoint near $3.50 to $4.00. From $1.40, the midpoint of that cluster implies a 150% advance in four months.
A more grounded framework puts the base case at $1.80 to $3.20 by 2030, with the immediate question being whether XRP can clear the $1.80 to $2.00 resistance zone where January's bounce failed. That framing at least matches the price action.
Note what happened to the bulls. Standard Chartered's cut from $8 to $2.80 is a 65% reduction from a house that was among the most credible institutional voices on the asset. The forecasting record on XRP should temper everyone, and the pattern of downward revisions across 2026 mirrors what happened in the nuclear and precious-metals complexes: targets falling, conviction unchanged, timelines extended.
The structural inputs behind the bull cases are real. Cross-border payments positioning, global expansion of Ripple's financial infrastructure, the concluded SEC case, seven live ETFs, a national trust bank charter under conditional approval, and $50 billion of private valuation.
The structural inputs behind the bear cases are equally real. Thirty-five percent decline year to date despite all of the above, 62% below the 2025 high, RLUSD adoption that generates Ripple revenue rather than XRP demand, and an ETF complex holding under 2% of float.
The honest median: $1.80 to $2.20 by year-end if CLARITY passes and the Fed holds. Below $1.30 if either fails.
The Week That Prices September
Four U.S. macro releases, one escrow unlock and one Treasury operation determine the next three weeks.
ISM Manufacturing PMI and July JOLTS land Tuesday, September 1 — the same day Ripple's monthly escrow releases 1 billion XRP. ADP private payrolls print Wednesday, September 2. Challenger layoffs, jobless claims and ISM Services arrive Thursday, September 3. The August employment report closes the week Friday, September 4.
The labor data has been deteriorating, and that is XRP's route higher. July nonfarm payrolls fell 23,000 against an +83,000 consensus, with May and June revised down a combined 103,000. Participation slid to 61.4%. Average hourly earnings grew 3.2% year over year, the slowest since May 2021. The Chicago Business Barometer collapsed 10.5 points to 47.1 in August with prices paid accelerating. Consumer sentiment fell to 51.7. Capital Economics forecasts +90,000 for August with unemployment unchanged at 4.2%.
A payrolls print below 40,000 pushes hike odds under 45% and takes XRP back toward $1.60. A print above 130,000 with firm wages tests $1.35.
Treasury's doubled long-dated buyback operation, at $4 billion or larger, executes September 9 — the direct descendant of the policy change that produced August's entire crypto rally.
Then the cluster. U.S. CPI prints September 11. The Senate CLARITY Act cloture vote is scheduled for September 15. The FOMC decides September 16. Three consequential events in six days, with the only XRP-specific one sandwiched between two macro releases that historically overwhelm it.
Watch the daily ETF prints throughout. A second consecutive week above $100 million would be the first evidence that the August 28 week was structural rather than a burst. Three consecutive outflow sessions would confirm the opposite.
XRP Price Forecast: $1.20 Downside, $1.70 Upside, Neutral Above $1.35
XRP at $1.40 sits directly on the support that determines whether August's 71.8% rally was a bottom or a bounce.
The bull case has four legs. Spot ETFs took $110.49 million in the week ending August 28, the first triple-digit week since December 2025 and more than double the prior 2026 high of $60.5 million, pushing cumulative inflows to a record $1.66 billion and net assets to $1.44 billion. That buying happened while price fell 7.8%, which is accumulation into weakness rather than momentum chasing. The Senate CLARITY Act cloture vote on September 15 is a genuine binary that could resolve XRP's classification and unlock a category of institutional buyer that has been sidelined for years. And the technical breakout above the descending resistance line is confirmed, with $1.60, $1.68 and $1.698 mapped overhead.
The bear case has four. The $1.66 billion ETF complex owns under 2% of a token with more than 59 billion circulating, against Bitcoin's wrapper at 6.52% of market value — flows this small cannot set price. Bitwise and Franklin alone hold 64% of cumulative inflows with three issuers at 93%, which is fragile concentration. The 71.8% run from $0.988 to $1.698 was substantially forced short covering from a $3.5 billion liquidation cascade that cannot repeat. And XRP has fallen 35% year to date and 62% from its 2025 high despite the SEC case ending, seven ETFs launching, a trust bank charter, a $50 billion raise and $4 billion of acquisitions.
The verdict is neutral above $1.35 and bearish below it. Base case into September 15: $1.28 to $1.70, midpoint near $1.45. Upside target on a daily close above $1.48 is $1.60, then $1.698; clearing $1.70 opens the $1.80 to $2.00 band where January's bounce died, and $2.00 requires a 42.9% move plus CLARITY passage. Downside target on a close below $1.35 is $1.20, then the $1.05 to $1.10 demand zone. A close under $0.9877 invalidates the entire August structure.
Trade September 15, not September 1. The escrow unlock stopped mattering years ago.



