





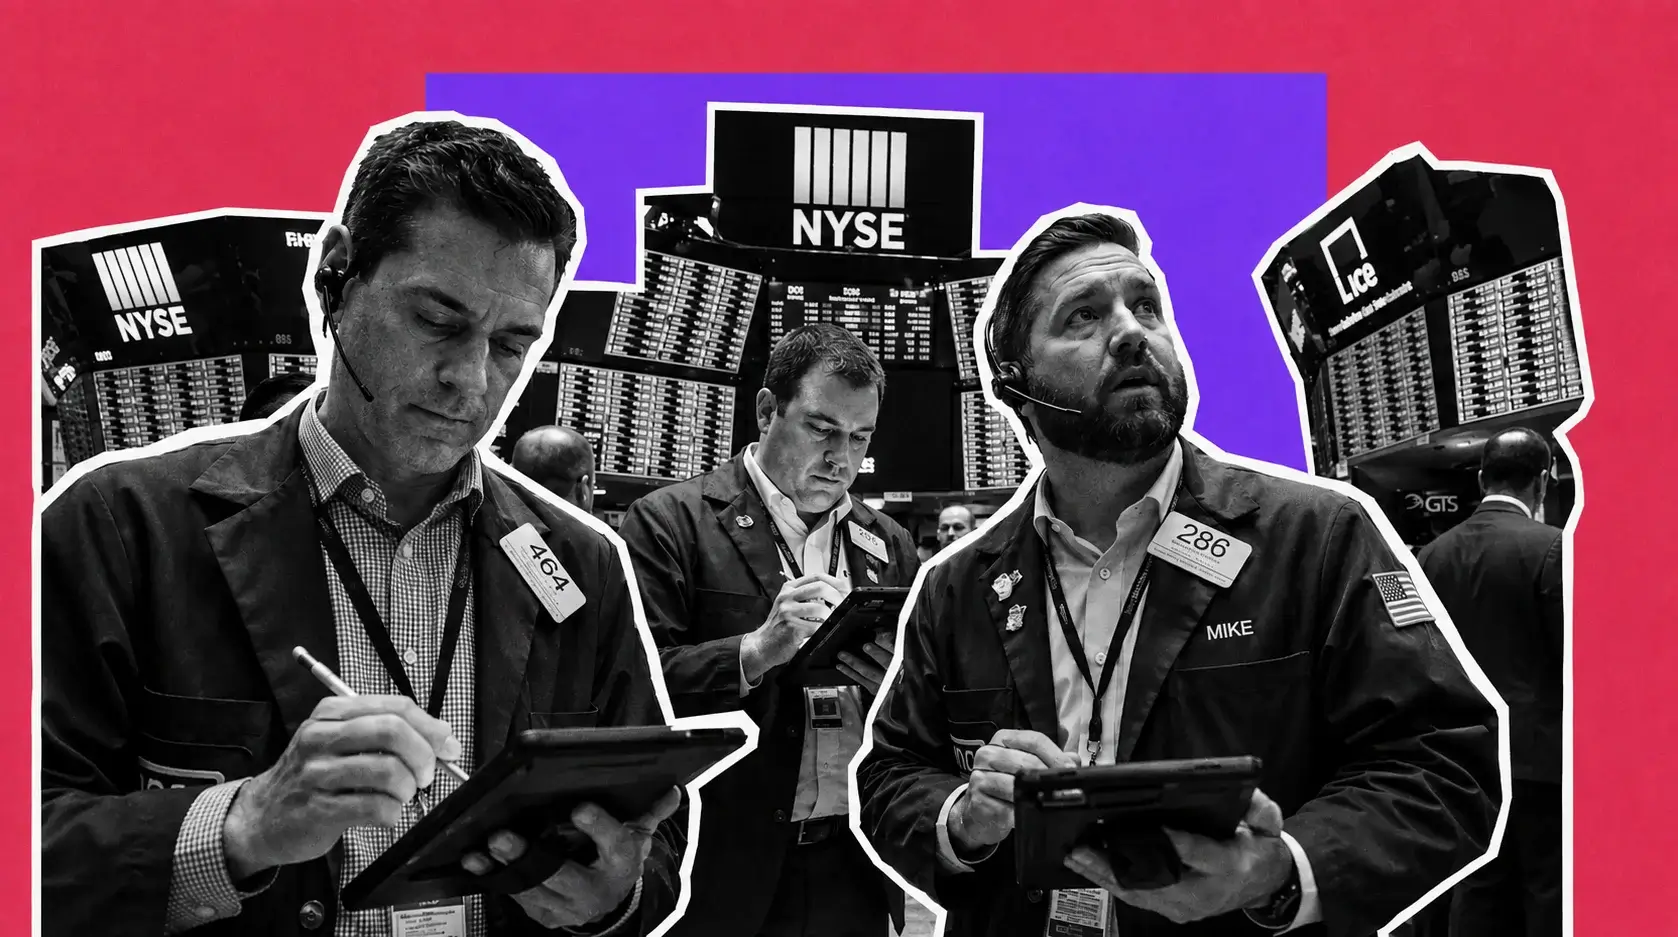
S&P 500 at 7,711, Nasdaq (IXIC) at 26,402, Dow at 53,559 — Energy Rips on $91 Brent While PG&E Craters
August closes with all 3 indexes green and every internal broken: the Russell 2000 is 2.64% off its August 11 level | That's TradingNEWS
Key Points
- S&P 500 closed at 7,711.76, sitting 1.12% below its 7,798.99 August 12 record close.
- September Fed hike odds jumped to 58% from 35.4%, lifting the 2-year yield to 4.34%.
- Brent ripped 3.5% to $91.20 after U.S. strikes on Iran's Larak Island; Chevron gained 2%.
The final trading day of August opens with Wall Street holding a monthly gain that almost nobody in the tape actually earned. The Dow Jones Industrial Average carries a 2.1% August advance into Monday, which would mark its fifth consecutive monthly gain. The S&P 500 sits roughly 3% higher for the month and the Nasdaq Composite roughly 4% — the first monthly gains for both since May. Those are the headline numbers that will print in every month-end wrap. They are also the least informative numbers on the screen.
Underneath, the month has been a narrowing exercise. The S&P 500 technology sector rose almost 6% in August while the Russell 2000 finished Friday at 2,972.37, down 1.39% on the day and back below the 3,052.85 it printed on August 11. Nvidia added more than 8% for the month, Microsoft 10%, Micron Technology 13%. Strip those three and the arithmetic that produced a 3% index gain gets very thin very fast.
Friday closed the argument. The S&P 500 lost 19.23 points to 7,711.76, a 0.25% decline. The Nasdaq Composite gave up 138.93 points to 26,402.42, down 0.52%. The Dow shed 9.45 points to 53,559.99, a 0.02% move that ranks quieter than roughly 98% of trading days since 1992. Inside that flat blue-chip print, Amazon ripped 3.97% and Nvidia got smoked for 4.57% — the best and worst Dow components separated by more than eight percentage points on a session where the index barely moved. That is not calm. That is offsetting violence.
Monday's premarket carries the same split personality. Dow futures traded 74 points lower, S&P 500 futures slipped 0.2%, Nasdaq 100 futures eased 0.1%. The SPDR S&P 500 ETF Trust marked down 0.17%, the Invesco QQQ Trust 0.12%, the SPDR Dow Jones Industrial Average ETF Trust 0.16%. The iShares Russell 2000 ETF edged up 0.02%. The iPath Series B S&P 500 VIX Short-Term Futures ETN rose 0.76%.
The thesis for this session, and for the month it closes: August's gain was manufactured by a shrinking group of AI-adjacent mega-caps while the bond market repriced the Federal Reserve from hold to hike, manufacturing activity collapsed into contraction, and a dormant Hormuz war premium got relit over the weekend. The index level flatters a tape that has been deteriorating for three weeks.
The Distance From the Highs Nobody Is Quoting
Every index is below its August peak, and the gaps are wider than a 3% monthly gain implies.
The S&P 500's record close is 7,798.99, set on August 12, with an intraday all-time high of 7,814.88 that same session and a 52-week ceiling of 7,816.70. At Friday's 7,711.76, the benchmark is 87.23 points and 1.12% below that closing record. The index has closed at an all-time high 27 times in 2026 and returned 13.43% year to date through August 28 with dividends reinvested, against a 52-week floor of 6,316.91 printed during the worst of the Iran conflict.
The Dow's record close is 54,349.12, registered on August 5, one session after the index closed above 54,000 for the first time. Friday's 53,559.99 leaves it 789.13 points and 1.45% under that mark, and 440.01 points — 0.82% — below the round 54,000 handle it has now failed to reclaim for nearly four weeks. The Dow's Friday range ran 53,489.41 to 53,819.65, a 330-point band that never seriously threatened either boundary.
The Nasdaq Composite's August peak close was 26,803.03 on August 12. Friday's 26,402.42 is 400.61 points and 1.50% below it. The Composite's recovery arc this month was genuinely violent — it surged nearly 9% from its July 29 low into early August — and it has now given back a meaningful slice of that in the ten sessions since Nvidia's print.
The Russell 2000 is the outlier that matters. At 2,972.37 it sits 80.48 points and 2.64% below its August 11 close of 3,052.85, and it lost 1.39% on Friday against the S&P 500's 0.25% and the Dow's 0.02%. Small caps carry the highest sensitivity to the front end of the curve, and the front end is exactly where Friday's damage concentrated.
The Cboe Volatility Index closed Friday at 14.43, down 0.08 points, having touched 14.2 earlier in August — its lowest reading of 2026. A VIX in the low 14s alongside three indexes 1% to 2.6% off their highs describes a market where index-level volatility is being suppressed by low pairwise correlation rather than by actual stability. As of mid-August the average 60-day pairwise correlation among S&P 500 constituents sat in the bottom 1% of observations since 2005. Single names are thrashing. The index absorbs it. That works until the correlation snaps back.
Warsh Turned September From a Hold Into a Coin Flip on a Hike
The single largest repricing of the month happened in about ninety minutes on Friday morning.
Federal Reserve Chair Kevin Warsh delivered his first Jackson Hole keynote and told the room that summer's softer inflation prints had not convinced him underlying trends had improved, that policymakers must be confident inflation is returning to the 2% objective clearly and at sufficient speed, and that otherwise the central bank has work to do. He cited the Fed's preferred gauge running at 3.7%. He described financial conditions as not appearing restrictive. He declined to label any of it forward guidance.
The rates market labeled it for him. Odds of a quarter-point increase at the September 15–16 meeting jumped to 59.7% by late Friday morning from 35.4% on Thursday and 39.9% a week earlier, per CME Group's FedWatch tool. Monday's pricing sits near 58%. The Fed has held the target range at 3.50%–3.75% for five consecutive meetings; the market now assigns better-than-even odds that the next move is up, not down.
The reaction function tells you what traders actually believe. The two-year Treasury yield ripped 11.97 basis points in a single session to 4.352%, its highest since July 24. The 30-year held flat at 5.19%. The 10-year rose less than four basis points to 4.71%, finishing the week at 4.73%. That is a textbook bear flattener: the market is pricing near-term tightening and simultaneously betting the tightening works. If Warsh hikes and long-end inflation compensation stays anchored, equities can absorb it. That asymmetry is why the S&P 500 gave up only 0.25% on a day the front end blew out twelve basis points.
The full curve as of Friday's close: 3-month bills at 3.83%, one-year at 4.13%, two-year at 4.36%, five-year at 4.49%, ten-year at 4.72%, thirty-year at 5.21%. The 10s2s spread stands at +44 basis points and 10s3m at +88 basis points. Upward sloping, steepening at the long end, and now flattening at the front — a curve shape that reflects both Treasury supply pressure and a policy path nobody has priced with conviction.
Monday brought partial relief. The two-year eased two basis points to 4.32% in Asian trading and the dollar backed off after posting its strongest one-day gain in about two months. The relief is two basis points against twelve. That is not a reversal.
Larak Island Relit the War Premium: Brent $91.20, WTI $86.30
The weekend delivered the geopolitical escalation the oil market had spent three weeks pricing out.
U.S. forces struck two rocket launchers on Iran's Larak Island in the Strait of Hormuz on Sunday, the first publicly confirmed American strike on Iranian territory since late July. Central Command said the launchers were preparing to lay mines in the strait. Iranian state media reported Monday that the Revolutionary Guards responded by firing ballistic missiles at two U.S. air bases in Jordan. President Trump added a social media post claiming Iran's Kharg Island energy hub was being destroyed, accompanied by an AI-generated video clip.
Crude gapped. Brent climbed 3.5% to $91.20 a barrel by 05:06 ET, with West Texas Intermediate up 3.5% to $86.30. Earlier Asian-hours reads had Brent at $90.25 and $90.61, up 2.5% and 2.9%. Friday's settlements were $89.31 for Brent, down 39 cents, and $83.40 for WTI, down 13 cents — the first weekly decline in three for both contracts, as traders had begun treating the standoff as a sanctions confrontation rather than a physical supply threat.
That framing lasted one weekend. Before Sunday, Persian Gulf crude exports had recovered to 15–16 million barrels per day, still 7–8 million below pre-conflict volumes of 22–24 million but far above the March trough near 5–6 million. Roughly 6 to 8 million barrels were transiting Hormuz daily without a peace agreement. Iran and Oman had agreed a revenue-sharing framework for the strait without Tehran committing to reopening. Every one of those improving datapoints now carries a fresh discount.
Treasury Secretary Scott Bessent added a second layer, telling reporters the administration plans to roll out new secondary sanctions on Iran weekly, beginning with banks tied to the regime. Separately, Trump announced an agreement he described as giving the United States majority control over more than 65 billion barrels of proven Venezuelan reserves — a supply-side offset with a multi-year timeline against a supply disruption with a same-day timeline.
For equities, the transmission is direct and two-sided. Higher crude lifts energy earnings and drags on the consumer, and it feeds gasoline expectations straight into the inflation prints a hawkish Fed is already citing. Michigan's August survey explicitly flagged the Iran conflict as fueling expectations of further gasoline price increases. Warsh gets more cover, not less.
Energy Is the Only Sector With a Real Bid Premarket
The oil move flowed straight into the equity complex, and it is the only clean sector trade on the board Monday morning.
The United States Oil Fund jumped 3.72% in premarket hours. The Energy Select Sector SPDR ETF rose 1.31%. Underneath, the majors led: Chevron gained 1.7% to 2%, Exxon Mobil 1.5% to 1.6%. Among producers, Occidental Petroleum advanced 1.8% to 2% and ConocoPhillips added 1.3%. Oilfield services outperformed the integrateds, with Halliburton up 2.4% to 2.5% and SLB up 1.7% — the standard pattern when the market prices a longer disruption rather than a one-day headline, since services revenue tracks sustained activity budgets rather than spot barrels.
Refiners participated but lagged, which is the tell. Valero Energy rose 2%, Phillips 66 approximately 1%, Marathon Petroleum 0.6%. Refining margins compress when crude input costs spike faster than product prices, and the muted refiner bid says the market is treating this as a crude event rather than a crack-spread event so far. That gap is worth watching if Hormuz transit volumes actually fall rather than simply getting threatened.
The sector arrives at this session already extended. Energy has gained roughly 40% year to date, the best-performing sector in the S&P 500 in 2026, driven by exactly this conflict. Exxon Mobil traded 6.3% above its 20-day simple moving average, 12.9% above its 50-day and 17.9% above its 200-day at one point earlier in August, with RSI at 72.81 — overbought by any standard reading. The 50-day above the 200-day golden cross formed in August 2025 and remains intact.
The earnings backdrop justifies part of the move. Valero's quarterly earnings ran more than 400% above the year-ago period in a market the company estimates is still five million barrels per day short of global refining capacity and more than 100 million barrels short on inventories. Chevron's refining segment profits jumped 500% on higher gasoline and diesel prices.
The problem for index bulls is arithmetic. Energy carries a small enough S&P 500 weight that a 1.31% sector move contributes a rounding error to the benchmark, while the technology and communication-services complex that actually drives the index is flat to lower. A tape led by energy is a tape where the index is being carried by the wrong 4%.
PG&E Down 16% Is the Biggest Single Move on the Board
The largest percentage dislocation in Monday's premarket has nothing to do with Iran, the Fed, or artificial intelligence.
PG&E collapsed as much as 16%, with early prints showing a 10% decline that deepened through the morning, after California lawmakers let a wildfire liability measure die without action. The proposal, backed by Governor Gavin Newsom, would have capped the amount individuals could recover from utilities whose equipment ignites wildfires and shifted a portion of liability costs from investor-owned utilities onto insurers. Negotiations collapsed during the prior week, and the legislative session's Monday deadline passed with the measure unaddressed.
The objection that killed it was fiscal: lawmakers concluded the existing framework could drain California's wildfire liability fund entirely in the event of a single catastrophic utility-sparked fire. That concern cuts both ways. A fund that can be exhausted by one event is a fund that offers utility shareholders far less protection than the current share prices assumed.
Contagion was immediate and proportional to exposure. Edison International fell 4%. Sempra declined roughly 1%. The spread across those three names maps almost exactly to service-territory fire risk, which is the market doing its job — this is being priced as a California regulatory event, not a sector-wide utility repricing.
The timing compounds the damage. Utilities have already been the losing side of the rate trade all month. With the two-year at 4.34% and the thirty-year at 5.21%, bond-proxy equities carry a dividend yield that no longer competes, and a hawkish Fed repricing makes that worse. Adding an unresolved tail liability to a sector already fighting the discount rate is how you get a 16% single-name move on a day the S&P 500 futures are down 0.2%.
For index math, PG&E is small. For the sector rotation story, it is a marker: the two defensive-adjacent complexes that traditionally absorb capital during geopolitical stress — utilities and precious metals — are both broken right now. Gold sold off 3.19% on Friday. Utilities are being repriced on liability risk and yields simultaneously. When the classic hedges are unavailable, capital either concentrates further into the mega-cap AI names that already dominate the index or it goes to cash. Neither outcome improves breadth.
Nvidia Beat and Semis Still Got Smoked
The single most instructive divergence of the past week: Nvidia delivered arguably its strongest quarter ever and the semiconductor complex still finished the week red.
Nvidia reported fiscal second-quarter revenue of $96.2 billion, up 106% year over year, against a $92.3 billion consensus. Adjusted earnings came in at $2.22 per share, up 111.4% from $1.05, versus $2.09 expected. Data center led, edge computing generated $7.2 billion up 27%, and gaming grew 46% to $7.92 billion. The company guided fiscal 2028 revenue growth toward 70%, against the 44% analysts had modeled. Market capitalization sits above $5 trillion.
The stock fell 1.2% in the after-hours session to $207.06. It then jumped 8.7% on Thursday to close at 26,541.35 on the Composite's best day since August 4. Then Friday it gave back 4.45% and closed the week around $217.55. Nvidia finished the week up just over 1%.
The VanEck Semiconductor ETF fell more than 3% on the week despite that. The iShares Semiconductor ETF dropped more than 3% on Friday alone. The drag came from the second tier: Marvell Technology fell 10.3% Friday to $216.62, and Applied Materials lost more than 5% across the week.
Marvell's print explains the mechanism. Revenue reached $2.74 billion, up 37% and $39 million above company guidance, with earnings of 94 cents against a 93-cent consensus. The company raised its fiscal 2028 outlook to roughly $18 billion, about 50% growth, from a prior $16.5 billion. It still lost a tenth of its market value in a session, because it offered limited detail on that outlook and because expectations had already absorbed a Google partnership worth up to $12.2 billion in shares. Marvell entered the print up 184% on the year. Beating is not enough at that multiple.
Synopsys and Cadence Design Systems ran counter, rising more than 11% and 6% on the week. Micron closed near $932.86 after a 13% August advance.
Monday's premarket shows a modest chip stabilization. Intel climbed 1.3% and ranked as the most actively traded name before the bell. Nvidia advanced 0.6%. Nvidia also agreed to acquire Hugging Face, the open-source model repository, for $12.9 billion. A 0.6% bounce after a 4.45% drop does not repair a broken sector.
Read More
-
Yen Stalls at 160 Despite a 3% JGB and Tokyo Core CPI at 2.0% — Intervention Sits at 164, Friday's Payrolls Decide
02.09.2026 · TradingNEWS ArchiveEnergy
-
QQQ ETF ($706.22) Slides 7.4% Below Its High as the Market Reprices the AI Capex Bill — $686.57 Target if $700 Breaks
22.10.2026 · TradingNEWS ArchiveStocks
-
XRPI ($7.00) and XRPR ($10.74) Slide Toward 52-Week Lows as Spot XRP ETF Flows Stall at $708,510
22.10.2026 · TradingNEWS ArchiveCrypto
-
NG ($2.775) Decoupled From Europe’s €88 Gas Crisis as LNG Feedgas Hits 18.9 Bcf/d — $3.30 Upside on Cold Weather
22.10.2026 · TradingNEWS ArchiveCommodities
-
Dollar-Yen (157.35) Loses 157.65 as the Yen Rallies on Haven Demand — 155 Target if 156 Breaks
22.10.2026 · TradingNEWS ArchiveForex
Software Was August's Real Winner and It Is Handing Back the Gain
The iShares Expanded Tech-Software Sector ETF gained 16% across August. That number, not the 6% technology sector move or the 4% Nasdaq advance, is the actual leadership story of the month — and it is unwinding in Monday's premarket.
ServiceNow retreated 2% before the bell. Oracle, Salesforce and Palantir each lost roughly 1%. Those are modest moves in isolation. They land on a complex that has run 16% in twenty-one sessions into a Fed repricing that raises the discount rate applied to exactly the kind of long-duration cash flows software multiples capitalize.
Salesforce is the name to watch this week for a specific reason. The stock rose 3.06% on Friday, one of the Dow's three best performers alongside Amazon at 3.97% and Nike at 3.02%. It has also wallowed for more than a year, trending lower and hitting long-term lows in 2026 on sluggish growth and unresolved questions about whether AI expands or cannibalizes seat-based enterprise software revenue. The company reports Wednesday, September 2. A 16% sector month resting partly on a name that has spent a year making lower lows is a fragile structure.
The software wobble also connects to a pattern that has repeated all month: strong results, negative reactions. Intuit's earnings dragged the whole complex lower one week ago, with ServiceNow off more than 2.5% and Workday and Salesforce down 2% on the sympathy move. Zoom Communications fell 7% on third-quarter guidance of $1.46 to $1.48 against a $1.50 consensus — a two-cent miss producing a 7% drawdown.
Two-cent misses producing 7% moves and 50% growth guidance producing 10% drawdowns describe the same condition. Positioning is crowded, expectations are maximal, and the marginal buyer has already bought. This is what the widest-ever spread between index volatility and single-stock volatility looks like in practice: the Cboe S&P 500 Constituent Volatility Index closed at 49.98 on July 9 against a VIX of 15.84, a 34.14-point gap in the 98th percentile since 2014. That spread has since compressed to 22.12 as semiconductor implied volatility fell nearly 20 points through August 10, but the underlying condition persists.
Chicago PMI at 47.1 Against a Fed That Wants to Tighten
Friday produced two economic releases within the same hour that describe an economy contracting while inflation refuses to follow it down.
The Chicago Business Barometer printed 47.1 for August, collapsing 10.5 points from July's 57.6 against a consensus that called for a rise to somewhere between 57.9 and 58.3. That is the largest month-over-month drop since the COVID period, the first contraction reading in four months, and the weakest print of 2026. Prices paid accelerated while the overall barometer fell below 50.
The University of Michigan's final August consumer sentiment reading came in at 51.7, revised up from a preliminary 51.0 but down 6.3% — 3.5 points — from July's 55.2 and roughly 11% below the year-ago level. Current conditions landed at 51.9, expectations at 51.5, against 54.8 and 55.4 the prior month. One-year business expectations fell 10% and the five-year outlook dropped 13%. Sentiment declined across every political group, sharpest among Republicans, and deteriorated most among older consumers, lower- and middle-income households, and those with no stock holdings.
The inflation expectations components are where the Fed is looking. Year-ahead expectations eased to 4.0% from 4.2%. Five-to-ten-year expectations held at 3.3% for a third consecutive month. That 3.3% long-run reading sits above the entire 2.8%–3.2% range of 2024. Three months running outside that band, on the survey the Fed cites most often when discussing anchoring, is the datapoint that lets Warsh argue for tightening into a contracting manufacturing print.
Headline CPI ran 3.4% year over year in July. PCE stands at 3.7%. Federal funds sit at 3.50%–3.75%. Real policy rates on the Fed's preferred gauge are barely positive, which is precisely the "financial conditions are not restrictive" argument Warsh made.
The 30-year fixed mortgage stands at 6.66% per the latest weekly Freddie Mac survey, slightly higher on the week. That is the transmission channel most households actually feel, and it is moving the wrong direction while sentiment sits eleven percent below where it was a year ago.
Contracting factory activity, accelerating prices paid, collapsing consumer expectations, unanchored long-run inflation expectations, and a central bank pricing a hike. The stagflation framing is not rhetorical here — it is what the data prints.
The Labor Market Is the Only Thing That Can Stop the Hike
Everything in the September policy debate now routes through Friday's employment report, and the July numbers set a low bar that also cuts against the hawks.
July nonfarm payrolls fell by 23,000 against a consensus of +83,000, the first outright decline in months. Government employment dropped 53,000 while private payrolls rose 30,000. May and June were revised down by a combined 103,000. The unemployment rate ticked lower to 4.1% from 4.2%, but only because the labor force shrank by 264,000 while household employment fell 87,000. Labor force participation slid to 61.4%, and outside the COVID era that is the lowest since the mid-1970s. Average hourly earnings grew 3.2% year over year, the slowest since May 2021.
The preliminary benchmark revision landed at -79,000 for the twelve months through March 2026, a 0.1% downward adjustment, with retail trade absorbing the largest cut at 154,600 jobs. That is a far smaller revision than the prior year's -911,000, which removes one argument the doves had been leaning on.
Consensus for August looks for a rebound. Capital Economics forecasts +90,000 with the unemployment rate unchanged at 4.2%, citing immigration curbs constraining labor supply rather than demand strength. The question the print has to answer is whether July's weakness was seasonal noise — local government education timing, a post-World Cup pullback in leisure and hospitality hiring — or the beginning of structural cooling.
The sequencing before Friday matters as much as Friday itself. ISM Manufacturing PMI and July JOLTS job openings land Tuesday, September 1, alongside the Atlanta Fed's Q3 GDP estimate and eurozone flash CPI. ADP private payrolls and July factory orders print Wednesday, September 2, the same session the Bank of Canada and Reserve Bank of New Zealand decide policy. Challenger layoffs, weekly jobless claims, the July trade balance and ISM Services arrive Thursday, September 3, with Fed Governor Waller speaking. Payrolls close the week Friday, September 4.
CPI does not print until September 11. The FOMC decides September 16. That leaves this week as a pure labor and manufacturing read, with four sequential prints that will either confirm or correct the 58% hike probability before the inflation data gets a vote.
Gold at $4,415 and Bitcoin Near $78,500: The Debasement Trade Cracked
One speech broke three of August's most crowded positions simultaneously, and the damage is still visible Monday morning.
Spot gold fell 3.19% on Friday to $4,454.52 an ounce, with intraday reads as low as $4,457 and one measure showing a 2.99% decline to $4,457. It has continued lower into Monday, trading near $4,415 to $4,430. Silver dropped 4.3% to $66.28. The SPDR Gold Shares ETF fell 1.8% and the VanEck Gold Miners ETF lost 2.7% during Friday's session. Gold had rallied hard through August alongside a dollar sell-off triggered by Treasury's efforts to suppress long-dated yields.
Bitcoin lost 3.34% Friday to $77,413.77 after clearing $80,000 earlier in the week for the first time since May on a short squeeze. It recovered to roughly $78,500 by Monday morning from about $77,500 at Friday's close. The iShares Bitcoin Trust ETF fell 2.5% Friday. Bitcoin ran from roughly $64,000 to $80,000 across August after Bessent doubled long-dated buyback operations to at least $4 billion apiece starting September 9 — and it is still the weakest major asset of 2026, down 11.55% year to date. Strategy shares gained more than 2% premarket Monday after falling 7% Friday.
The dollar index rose 0.4% to 99.57 on Friday, its strongest single-day gain in about two months, and every major crossed lower against it: the euro down 0.57% to $1.15830, sterling down 0.43% to $1.35307, the Australian dollar down 0.40% to $0.71611, the New Zealand dollar down 0.63% to $0.59073. USD/JPY rose 0.42% to 159.972, USD/CHF 0.27% to 0.80587, USD/CAD 0.35% to 1.39004. Unidirectional dollar strength, not idiosyncratic weakness elsewhere.
The mechanism is textbook. Higher expected policy rates raise the opportunity cost of holding non-yielding assets, strengthen the dollar, and remove the liquidity assumptions underpinning crypto. Gold, silver and Bitcoin sold together because they were all expressions of the same trade.
The dollar eased in Asian trading Monday and the two-year backed off two basis points, which gave gold and Bitcoin a shallow bounce. Whether Friday marks a genuine interruption to the debasement trade or a violent reset inside an intact trend depends entirely on whether Warsh follows the rhetoric with an actual September move.
Global Tape: Asia Sold, Europe Followed, Correlation Is Rising
The overnight session confirms this is a global repricing rather than a U.S. equity story.
MSCI's Asia Pacific equities gauge fell 0.7% before paring to a 0.3% decline, having been down as much as 1.1% at the worst. South Korea's Kospi dropped 1.2% with Samsung Electronics and SK Hynix doing the damage — the same semiconductor complex that dragged the SMH more than 3% lower on Friday, transmitting directly into an index where those two names carry outsized weight. The MSCI All Country World Index slipped 0.1%, heading for a second consecutive decline.
European futures pointed lower before the open, tracking further Nasdaq 100 weakness after last week's chip selloff. Friday's European closes had been firm: the DAX rose 0.77% to 26,569.99, the CAC 40 gained 0.98% to 8,401.18, the Euro Stoxx 50 added 0.95% to 6,485.67, the FTSE 100 climbed 0.29% to 10,824.26. That strength is not carrying into Monday.
The Korean move deserves attention beyond its index weight. Sharp single-day swings and extraordinary volatility in South Korean equities earlier in August highlighted how concentrated global markets have become in a single theme. When one country's benchmark is effectively a leveraged bet on two memory manufacturers, and those manufacturers are levered to AI capital expenditure, the correlation between "Nvidia guidance" and "Asian equity risk" approaches one.
The bond market showed the same global character. Treasuries recovered some of last week's losses in Asian hours with the two-year down two basis points, and the dollar eased after Friday's surge. That is position unwind ahead of a heavy data week, not a directional view.
Fixed income flows visible in the U.S. premarket point the same way. The iShares 7-10 Year Treasury Bond ETF rose 0.08% before the bell as yields cooled marginally. A modest bid for duration alongside a 0.76% pop in VIX futures exposure and flat-to-lower equity futures describes a market taking risk off the table ahead of the calendar rather than expressing conviction about direction.
Month-end rebalancing adds a mechanical layer to Monday's flows. After a month where equities gained 2% to 4% and long-duration Treasuries sold off, pension and target-date rebalancing skews toward selling stocks and buying bonds into the close — a flow that argues against a strong finish regardless of the news.
This Week's Earnings: Broadcom Is the Only One That Matters
The calendar delivers a second AI verdict four sessions after the first, and it arrives into a semiconductor tape that just rejected a 106% revenue growth print.
Medtronic reports before the open Tuesday, September 1. Palo Alto Networks and Zscaler report after Tuesday's close, putting cybersecurity spending on the table for the first time this cycle. Wednesday, September 2 carries the heaviest load: Broadcom, Salesforce and Snowflake all report. Dell Technologies and lululemon athletica follow Thursday, September 3.
Broadcom is the load-bearing print. It closed Friday down 0.7% near $368.79 after adding 4.5% during Thursday's Nvidia-driven semiconductor rally. Its custom silicon business is the most direct read available on whether hyperscaler AI capital expenditure is broadening beyond Nvidia's merchant GPU franchise or concentrating further into it. Given that Marvell — the other major custom-silicon name — lost 10.3% on a beat-and-raise, Broadcom faces a market that has demonstrated it will punish anything short of perfection in that specific segment.
Snowflake and Salesforce test the software complex that ran 16% in August. Dell tests AI server demand and margin structure, a category where Fabrinet dropped more than 9% earlier this month on a beat, purely because of guided fiscal Q1 expense seasonality. lululemon tests a consumer whose sentiment index just printed 51.7 with year-ahead inflation expectations at 4.0%.
The recent pattern in retail earnings is informative. Abercrombie & Fitch soared 36% on a beat and raised outlook, saying it discounted less than planned in a promotional environment. Dick's Sporting Goods fell further into the red after warning headwinds worsen through the year. Kohl's declined 5% on comparable sales down 0.9% against a 0.6% expected drop, despite raising guidance and restarting up to $100 million in buybacks. The consumer is bifurcating hard, and the market is pricing each name on its individual position rather than a sector view.
Roughly 89% of S&P 500 companies had reported as of August 10. This week's names are the tail of the season, which means each one carries disproportionate signaling weight into a data-heavy stretch with no earnings cushion behind it.
What The Session Has To Do By The Close
The levels that decide whether this month-end print means anything are specific and close by.
For the S&P 500, 7,711.76 is the reference. The index needs 7,798.99 to reclaim a record close and 7,814.88 to take out the intraday high — 1.13% and 1.34% away respectively. On the downside, 7,700.91 marked a recent intraday floor and the 7,674.37 level from August 21 is the first structural support beneath it. A close under 7,674 turns a 3% month into a 2.5% month and puts the index below where it traded ten sessions ago.
For the Nasdaq Composite, 26,402.42 sits between the August 12 peak close of 26,803.03 above and the August 21 close of 26,180.46 below. That is a 622-point band. The Composite spent the entire back half of August inside it. Resolution in either direction is the cleanest signal this tape will give.
For the Dow, 54,000 is 440.01 points and 0.82% overhead, and the record close at 54,349.12 is 789.13 points away. Friday's low of 53,489.41 is the immediate floor. With Chevron and Exxon Mobil both bid and the industrials complex soft — 3M fell 2.56% and Honeywell 2.19% on Friday — the Dow's internal composition roughly cancels out, which is how it produced a nine-point session on Friday in the first place.
The Russell 2000 at 2,972.37 is the one to watch for a genuine regime read. Small caps have the most direct sensitivity to the two-year yield. If the front end holds near 4.32% and the Russell still cannot reclaim 3,000, that is confirmation the small-cap breakdown is structural rather than rate-driven.
Volatility sets the frame. At 14.43, the VIX prices a daily S&P 500 move near 0.9%. Premarket VIX futures exposure is bid 0.76%. Every reading in that complex says the options market expects this session to be quiet. Every reading in the underlying tape says the ingredients for a violent one are already assembled.
Verdict: A Green Month That Earned Almost None Of It
August 2026 will book as a winning month across all three major U.S. indexes, and the composition of that win is the reason to fade it rather than chase it.
The Dow's 2.1% gain and fifth straight monthly advance, the S&P 500's roughly 3% and the Nasdaq's roughly 4% were produced by a technology sector up almost 6%, with Nvidia contributing more than 8%, Microsoft 10% and Micron 13%. The software complex ran 16%. Against that, the Russell 2000 sits 2.64% below its August 11 level, all three indexes finished Friday between 1.12% and 1.50% under their August highs, and the classic defensive hedges — gold down 3.19% Friday, utilities cratering on California liability risk — are both unavailable.
The macro backdrop hardened decisively in the last 48 hours of the month. September hike odds moved from 35.4% to near 58%. The two-year yield ripped nearly twelve basis points in a session to 4.34%. Chicago manufacturing collapsed 10.5 points into contraction at 47.1 with prices paid accelerating. Consumer sentiment fell to 51.7 with long-run inflation expectations stuck at 3.3% for a third month. And a Hormuz war premium that had been steadily bleeding out came back in a single weekend, with Brent at $91.20 and WTI at $86.30.
The session verdict is mixed with a bearish skew. Energy has a genuine bid and it is not large enough to carry the index. Semiconductors are stabilizing off a 3% Friday drawdown, not recovering. Software is giving back the month's leadership. Utilities are being repriced on a liability tail nobody had modeled. Small caps never confirmed anything. Futures are pointing lower into month-end rebalancing flows that mechanically favor selling equities.
What the tape needs is a labor market weak enough to take a September hike off the table without being weak enough to break earnings — a narrow corridor that ISM Tuesday, ADP Wednesday and payrolls Friday will either find or miss. Until then, the bid is real but it is concentrated in fewer names than at any point this year, and a 14.43 VIX is not compensation for that concentration. Treat the month-end green as an accounting outcome, not a market signal.




