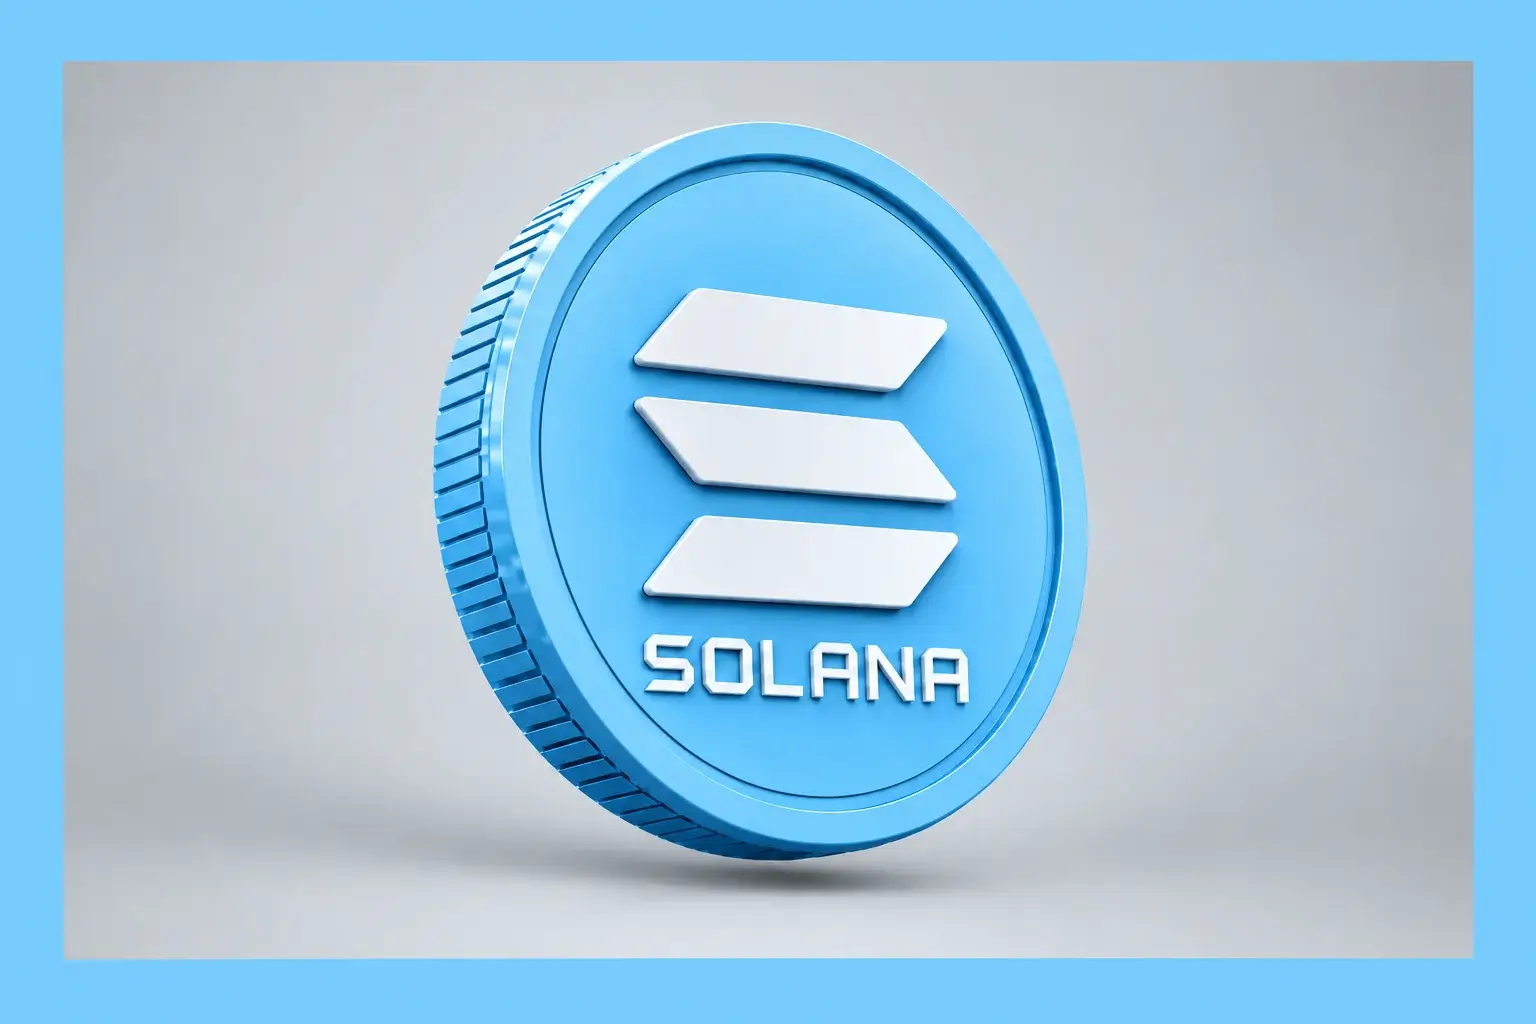
Solana Tests $100 as BSOL Hits Record Volume — Can Bulls Clear $102 With RSI at 87?
Solana processed 1.3 billion non-vote transactions last week and beat Coinbase | That's TradingNEWS
Key Points
- SOL rose 6.72% to $100, up 66% from the $60.14 swing low.
- US spot Solana ETFs took $33.49 million on August 24, with BSOL contributing $24.99 million.
- Open interest hit $6.30 billion with Binance long/short at 1.75.
SOL-USD broke through the $100 handle Tuesday, trading up 6.72% on the session in one of the sharpest single-day moves the token has produced this year. Prints across the session spanned $96.24 to $101.82, with the market testing and clearing the psychological level that has capped every recovery attempt since spring.
The recovery from the lows is what makes this move consequential. Solana bottomed at a $60.14 swing low, with the June trough registering $60.29. On August 20 the token traded $75.75 on a $44.14 billion market capitalization. By August 23 it reached $92.87. Tuesday it cleared $100.
That is a 66% advance from the swing low and a 32% gain in five sessions.
Context on where this sits in the longer arc: Solana set its all-time high at $293.31 on January 19, 2025. At $100 the token trades 65.9% below that peak, having endured a drawdown that reached 73% at its worst and a total value locked decline of 56%.
The broader complex supported the move without leading it. Bitcoin traded $79,681, up 0.97%, after clearing $80,000 for the first time in three months. Ethereum held $2,490, up 0.38%. XRP traded $1.504, up 1.64%. Solana's 6.72% gain outran every major by a wide margin.
That outperformance is the tell. When a high-beta layer-1 gains seven times what Bitcoin does on the same day, the driver is asset-specific rather than a rising tide — and in this case the driver is measurable and sits in the exchange-traded fund flow data.
Historical seasonality offers no guidance. August is unusually split for Solana: the median return is effectively flat at -0.001%, while the average sits at +61.1% — the highest of any month in the token's calendar. That average is carried entirely by 2020's +213.6% and 2021's +199.8%, two outlier months with nothing comparable since.
The honest read is that August is not reliably strong for SOL, but it is the one month where the right macro conditions have historically produced the largest single-month gains in the token's history.
The ETF Day That Produced This: $33.49 Million and $166 Million of Volume
The catalyst is specific and it landed Monday.
All nine U.S. spot Solana ETFs recorded $33.49 million in combined net inflows on August 24 — the highest single-day intake since December 2025 and a 2026 high for the category.
The Bitwise Solana Staking ETF took $24.99 million of that total, representing 74.6% of the day's category flow and marking the fund's largest inflow since February 2026.
Trading volume set a genuine record. BSOL alone traded $108 million on August 24 — the highest volume day for any Solana ETF in history, per the issuer's own president. Across all SOL ETF products, daily traded volume hit an all-time high of $166 million.
Volume records and inflow records arriving on the same session is the configuration that matters. Inflows measure new capital. Volume measures engagement. A fund can take inflows on thin volume — that is one large allocator. Taking record inflows on record volume means the buyer base broadened rather than concentrated.
The mechanical effect on spot is direct. Every dollar entering a spot Solana ETF requires the authorized participant to purchase physical SOL and deliver it to the fund. Thirty-three million dollars at roughly $95 average execution removes approximately 352,000 SOL from the tradable float in a single session.
The category context makes the number more impressive than it appears in isolation. Solana ETF flows have been anemic for most of 2026 — a period when the funds were characterized as running negative flows against roughly $725 million of combined assets under management while SOL traded at $72.91 with sentiment readings deep in fear territory at 26 out of 100.
From negative flows and $725 million in assets to a record $33.49 million day is a genuine regime change in the demand picture, not a marginal improvement.
Whether it persists past this week is the entire question.
BSOL Crossed $1 Billion, and It Did It on the Way Down
The single most compelling datapoint in the Solana story right now is a cumulative figure rather than a daily one.
The Bitwise Solana Staking ETF surpassed $1 billion in cumulative inflows as of August 25 — one of the fastest accumulations for any Solana-linked product.
The context the issuer supplied is the part that matters: the fund took in nearly $1 billion in inflows while the price went from $225 to $60.
Read that again. Institutional capital allocated a billion dollars into a regulated Solana vehicle during a 73% drawdown. That is not momentum chasing. That is programmatic accumulation into weakness, and it is the behavioral signature of allocators executing a mandate rather than traders expressing a view.
The comparison to XRP is instructive. Seven U.S. spot XRP ETFs have accumulated roughly $1.49 billion across nine months against a $92 billion market capitalization — 1.6% of supply. Solana's category has reached $1.21 billion in total net assets against a market cap near $58 billion at $100, representing roughly 2.1% of the asset's value.
Solana's ETF penetration is meaningfully deeper relative to its size, and it was achieved during a worse drawdown.
Total net assets across the Solana ETF complex now stand at $1.21 billion, a 68% increase from the $717 million recorded in June 2026. That growth combines price appreciation with genuine new capital — the June-to-August price move accounts for roughly a third of it, leaving the balance as inflow.
Cumulative inflows across the category reached $1.15 billion earlier this month against total net assets of $878.33 million at the time, which means the category was carrying an unrealized loss on aggregate cost basis. At $100 that gap has closed and then some.
Funds sitting on gains behave differently from funds sitting on losses. The redemption pressure that hangs over an underwater ETF complex has been removed.
Staking Is the Structural Difference Nobody Priced
Solana's ETF category has something Bitcoin's cannot replicate and Ethereum's only partially delivers.
The Bitwise product is explicitly a staking ETF. Fidelity's FSOL can stake 100% of its holdings, and on August 24 the firm authorized 100% staking across its crypto funds — expanding institutional access to on-chain yield, though with potential redemption-timing implications.
These products package spot exposure with staking yield, which is the specific feature appealing to traditional allocators who cannot justify a zero-yield position in a mandate.
The supply mechanics compound the demand effect. Every dollar into a staking ETF requires buying spot SOL and locking it with a validator. That is a double withdrawal from liquid float — the purchase removes the token from the market, and the staking removes it from the redeemable pool until the unstaking queue clears.
Bitcoin has no native yield. Its ETFs can only track a price. Ethereum's staking products exist but have faced a cannibalization question, with capital rotating from non-staking to staking vehicles at the same issuer rather than arriving as new money.
Solana's category launched into staking as the default rather than as a retrofit, which avoids that internal rotation problem entirely. BSOL taking 74.6% of Monday's category flow while the non-staking alternatives split the remainder tells you where the preference sits.
The strategic implication for anyone modeling supply: as ETF assets grow, an increasing share of SOL becomes contractually locked in validator positions with multi-day exit queues. That converts a liquid float into a semi-illiquid one, which amplifies price moves in both directions.
The risk sits in the redemption mechanics. Staked positions cannot be unwound instantly, which means a stress event could produce discounts to net asset value that a spot-only fund would not experience.
Morgan Stanley's spot Solana ETF launched July 28 and accumulated $19.46 million in under a week, driving the largest single-day inflow across all U.S. SOL products on its second trading day.
The Network Is Setting Records: 1.3 Billion Transactions
The on-chain data supports the price move in a way that was not true during Solana's earlier rallies.
Solana processed more than 1.3 billion non-vote transactions last week — beating the record set just seven days earlier. Two consecutive record weeks is the pattern of genuine adoption rather than a single spike from a memecoin cycle.
Non-vote transactions are the metric that matters. Solana validators generate enormous volumes of consensus vote transactions that inflate raw throughput figures and mean nothing about usage. Stripping them out gives the actual economic activity on the chain.
Weekly decentralized exchange volumes reached $18.62 billion — the highest since June 2026. That is the direct measure of trading demand routing through Solana infrastructure rather than through centralized venues.
The competitive comparison is where it gets genuinely notable. Solana has now beaten Coinbase, Bybit, and Kraken in weekly DEX spot trading volume for nine consecutive weeks, ranking second only to Binance across all trading venues — centralized and decentralized combined.
A blockchain outranking three of the largest regulated exchanges on the planet in spot trading volume, for nine straight weeks, is a structural change in market microstructure rather than a temporary anomaly.
The technical foundation supporting it: approximately 1,100 transactions per second in sustained throughput, 400-millisecond block times, and a base transaction fee of 5,000 lamports per signature. Spot DEX market share reached 33% in Q1 2026.
Reliability has been resolved. The network has recorded 100% uptime over a 90-day-plus window, with no full halt since February 2024. That two-and-a-half-year record retires the single largest objection institutional allocators raised against Solana through 2022 and 2023.
The architectural advantage is durable because it stems from fundamental design choices — Proof of History and parallel transaction processing — rather than from temporary network conditions.
The Monetization Gap: $586 Million of Lifetime Fees
Here is the bear case, and it is the same structural problem that afflicts XRP.
Solana's all-time cumulative network fees total $586 million. Ethereum's total $13.12 billion.
Ethereum has captured 22.4 times more value at the base layer across its history, despite Solana processing dramatically more transactions. The reason is architectural: Solana's fee model is designed for negligible cost per transaction, which is exactly what enables the high-frequency use cases driving the volume records.
The consequence is that applications capture roughly 134 times more value than the SOL token does. Trading venues, launchpads, and DeFi protocols built on Solana generate substantial revenue. The base layer collects fee dust.
That is the central tension for anyone holding the token rather than equity in the applications. A network can process 1.3 billion transactions weekly and rank second globally in spot volume while the asset securing it captures a thin skim.
Total value locked has declined 56% from its peak, and heavy speculative activity concentration remains a documented risk — a meaningful share of transaction volume comes from memecoin trading rather than from durable financial infrastructure. Monday's incident where a celebrity social media account was compromised to promote a Solana memecoin illustrates both the ecosystem's reach and the quality-of-activity problem.
The counterweight to the fee argument is staking yield. Unlike Ethereum, where value accrual runs through fee burn, Solana's holders capture value through inflation-funded staking rewards — which is why the ETF structure matters so much more here than elsewhere.
Three SIMD governance proposals under consideration could reduce SOL emissions and increase burns, tightening supply if passed. That is the mechanism that would convert network usage into token scarcity, and it is a governance question rather than a technical one.
Read More
-
Yen Stalls at 160 Despite a 3% JGB and Tokyo Core CPI at 2.0% — Intervention Sits at 164, Friday's Payrolls Decide
02.09.2026 · TradingNEWS ArchiveEnergy
-
ZTAX Fund Jumps 7.36% to $22.83 After a Holiday Plunge to $21.26 Exposed a 10% Discount to NAV
13.10.2026 · TradingNEWS ArchiveStocks
-
XRP ETF Price — Bitwise Drives $11.31M Weekly Inflow as XRP Slides to $1.345 and ETF Holders Sit $230M Underwater
13.10.2026 · TradingNEWS ArchiveCrypto
-
Henry Hub Climbs to $3.26 While Europe Pays €86.93 — Record 111.5 Bcf/d Output Caps the Upside Near $3.41
13.10.2026 · TradingNEWS ArchiveCommodities
-
Dollar-Yen Pinned at 158.42 Between Carry and Intervention — 159 Caps Upside, 157 Opens on Soft CPI
13.10.2026 · TradingNEWS ArchiveForex
Open Interest at $6.30 Billion Is the Warning
The derivatives picture is the strongest argument for caution at these levels.
Solana open interest reached $6.30 billion — the highest reading since May 2026. That expansion has occurred alongside the price advance rather than during a consolidation, which means leverage is being added into strength.
Positioning is one-sided. The long/short ratio on Binance reads 1.75 and on OKX reads 1.53. Both figures describe a market where longs outnumber shorts by a wide margin — the opposite of the setup that produced Bitcoin's short squeeze last week.
Whale traders opened $36 million of Solana long positions on a decentralized perpetuals venue on August 25 alone.
That combination — record open interest, a 1.75 long/short ratio, and fresh whale longs at the highs — describes a crowded trade. Crowded trades do not prevent further upside, but they change the character of the eventual pullback from orderly to violent.
The mechanism is straightforward. When price stalls with $6.30 billion of open interest skewed 1.75 to 1 long, the liquidation cascade runs downhill. A 6% adverse move liquidates the highest-leverage tier, which produces forced selling, which triggers the next tier.
Compare this against Bitcoin's current configuration, where coin-denominated open interest sits at a one-month low, funding runs near 0.01% neutral, and the long/short ratio reads 1.11. Bitcoin's rally was built on spot ETF creations with leverage removed. Solana's is being built with leverage added.
That distinction matters more than any technical level. An ETF-funded rally can consolidate. A leverage-funded rally has to keep moving or it unwinds.
The offsetting evidence is that ETF inflows are genuinely present and accelerating, which means spot demand exists beneath the derivatives froth. The question is the ratio: $33.49 million of ETF inflow against $6.30 billion of open interest means derivatives dominate price discovery by a factor of roughly 188 to 1 on a stock basis.
Alpenglow, Firedancer, and the Emission Proposals
The protocol roadmap is where the multi-quarter case lives, and the timeline is near.
Alpenglow is a consensus rewrite targeting approximately 150-millisecond finality — down from the current structure. Mainnet activation is expected sometime in the third quarter of 2026, which places it inside the current window.
Finality at 150 milliseconds would put Solana settlement inside the latency budget of traditional electronic trading systems. That is the threshold at which on-chain order books become genuinely competitive with centralized matching engines rather than merely adequate for retail flow.
Firedancer, the independent validator client implementation, continues rolling out. Client diversity addresses the single largest remaining technical risk — a bug in the dominant client taking down the network, which is precisely the failure mode behind Solana's historical outages.
The tokenomics work is the third leg. Three SIMD proposals under governance consideration could reduce SOL emissions and increase burn mechanics. If passed, they would tighten supply directly — the change that would convert Solana's usage records into token value accrual.
That combination — faster finality, client diversity, and reduced emissions — is the closest thing to a coordinated catalyst calendar any major layer-1 currently has.
The realistic caveat: no single upgrade lifts a token substantially on its own. Faster finality and higher throughput support demand for the network over time, especially if trading and DeFi activity keep growing, but the transmission from technical capability to token price runs through adoption and then through fee capture — and Solana's fee capture is structurally thin by design.
The metrics that would confirm the thesis are observable: active addresses, total value locked, DEX activity, and institutional adoption through the ETF channel. Three of those four are currently improving. Total value locked, down 56% from peak, is the laggard.
RSI Near 87 Is the Immediate Problem
The momentum reading is the reason to expect a pause rather than continuation.
The relative strength index sits near 87 following the break above $100. Readings above 80 are uncommon; readings near 87 mark the top decile of the indicator's historical distribution for this asset.
Five days ago, with SOL at $87.56, the technical picture was described as overwhelmingly bullish across nine of ten dimensions, with only overhead resistance showing weakness. RSI was already deep in overbought territory then, the MACD histogram was expanding above its signal line, Bollinger Bands were compressed with price in the upper band, and on-balance volume was rising.
Price has since added 14% and RSI has climbed further.
The moving average structure is fully constructive. At $87.56 the token traded above the 20-day EMA at $77.40, the 50-day EMA at $76.39, and the 100-day EMA at $77.36 — a textbook bullish stack. The 200-day EMA at $81.25 sat above the shorter-term averages, indicating a residual macro headwind, but price held $6.31 above the 200-day line confirming the long-term trend was intact.
At $100, every one of those averages sits well beneath price. The 200-day EMA at $88.97 on the longer measurement is 11% below spot.
Overbought conditions in a genuine trend change can persist for weeks. RSI above 80 marks tops only when it coincides with divergence — price making higher highs while the oscillator makes lower highs. That divergence has not formed.
What RSI at 87 does mean is that the easy money in this move has been made and the risk-reward for a new entry has deteriorated materially. A buyer at $60 has 66% of cushion. A buyer at $100 has none.
The constructive path from here is consolidation between $95 and $105 that lets RSI unwind toward 60 while price holds. The destructive path is a sharp reversal that liquidates the $6.30 billion of open interest.
Levels: $110 and $120 Above, $89 and $80 Below
The technical map after the $100 break is unusually clean because there is little structure between the levels.
Immediate resistance is the $100 handle itself, which the token is testing rather than having decisively conquered. A daily close above $102 is the confirmation threshold that would gauge whether institutional buying can overpower the current technical overhead.
Above $102, the next resistance band runs $110 to $120, with $130 to $135 as a stretch target. That $110 to $120 zone carries volume from the spring trading range and represents the accumulated cost basis of holders who bought the breakdown.
Immediate support is the $95 to $100 zone — the level just cleared, which flips to support on a retest. Beneath that, $89 to $90 aligns with the 200-day EMA at $88.97 and forms the first genuine structural floor.
Below $89, the $80 handle is a deeper support zone. Beneath $80, the chart runs to the $75 area where the 20-day, 50-day, and 100-day EMAs clustered during the base-building phase, and then to the $60.14 swing low.
The measured objective on a confirmed close above $102 is $120, representing 20% upside from spot. That target aligns with the upper resistance band and would take Solana's market capitalization to roughly $70 billion.
The invalidation is $89 to $90. A daily close beneath the 200-day EMA would convert this breakout into a failed rally identical to the July attempts that were rejected at the 0.382 Fibonacci near $74.79.
Watch volume on any retest of $100. A pullback to $95 on declining volume is healthy consolidation. A pullback on expanding volume with open interest unwinding is the start of the leverage flush.
The Macro Calendar Decides Whether This Holds
Solana is the highest-beta major asset in the complex, which means it will amplify whatever the macro delivers this week.
Wednesday brings the July core Personal Consumption Expenditures price index alongside the second estimate of U.S. Q2 GDP. Friday delivers Fed Chair Kevin Warsh's first Jackson Hole keynote at 8:00 a.m. ET, with the symposium running August 27 to 29 under an official theme of financial innovation and its implications for payments and policy — placing digital asset regulatory direction formally on the agenda.
The same Friday morning carries the preliminary annual benchmark revision to U.S. nonfarm payrolls.
The driver of the entire crypto complex this month was fiscal rather than monetary. The U.S. Treasury expanded long-end bond buybacks from $2 billion to at least $4 billion per operation, potentially funded from a $950 billion cash account, which revived debasement concerns and pushed Bitcoin above $80,000 for the first time in three months.
Solana rode that tide with leverage. A high-beta asset in a risk-on regime outperforms; in a risk-off reversal it gives back multiples of what the majors lose.
September 15 brings a procedural cloture vote on the CLARITY Act, the U.S. digital asset market structure framework. Regulatory codification matters for Solana specifically because the ETF category's staking structures rest on interpretations that legislation would make permanent.
September 16 delivers the FOMC decision, with federal funds at 3.50%–3.75% and hold probability near 61%.
The cleanest bullish setup for SOL is a soft core PCE Wednesday combined with a dovish Warsh Friday, which would extend the debasement bid and let ETF inflows compound into a market with $6.30 billion of open interest already positioned long.
The cleanest bearish setup is a hot PCE and a hawkish keynote, which would lift the dollar, pressure the entire risk complex, and trigger the liquidation cascade that crowded long positioning has set up.
Forecast: $120 on a Close Above $102, $89 Invalidates
The base case is consolidation between $95 and $105 across the next one to two weeks. A token that has gained 66% from its swing low with RSI near 87 and record open interest does not extend without digesting, and the $100 level has rejected multiple prior attempts. Expect the market to spend sessions rather than hours deciding whether $100 becomes support.
The bull case requires a daily close above $102 with ETF inflows sustaining above $20 million per session. Those two conditions together confirm that institutional buying can overpower the technical overhead, and they open the $110 to $120 band as the immediate objective with $130 to $135 as the extension. The structural support for that path is genuinely strong: BSOL crossing $1 billion in cumulative inflows, category net assets up 68% since June to $1.21 billion, record ETF trading volume of $166 million, 1.3 billion weekly non-vote transactions beating the prior week's record, nine consecutive weeks outranking Coinbase, Bybit, and Kraken in DEX spot volume, and Alpenglow's 150-millisecond finality upgrade targeted for this quarter.
The bear case triggers on a daily close below $89 to $90, which sits at the 200-day EMA and marks the boundary between a trend change and a failed rally. Below it, $80 opens directly and the $75 EMA cluster becomes the test. The catalyst most likely to produce it is a leverage unwind: $6.30 billion of open interest with long/short ratios at 1.75 on Binance and 1.53 on OKX is a crowded book, and crowded books liquidate downhill.
The forecast: $120 target on a confirmed daily close above $102 with sustained ETF inflows, with $89 as hard invalidation and $95 as the first warning line.
Weight the upside modestly. The institutional bid is real and it is documented — nearly a billion dollars allocated into a staking vehicle while price fell from $225 to $60 is programmatic accumulation, not momentum chasing, and that capital does not exit on a 10% pullback.
Against that: $586 million of lifetime network fees against Ethereum's $13.12 billion means the base layer captures a thin skim while applications take 134 times more value, total value locked remains 56% below peak, RSI near 87 leaves no cushion, open interest at a four-month high is positioned 1.75 to 1 long, and the token still trades 65.9% below its January 2025 record.
Solana has fixed the reliability problem and won the volume war. It has not yet solved value capture. Trade $102 and $89 and let the macro decide the rest.