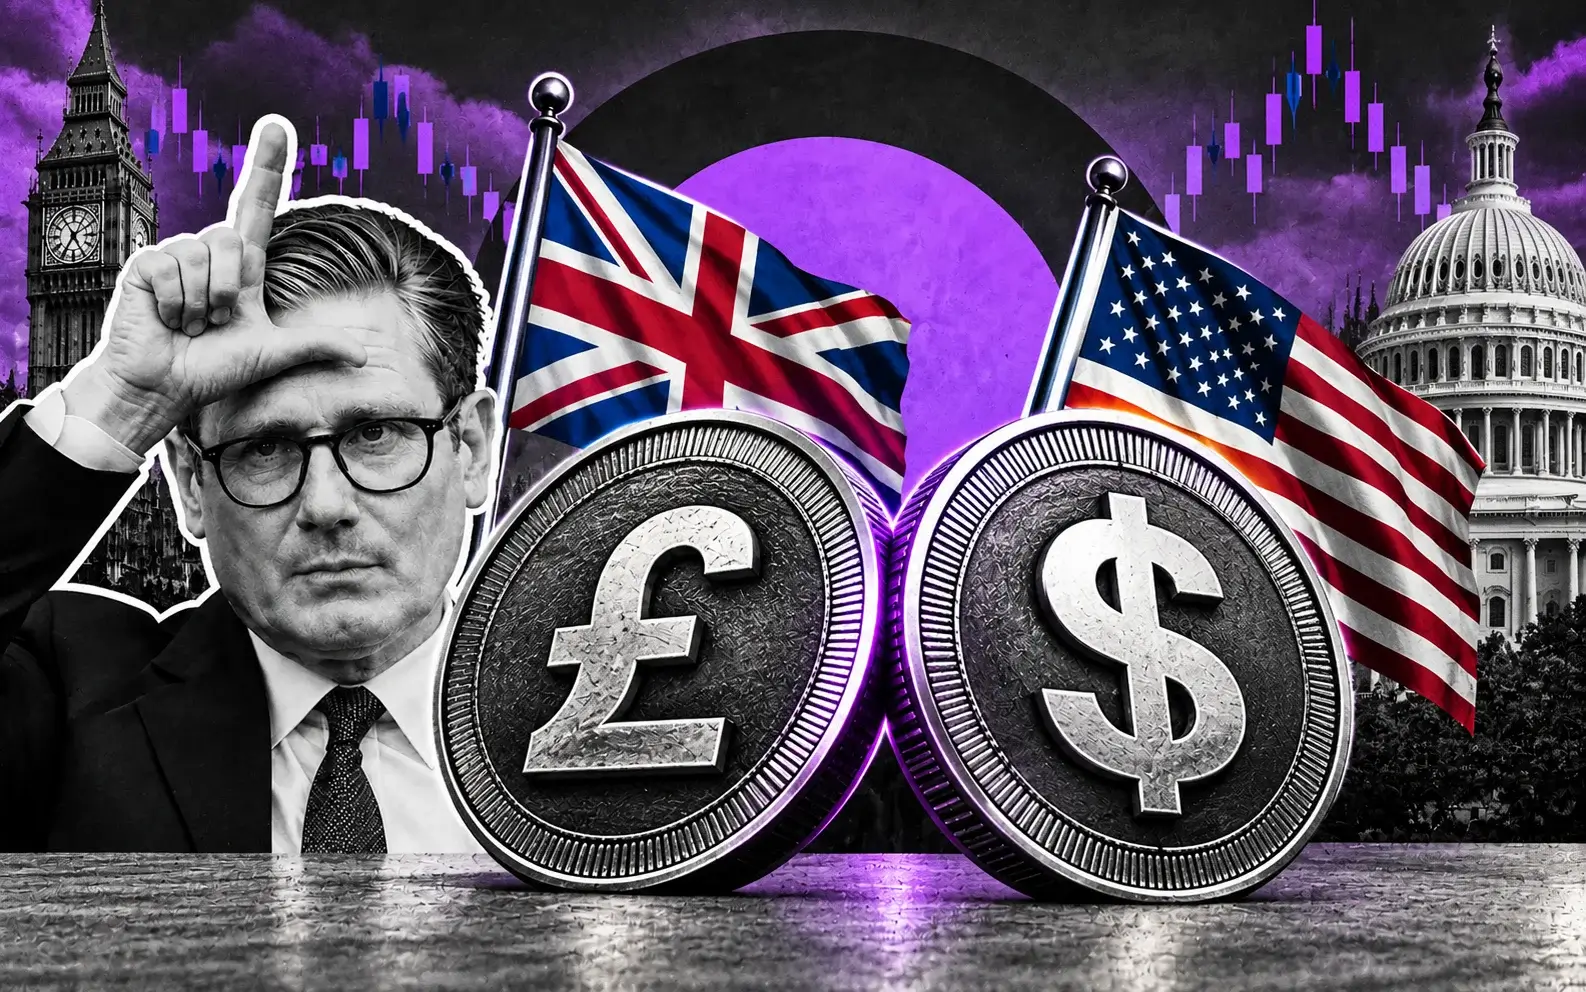
Sterling Grinds At 1.3469 With 50- And 200-Period Averages Compressed To 8.8 Pips Ahead Of Friday's US Payrolls
June UK CPI cooled to a 15-month low of 2.6% and private wage growth slowed to the weakest since 2020 | That's TradingNEWS
Key Points
- Cable traded 1.3469 after failing at 1.3480 and printing a 1.3520 swing high on August 1.
- The 50- and 200-period moving averages sit 8.8 pips apart at 1.34440 and 1.34528.
- Bank Rate at 3.75% against the Fed's 3.50%-3.75% leaves a 12.5 basis point differential.
Sterling traded $1.3469 Thursday, flat on the session, after printing 1.34607 Wednesday and touching two-day highs past 1.3480. That leaves the pair sitting almost exactly in the centre of a range it has occupied for roughly fifteen months, and the price action of the last nine sessions traces the whole problem.
Cable based near 1.3280 on July 28, then rallied hard into the central bank decisions and printed a swing high close to 1.3520 across July 31 and August 1. Resistance near 1.3480 rejected it. The pair pulled back to the 1.3420-to-1.3430 area — well above the late-July base — then climbed through August 4 and August 5 to 1.34607. On the hourly chart it consolidated above the 1.3454-to-1.3458 band for a second time Wednesday and could not extend.
That is 240 pips of round trip in nine sessions with no net progress. From the 1.3280 base to 1.3520 is a 1.81% advance; from 1.3520 back to 1.3469 is 51 pips of give-back. The forecast band for the week ran 1.32 to 1.36, and price has spent it in the middle third.
The year-to-date arc gives the pair credit it has not fully earned. Cable sat near 1.32 in late June, close to a seven-month low, then broke above 1.34 in early July for the first time in a year and reached a fresh one-year high near 1.343. From there it has added a further 40 pips in a month.
The trend structure remains technically bearish despite the recovery. The latest completed downward wave broke below the previous low, while the latest upward wave failed to break above the previous peak. That configuration keeps the initiative with sellers even as the price grinds higher — the 2026 bearish impulse may be complete, and it has not been invalidated.
The other majors confirm this is a dollar story rather than a sterling story. The euro held $1.1557, the yen 157.85, the New Zealand dollar $0.5885 and the Australian dollar $0.7056 — all little changed. The dollar index sat at 99.65 near a seven-week low. Every G10 currency is drifting higher against a soft dollar without any of them leading.
Fifteen months of sideways action means the range itself is the trade. The levels matter more than the narrative.
The 1.3500 Wall And A Swing High At 1.3520
The standout level on the chart is the confluence of resistance with the round number at 1.3500, and it has continued to hold. The recent high came in slightly below it, printing price action that somewhat resembles a bearish double top — the July 31 to August 1 swing high near 1.3520 followed by a failure at 1.3480 on the retest.
That resistance zone is layered and it has history. The 61.8% retracement of the May decline sits together with the 2026 yearly open at 1.3460 to 1.3474 — the exact band that rejected sterling in early July and triggered the last major reversal, with the subsequent decline extending more than 2.5% off the June highs. Cable is trading into that same threshold for a third time.
Above 1.3500, the next objectives are 1.3591 and then 1.3648 to 1.3685. Clearing 1.3520 would take out the swing high and invalidate the recent downtrend, strengthening the case for a larger trend reversal. Failure keeps the broader fifteen-month range intact, which is what has happened on both prior attempts.
Support is equally dense and that is the source of the deadlock. The strongest downside level is the round number at 1.3400, backed by 1.3375 where a former descending trend line now acts as a floor, and 1.3365 where simple moving averages cluster. Beneath that, 1.3326 is the May low close and also the 38.2% retracement of the 2025 advance. The broader uptrend support line was last touched near 1.3289, and 1.3280 is the July 28 base. Deeper still sit 1.3194 to 1.3199 as key support and 1.3092.
The levels between the round numbers look considerably more questionable than the round numbers themselves — 1.3400 and 1.3500 are the ones with genuine order flow behind them. Everything in between is noise on a chart with too many lines drawn on it.
Momentum is constructive without being stretched. The 14-period relative strength index hovers near 59, indicating firm but not overextended upside, and the pattern of higher daily lows since the 1.3289 touch remains intact.
A 100-pip box between 1.3400 and 1.3500 with a 59 relative strength reading and a failed double top at the ceiling describes a market with no conviction in either direction.
Moving Averages Compressed At 1.3444 And 1.3453
The moving average structure is the cleanest quantitative expression of the deadlock. The 50-period line reads 1.34440 and the 200-period line 1.34528 — a separation of just 8.8 pips, with spot trading above both.
That configuration is unusual and it is informative. The shorter average sitting fractionally below the longer one while price trades above both means the recent recovery has not yet been long enough or strong enough to flip the average cross. A market that has been sideways for fifteen months produces exactly this: averages converging on the same level because there is no trend for them to separate around.
On the daily timeframe the picture reads modestly bullish. Spot sits above the 50-day exponential moving average by 0.6% and above the 100-day by 0.57%, while holding near the 8-day and 21-day lines. The clustered simple moving averages around 1.3365 form the demand band alongside the 1.3375 former trend line, and the pair holding above them keeps a constructive near-term bias in place.
The compression matters for what happens next rather than what has happened. Averages 8.8 pips apart at 1.3444 and 1.3453, with spot at 1.3469 and resistance at 1.3460 to 1.3474, means the entire technical apparatus is stacked inside a 30-pip window. A break in either direction resolves the cross, the retracement level and the yearly open simultaneously — which is why the eventual move should overshoot rather than grind.
The dollar side of the chart argues for the upside resolution. The dollar index has moved decisively lower from key resistance at 101.39 after briefly breaking out to a new long-term high a few weeks ago. A medium-term downtrend in the dollar with cable pressed against resistance is a setup that typically breaks higher, and it directly contradicts the bearish double top on the sterling chart.
So the two charts disagree. Cable says failure. The dollar says breakout. That contradiction is why almost everything in the pair suggests deadlock, and why the practical approach into Friday is to trade rejections of the round numbers rather than to pick a direction.
Thirty pips of technical apparatus and two charts pointing opposite ways. That is the position going into a payroll print.
The Dollar Index At 99.65 Is Doing All The Work
Sterling has not earned this level. The dollar has surrendered it.
The dollar index fell below 99.8 Wednesday to its lowest reading in seven weeks and held 99.65 Thursday, drifting without direction near the psychological 100 handle. In the prior week it posted one of its worst weeks since the first week of April, finishing with losses above 1.30% and reaching a 30-day low.
Three separate forces produced that decline and none of them originated in Britain. The first was coordinated intervention on the yen — the first collaborative action between Japanese and U.S. monetary authorities since 1998 — which pulled the currency back from 40-year lows near 162 to 164 and forced a broad unwind of dollar length. The yen touched 155.20 Monday before retracing to 157.85.
The second was foreign selling of long-dated dollar-denominated fixed income. That is reserve and institutional money reducing structural dollar exposure, a flow that does not reverse on a data print and that explains why the index has been unable to reclaim 100 despite record U.S. equity highs and a 3.50%-3.75% policy rate.
The third is the collapse in September rate-hike pricing, from roughly 67% earlier in the week to between 48% and 55% now, driven by a Strait of Hormuz shipping framework that has pushed crude to three-week lows and compressed the inflation impulse that had driven the entire 2026 rate story.
Sterling carries an 11.9% weight in the dollar index against the euro's 57.6%, which means cable is a passenger in that trade rather than a driver of it. Every pip of the move from 1.3280 to 1.3469 traces to dollar weakness.
The structural support under the dollar is what caps it. A risk-on environment would normally push the currency lower, and risk appetite is emphatically on — the Dow printed a record 54,373.94 Thursday. Uncertainty about Fed policy and a U.S. economy still generating sub-200,000 claims prints are keeping the dollar bid near 100.
For cable, that means clearing 1.3500 requires the index to break decisively under 99, and it has not managed a sustained move below 100 in six weeks of trying.
The Rate Differential Has Vanished
The most important structural fact about this pair right now is that the yield gap has closed. Bank Rate sits at 3.75%. The Federal Reserve's target range is 3.50%-3.75%, a midpoint of 3.625%. That is a differential of 12.5 basis points in sterling's favour — effectively nothing.
When the rate differential disappears, cable stops being an interest-rate trade and becomes far more sensitive to sentiment, positioning and political headlines. That is precisely what has happened. Fifteen months of sideways action with 240-pip round trips inside nine sessions is what a currency pair looks like when carry no longer anchors it.
The contrast with sterling's other major cross is instructive. Against the euro, sterling enjoys a 150 basis point advantage — 3.75% against a 2.25% deposit rate — and that gap has held the cross near one-year highs in a 1.15 to 1.18 range, quoted as high as 1.1738 in July against a 2026 low of 1.1402 and a 1.1536 average. The pound has a genuine yield story against the euro and none at all against the dollar.
Both sides of the cable differential are now live in the same direction, which is the reason the pair cannot break out. Three of nine members of the U.K. committee are pushing for a hike. Three of twelve on the U.S. committee are pushing for a hike. Markets price roughly 25 basis points of U.K. increases for 2026, equivalent to a single hike, and between 48% and 55% odds of a single U.S. hike in September. Two central banks with identical policy rates, identical hawkish minorities and identical market-implied paths produce a currency pair that does not move.
The path history shows how violently that pricing has swung. U.K. markets briefly priced four hikes in mid-March, then fewer than two by early April, then two, then back to one. U.S. projections moved from a 3.4% median end-2026 rate in March to 3.8%, with most officials now seeing the rate ending 2026 between 3.6% and 4.1% against 3.25%-3.75% previously. Both economies spent 2026 repricing from a cutting cycle to a hiking cycle.
The trade only reopens when one side moves and the other does not. The U.K. decision lands September 17. The U.S. decision follows. Until then, 12.5 basis points is the whole differential.
A 6-3 Vote And Three Members Pushing For A Hike
The Bank of England held Bank Rate at 3.75% on July 30 in a 6-3 vote, the fifth hold of the year, with three committee members again pushing for an increase and the statement flagging inflation risks skewed to the upside.
That vote split is the forward guidance. Three of nine wanting tighter policy is a meaningful hawkish minority, and it has persisted across multiple meetings rather than appearing once. Set against it, the governor pushed back explicitly on any imminent tightening, pointing to June inflation easing to 2.6% — a 15-month low — and stating that the disinflation process remains on track.
That combination produced the market's current read: a hawkish hold that should keep sterling supported, with the pushback against imminent rate increases limiting how far the support extends. Markets have reduced 2026 hike bets since the meeting and now price roughly a single 25 basis point increase, most likely by December.
The Fed delivered the mirror image a day earlier, holding at 3.50%-3.75% in a 9-3 decision with all three dissenters preferring a quarter-point increase, and with the statement identical to the prior one apart from a single verb and the paragraph naming the dissenters. Three central banks — including the ECB on July 23 — all left rates unchanged inside eight days, which is why sterling has taken its lead almost entirely from the dollar since.
The trajectory into this position is worth stating. Bank Rate was cut 25 basis points to 3.75% in December 2025 in a narrow 5-4 vote, with headline inflation then at 3.2%. Pre-conflict expectations were for two further cuts in 2026. The energy shock from a five-month Middle East war destroyed that path entirely, exposing the U.K.'s vulnerability to energy prices, and the committee has held at 3.75% ever since.
September 17 is the domestic milestone that could reset the range, and it carries an additional dimension: the committee votes on balance-sheet reduction at that meeting. Gilt sales policy is a separate lever from Bank Rate, and with 10-year yields near the top of the G7 it is a decision with direct currency consequences.
For the forecast, the U.K. side is on hold with a hawkish tail. Sterling's next move belongs to Washington.
June CPI At 2.6% And Services At 3.6%
U.K. inflation is cooling and the composition is what keeps a hike alive. June headline CPI came in at 2.6%, below the 2.7% consensus and down from 2.8% in May — a 15-month low. Services inflation eased to 3.6% from 3.7%. Goods inflation fell to 1.7% from 2.0%.
Sterling weakened on the release, which tells you how the market read it: lower inflation means less pressure on the committee to raise rates, lower expected U.K. yields, and less support for the pound. The straightforward equation applied and the currency traded accordingly.
The May detail explains why the committee has not relaxed. Annual CPI held steady at 2.8% in May against forecasts for a rise to 3.0%, but services inflation accelerated to 3.7% from 3.2% in April, surpassing the 3.6% estimate, while core edged up to 2.6% from 2.5%. Services running at 3.7% with headline at 2.8% is a domestically generated inflation problem that energy relief does not solve.
June's 3.6% services print is one tenth lower. That is not disinflation in the services sector — it is stabilisation at a level 160 basis points above the 2% target, in the component that accounts for the largest share of the basket and that responds to wages rather than to crude.
Direction over the next three to twelve months hinges on how quickly U.K. inflation cools relative to the U.S. and the eurozone. The comparison currently favours sterling: U.K. headline at 2.6% against U.S. headline at 3.5% and eurozone at 2.9%. As long as that gap persists, the pound retains a yield advantage over the euro — and against the dollar the advantage is offset by a U.S. committee that has removed its easing bias entirely.
The energy channel is the swing factor and it is turning helpful. Crude has dropped roughly 10% this week on the Hormuz framework, with September WTI at $76.13 and Brent under $80. U.K. inflation is acutely energy-sensitive, and sustained crude in the $70s removes the mechanism that forced the committee to abandon two planned cuts in the spring.
Sticky services at 3.6% is why the Bank is holding rather than cutting. Falling energy is why it is holding rather than hiking.
Wages At 4.3% And The Growth Problem
The labour data has broken in the disinflationary direction and it undercuts the hawkish minority. Earnings unexpectedly slowed to 4.3% in May, with private sector wage growth dipping to its lowest level since 2020.
That is the single most important number for the services inflation problem. Services prices at 3.6% are largely a function of labour costs, and private sector pay running at the weakest pace in six years removes the second-round mechanism that the three dissenting members are worried about. Gilt yields fell on the release and rate-hike bets dimmed.
The growth backdrop reinforces it. The independent fiscal watchdog lowered its 2026 U.K. growth forecast to 1.1% from 1.4% projected in November, and did so before factoring in potential energy-price shocks. Flash business activity readings hit their weakest since September 2025 during the spring, with the war stalling growth while driving inflation higher.
That is the classic stagflationary bind, and it is why the U.K. rate path has been the most volatile in the G10 this year. Markets moved from pricing two cuts pre-conflict, to four hikes in mid-March, to fewer than two in April, to one by December. Nothing about that sequence reflects a stable policy view — it reflects a committee whose mandate is being pulled in two directions by the same shock.
For sterling, weak growth with cooling wages is a net negative on the rate channel and a net positive on the fiscal channel only if it translates into lower yields without raising deficit concerns. That balance has not held: gilt yields have stayed among the highest in the G7 precisely because slow growth makes the debt arithmetic worse.
The U.S. comparison is closer than it looks. American private payrolls slowed to 44,000 in July from 95,000, missing a 70,000 consensus by 37%, with the services employment component contracting at 47.4. Both economies are decelerating on the labour side while both central banks hold with hawkish minorities.
That symmetry is the reason cable sits at 1.3469 rather than 1.30 or 1.40. Two economies with the same policy rate, the same hawkish tail, the same labour softening and the same energy exposure produce a currency pair with nothing to trade except the dollar's own dynamics.
Read More
-
Yen Stalls at 160 Despite a 3% JGB and Tokyo Core CPI at 2.0% — Intervention Sits at 164, Friday's Payrolls Decide
02.09.2026 · TradingNEWS ArchiveEnergy
-
FILG ETF — Filecoin Trust ($1.51) Carries a $1.6M Gap Over Its $2.2M in FIL as the Premium Compresses From 2,000%
22.09.2026 · TradingNEWS ArchiveStocks
-
XRP ETF — Spot Funds Hit $1.68B in Inflows While XRPI's CME Futures Structure Bleeds — $1.54 Is the Trigger
22.09.2026 · TradingNEWS ArchiveCrypto
-
NG ($2.84) Fights Record Supply as Cove Point Outage Sinks Appalachian Hubs — $2.75 Next
22.09.2026 · TradingNEWS ArchiveCommodities
-
USDJPY (157.45) Coils Below 157.536 Fibonacci as 275bp Fed-BOJ Gap Keeps Carry Alive — 159.45 in View
22.09.2026 · TradingNEWS ArchiveForex
Gilts At 4.89% And The G7 Yield Problem
The 10-year gilt yield held 4.89% on August 5, having fallen below 4.9% to its lowest level since July 10 as crude dropped roughly 10% on the week. The yield is up 0.09 points over the past month and 0.36 points higher than a year ago. The 5-year sits at 4.44%, up 0.01 on the session and 0.43 points above year-ago levels.
Those absolute levels are the story. U.K. 10-year yields have been among the highest in the G7 all year, partly reflecting inflation pressure linked to the Iran conflict and its effect on energy prices. The 10-year touched a near 18-year high of 5.1% in March and hit an 18-year high again in May. The 30-year reached 5.75%.
Normally a currency with the highest nominal yields in its peer group appreciates. Sterling has not. When the 10-year rose 8 to 9 basis points to 5.02%-5.04% on the change of prime minister, the pound fell 0.3% at the same time — investors read the rising yield as compensation for additional fiscal risk rather than evidence of a stronger economy.
That is the critical distinction for anyone forecasting this pair. Gilt yields at 4.89% are not a carry attraction; they are a risk premium. A currency where higher yields coincide with a weaker exchange rate is behaving like an emerging market rather than a reserve currency, and that behaviour has recurred repeatedly through 2026.
The current retreat toward 4.89% is therefore constructive for sterling rather than negative. Lower yields driven by falling oil and a credible commitment to existing fiscal rules represent a reduction in the risk premium. The largest weekly drop in gilt yields since late 2023 came when three things happened together: oil fell, political replacement odds dropped, and the incoming leadership committed to maintaining the current fiscal rules.
That is the template for a sterling rally. It requires crude to stay in the $70s, the fiscal framework to hold, and the September balance-sheet vote to avoid a supply shock.
Every basis point of additional yield sustained over a year translates into hundreds of millions of additional debt-servicing cost. That arithmetic is why the gilt market, not the rate differential, is now the primary driver of cable.
The Autumn Budget Is The Overhang
The pound's fate is tied to fiscal credibility in a way it has not been since 2022. A new prime minister took office on July 20 and appointed a new chancellor, replacing the previous incumbent. Within hours of the new leader invoking "fiscal flexibility," the 10-year gilt yield rose 8 basis points to 5.04% and the 30-year climbed 9 basis points to 5.75%, its highest in two months. Sterling fell 0.3%.
The word itself was the trigger. The fiscal framework created in 2019 requires the debt-to-GDP ratio to be falling by the end of a five-year forecast period. Any perceived weakening of that commitment invites a sell-off, and the market's read on "flexibility" was that borrowing would exceed expectations. Meeting the rules technically but not in spirit does not satisfy the bond market.
The first 72 hours set a tone of decisive movement away from centrist policy toward a more interventionist agenda focused on the cost of living. Local election results had already reinforced concerns about the governing party's domestic position. Fiscal credibility, and the new leadership's performance over its first 100 days, will be central to sterling's direction over the coming year.
The autumn Budget is the event that resolves it. Markets are focused on whether the new Treasury team maintains the fiscal rules inherited from its predecessor, and on the fact that planned changes to the fiscal framework were left in place that could create additional borrowing room this autumn. Prior budget arithmetic delivered a £22 billion fiscal buffer against a £15 billion expectation, alongside £26.1 billion of new revenue measures by 2029-30 and frozen income tax and national insurance thresholds until 2030-31.
The reference point everyone is trading against is September 2022, when unfunded tax cuts drove 30-year yields from 3.6% to 5.1% in four trading days — a 150 basis point move — and sterling to a post-decimalisation record low of $1.035. Central bank research subsequently found that leveraged pension-fund positions amplified the crash through forced selling, accounting for at least half the gilt price fall, and required emergency purchases on whatever scale necessary. The government collapsed within 44 days. The structural fragility persisted.
For cable, that history means the fiscal tail risk is fat and one-directional. Fiscal credibility maintained gets sterling to 1.3500 and beyond. Fiscal credibility questioned takes it through 1.3326 and 1.3194 fast.
£109 Billion Of Debt Interest And 100% Debt-To-GDP
The numbers underneath the fiscal risk are worth stating precisely because they explain why the gilt market reacts to single words.
U.K. debt interest payments are forecast at approximately £109 billion for 2026-27 — roughly 9% of all government revenues and comparable in size to the entire education budget. Public debt sits near 100% of GDP. Britain faces the most expensive debt servicing among the Group of Ten wealthy countries.
Combine those three facts and the sensitivity becomes mechanical rather than sentimental. At £109 billion of annual interest cost on a debt stock near 100% of GDP, every basis point of sustained additional yield translates into hundreds of millions of extra servicing cost, and that money cannot fund public services. A 50 basis point rise in the yield curve held for a year is a multi-billion pound hole in the Budget arithmetic.
That is why the market prices every fiscal signal instantly. It is also why a currency yielding 4.89% on ten-year paper — the highest in its peer group — trades weaker when that yield rises. The higher yield is not a return; it is the cost of financing a deteriorating position, and it makes the position deteriorate faster.
Growth makes it worse. The official forecast for 2026 GDP was cut to 1.1% from 1.4%, before energy shocks were factored in. Debt-to-GDP falling by the end of a five-year window requires either primary surpluses or nominal growth, and 1.1% real growth with inflation at 2.6% delivers roughly 3.7% nominal — barely enough to stabilise a ratio at 100% with interest costs at 9% of revenue.
The disinflation now underway is the one genuinely helpful development. June CPI at 2.6%, wages at 4.3%, crude down 10% on the week and the 10-year retreating to 4.89% from 5.04% together reduce the interest bill and improve the arithmetic. The largest weekly gilt rally since late 2023 came from exactly that combination.
For the forecast this creates a specific asymmetry. Sterling's upside case is a disinflation-and-credibility trade that compresses the risk premium. Its downside case is a fiscal accident. The first is a grind toward 1.3500 to 1.3591. The second is a gap through 1.3326.
Friday's Payroll Print Is The Only Catalyst
The U.K. calendar is empty. There has been no major domestic data this week and no central bank meeting, which means sterling takes its lead almost entirely from the dollar. The next domestic milestone is September 17.
That leaves Friday's U.S. employment report as the single event capable of resolving the 1.3400-to-1.3500 box. Consensus calls for 80,000 payrolls after 57,000 in June, with the unemployment rate holding at 4.2%, alongside average hourly earnings.
The build-up has been consistently soft. Private payrolls slowed to 44,000 in July from 95,000, a 37% miss against the 70,000 consensus. The services employment component contracted at 47.4 while business activity ran 59.1 and new orders 57.2. Against that, initial claims printed 199,000 against a 202,000 consensus — a fourth straight week under 200,000 — and July job cuts fell 27% to 33,429, the lowest since July 2024, with hiring plans jumping 47% to a four-year high of 16,095.
The scenario map is tight. A payroll print under 50,000 with the unemployment rate at 4.3% or higher pushes September hike odds below 40%, sends the dollar index through 99, and takes cable through 1.3500 toward 1.3591. A print above 120,000 with the rate steady restores two-hike pricing, lifts the index back above 100, and delivers 1.3400 and then 1.3375.
A number near consensus keeps the pair pinned. That is the base case, and it is why institutions appear to be sitting on the sidelines — major players planning large trades typically wait for confirmation from the data, so dollar markets often move at that moment rather than before it. There may be very little point trading this pair before Friday's New York session.
The wider risk is that something surprising happens on the dollar side entirely outside the calendar. A single policy-maker statement shifting rate expectations could render the closely packed technical levels irrelevant for hours. If the U.S. Treasury intervenes again to support the yen by selling dollars, cable could clear 1.3500 without regard for any of the resistance described above.
One data point, 30 pips of technical apparatus, and a currency pair that has gone nowhere for fifteen months.
Thin August Liquidity And Intervention Risk
Two factors could invalidate the entire technical read, and both are seasonal or structural rather than analytical.
The economic calendar has been extremely quiet, with no major releases at all across Wednesday and Thursday on the U.K. side. Volume appears normal for the time of year, but August is a thin month, and thin liquidity means recent price action may carry no information at all. A 240-pip round trip in nine sessions on holiday desks tells you less than the same move in October would.
The intervention channel is the larger consideration. The coordinated Japan-U.S. operation that pulled the yen from near 164 to 155.20 was the first such collaborative action since 1998, and it produced one of the dollar's worst weeks since early April with losses above 1.30%. The yen has since retraced to 157.85, giving back some of those gains. Stretched positioning and direct U.S. involvement were what made the operation effective.
If that intervention repeats — selling dollars to support the yen — cable goes through 1.3500 mechanically, regardless of the double top, the 61.8% retracement or the yearly open at 1.3460 to 1.3474. Currency intervention overwhelms technical levels because it is size without price sensitivity.
The positioning backdrop makes the pair more vulnerable to that kind of shock than usual. With the rate differential at 12.5 basis points there is no carry anchoring positions, which means speculative flow dominates and can reverse without a fundamental trigger. When the differential disappears, sentiment, positioning and political headlines set the price.
The dollar's own structural flows compound it. Foreign selling of long-dated dollar-denominated fixed income last week represented reserve and institutional money reducing dollar exposure at a structural level. That is not a flow that reverses on a payroll print, and it is the reason the index has been unable to reclaim 100 despite a 3.50%-3.75% policy rate and record equity highs.
The honest read: the technical levels are precise and the environment that would respect them is absent. Trade the rejections, size for gaps.
The Trade Into Friday: 1.3500 Or 1.3400
The forecast resolves into a 100-pip box with defined triggers. Cable at 1.3469 sits 31 pips below 1.3500 and 69 pips above 1.3400, with the 50-period and 200-period averages compressed at 1.34440 and 1.34528 directly beneath spot.
The bull path needs sequence. Clear the 1.3460-to-1.3474 confluence of the 61.8% retracement and the yearly open, which has rejected sterling twice. Take 1.3480, which capped the July 31 rally. Break 1.3500 on a closing basis and take out the 1.3520 swing high, which invalidates the recent downtrend and opens 1.3591 and then 1.3648 to 1.3685. That requires a payroll print under 50,000 with the unemployment rate above 4.2%, or a fresh dollar-selling intervention.
The bear path is shorter. Losing 1.3400 exposes 1.3375 where the former descending trend line now acts as support, then the clustered averages at 1.3365. Below that, 1.3326 is the May low close and the 38.2% retracement of the 2025 advance; 1.3289 is the uptrend line; 1.3280 is the July base. A hot payroll number or a fiscal headline delivers that sequence inside two sessions.
The base case is the box. Consensus projections put the pair at 1.3302 by September, 1.3362 by December and 1.3478 by March 2027, with a three-month expectation of 1.3342 — meaning the institutional path has cable lower than spot over the next two quarters before recovering. The rest-of-2026 range is framed at 1.30 to 1.40 with two-sided rather than directional risk, and the weekly band ran 1.32 to 1.36.
Position sizing should respect what is actually driving this. Bank Rate at 3.75% against a 3.50%-3.75% Fed range is a 12.5 basis point differential — no carry, no anchor. Every pip from 1.3280 to 1.3469 came from a dollar index falling to 99.65 on intervention, foreign bond selling and hike odds dropping from 67% to 48%. The 10-year gilt at 4.89% is a risk premium rather than a return, and the autumn Budget is an unresolved fiscal tail.
Base case into month-end: range 1.3400 to 1.3500, targeting 1.3591 on a confirmed break of 1.3520, with invalidation on a daily close below 1.3400. Fifteen months sideways. Friday decides the next month.