USD/JPY Bounces Off 200-Day Average at 158.80; Rate Gap Puts a 160.20 Retest Back on the Table
USD/JPY holds the 200-day at 158.80; a reclaim of 159.61 opens 160.20 | That’s TradingNEWS
USD/JPY trades at 159.24 on Tuesday afternoon in London, down 0.15% from Monday’s close at 159.47. The session opened at 159.41, pushed to 159.61 early in Tokyo, and then rolled over as Asian and European equities sold off. The low came at 158.87 in early London trade, a four-day low, before buyers stepped in at the 200-day simple moving average near 158.80 and pushed the pair back above 159.00.
The move was a yen story rather than a dollar story. The dollar index set a new year-to-date high of 103.698 in the Tokyo morning and then held near 103.55, while EUR/USD and GBP/USD traded in narrow ranges. The yen crosses carried the selling. EUR/JPY dropped to 174.91 and GBP/JPY to 209.73, both extending their declines as risk-off demand for the Japanese currency built through the European morning.
The pair is coming off a week that tested Tokyo’s patience. On Friday, November 13, USD/JPY reached 160.19, the weakest level for the yen since September 2. Over the five sessions to Monday, the pair gained 1.06%.
The thesis for this forecast is narrow. The 160.00 line is a hard ceiling built from intervention memory, not from economics. Japan spent ¥27.13 trillion defending the yen across six days in 2026, twice acting with USD/JPY above 160.00. Below the ceiling, the rate gap keeps the floor firm: the US two-year yield at 4.83% sits 2.96 percentage points above Japan’s 1.87%, and that carry does not disappear in one risk-off session. Today’s drop to the 200-day average is the test of whether that carry bid still holds. If it does, the pair rebuilds toward a retest of the 160.19 high, with an upside target of 160.20. If 158.80 breaks on a closing basis, the risk-off move has turned into a trend change.
The levels define the trade. Support sits at 158.95, the 100-day simple moving average, then 158.87, today’s low, and 158.80, the 200-day average. Below that, 158.60 and 158.30, the middle of the 20-day Bollinger Band, come next. Resistance sits at 159.36, Monday’s low, then 159.61, today’s high, then 160.00, 160.12 at the upper Bollinger Band and 160.19 at Friday’s high. The upside target is 160.20, a move of 96 pips, or 0.6%, from 159.24.
The calendar is crowded. US October retail sales came in this morning with the headline at +0.2% and the control group at +0.6%, above the 0.4% forecast. Nvidia reports after the US close tonight. The Federal Reserve minutes arrive Wednesday. Japan’s October national CPI lands Friday at 08:30 Tokyo time.
The 160.19 High and the Tokyo Warning Ladder
Last week’s run to 160.19 triggered the familiar escalation from Japan’s finance ministry. The sequence matters because it is the only reliable guide to how near Tokyo is to acting.
On Thursday, November 12, vice finance minister for international affairs Atsushi Mimura said recent currency moves, including those of the past few days, were too rapid. He added that it was too early for markets to forget the summer’s intervention. The yen barely moved on his comments.
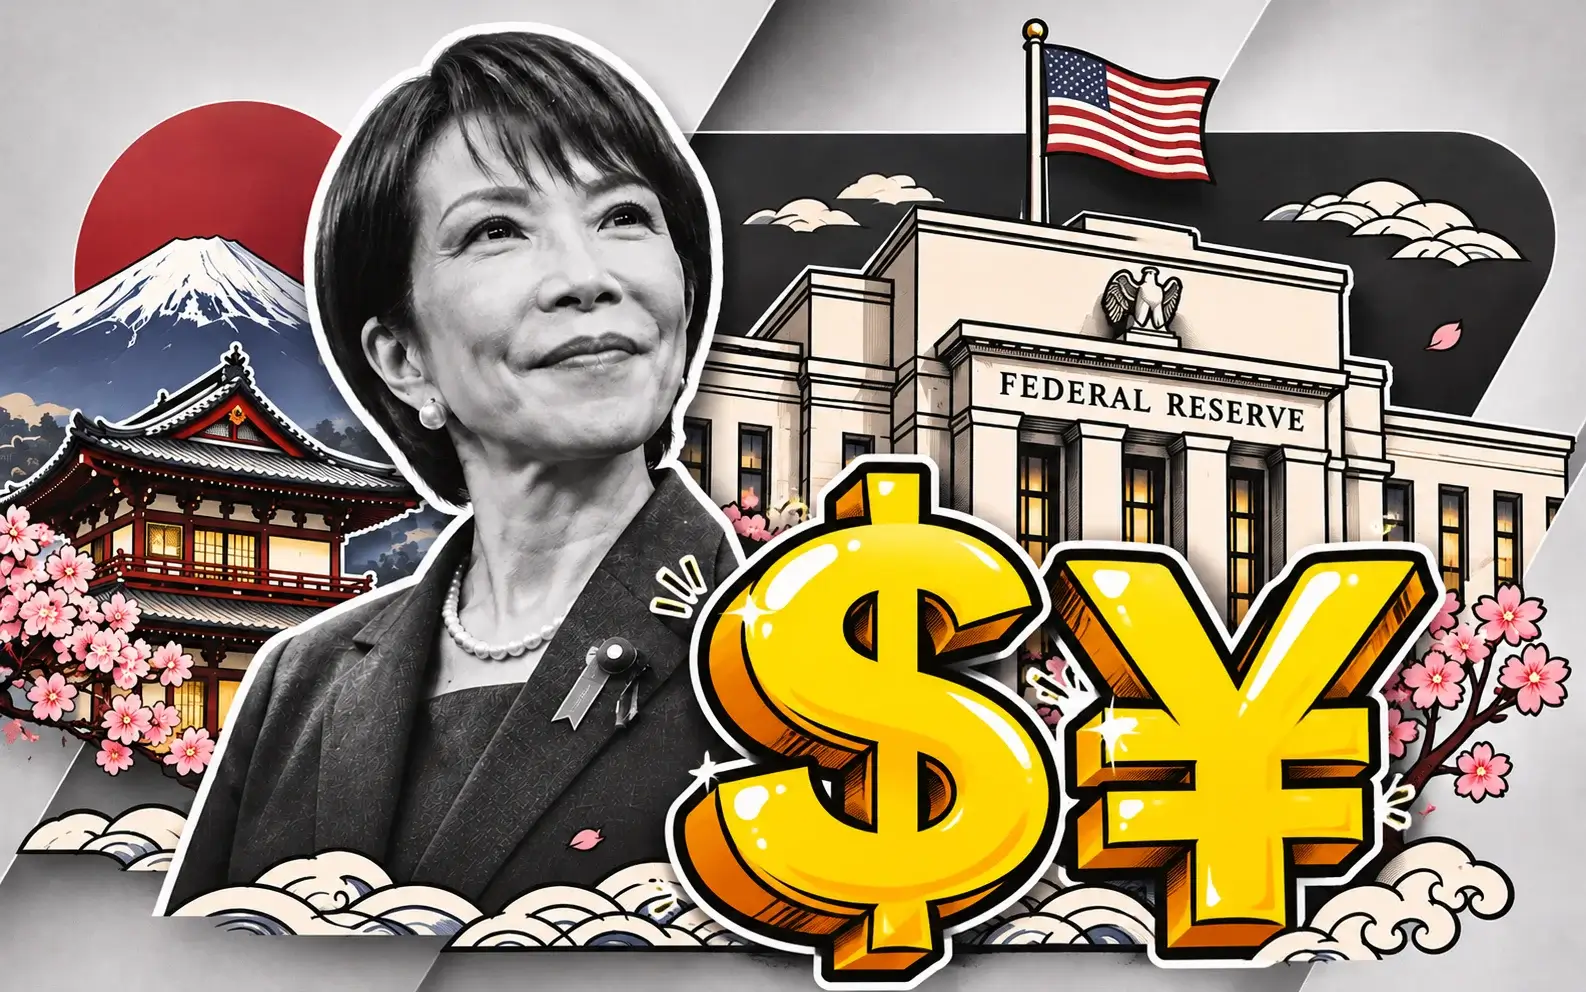
On Friday, November 13, Finance Minister Satsuki Katayama renewed the warning as the yen briefly crossed 160 per dollar. She said she was seeing one-sided and rapid moves in currency markets, that Japan would stay in close contact with the US Treasury, and that the government would respond appropriately to excessive and rapid movements. Earlier in the month, she had said the joint foreign exchange statement with the United States remained in effect, and noted that Prime Minister Sanae Takaichi had called the yen’s undervaluation problematic.
The wording is the signal. Officials move through stages, from watching the market, to calling moves rapid, to calling them excessive or speculative, to rate checks, and finally to intervention. As of Friday, the language sits at the “rapid” and “respond appropriately” stage. That is a step below the language used in the days before the July and August operations. There has been no confirmed intervention in November.
The reference to the US Treasury carries weight. Tokyo’s insistence that it is in contact with Washington is a signal that any intervention would not draw objections from the United States. That removes one of the political obstacles to acting, and it makes the threat more credible at 160.00.
The warning ladder explains why USD/JPY stalled near 160.00 for three sessions last week despite rising US yields and climbing Fed hike odds. The repeated dips to 159.33 to 159.36 on Monday and early Tuesday were bought each time, showing that the market still wants to own dollars against the yen, but not at any price above 160.00.
The ministry publishes its monthly intervention total at the end of each month, with the November figure due on November 30. That report will confirm whether Tokyo acted secretly in the past two weeks.
For the forecast, the warning ladder sets a practical ceiling. A move to 160.20, one pip above Friday’s high, is within reach without crossing into the territory where Tokyo has acted. A sustained push above 160.50 would trigger stronger language, and a run toward 161.00 would put the pair in the zone where the spring operation began.
Intervention Math: ¥27.13 Trillion in 2026 and the 157 to 164 Zone
Japan’s record this year shows how far it is willing to go. Through October 28, the finance ministry spent ¥27.13 trillion across six days of yen buying in 2026. That compares with zero operations in 2025.
The spring episode came at a level that matters for today’s trade. On April 30, Tokyo sold dollars worth ¥6.28 trillion, driving USD/JPY from 160.23 to 156.66. It followed up on May 4 with ¥0.78 trillion, when the pair moved from 156.76 to 157.21, and on May 6 with ¥4.68 trillion, taking it from 157.68 to 156.44. The spring total came to ¥11.73 trillion over three days.
The summer episode was larger. On July 30, Japan spent ¥7.98 trillion as USD/JPY dropped from 163.86 to 159.47. On July 31, it added ¥5.55 trillion with the pair near 159.16, and on August 3, it spent ¥1.87 trillion, pushing the rate from 159.16 to 156.96. The three-day total of ¥15.40 trillion was a record for a single period. The post-intervention low came at 155.23 on August 3.
Earlier operations set the pattern. In 2024, Japan spent ¥15.32 trillion over four days, acting at 157.62 in April and at 161.73 in July. In the autumn of 2022, it spent ¥9.19 trillion over three days, with action at 144.14 and 149.82.
The levels show a zone rather than a line. In 2024 and 2026, Japan acted with USD/JPY between 157 and 164. The ministry never names a specific level, and officials have said they have no specific number in mind. But the spring 2026 operation at 160.23 sits just 4 pips above last Friday’s 160.19 high, which is why traders treat 160.00 as the trigger zone.
The size of each operation also matters. A single day of ¥7.98 trillion moved the rate by 439 pips. If Tokyo acted at 160.20, a similar operation would take the pair toward 155.80, below the August post-intervention low.
There is a cost to the ceiling for the bears too. Each intervention in 2026 failed to change the trend. After the August operation took the pair to 155.23, it climbed back to 160.19 in just over three months. Intervention buys time, but it does not close the rate gap that drives the pair higher.
For the forecast, the intervention record caps upside at 160.20 for this week. The risk-reward of buying above 160.00 is poor, because a single operation could erase 400 pips in a session. The trade is to buy dips below 159.00, not to chase strength above 160.00.
The Rate Gap: 2.96 Points on Two-Year Yields
The floor under USD/JPY is the interest rate gap. The US two-year Treasury yield stands at 4.83%, against 1.87% for Japan’s two-year government bond. That 2.96 percentage point spread is what makes holding dollars against yen profitable, and it is why every dip has been bought this year.
The longer end shows the same picture. The US 10-year yield sits at 5.12%, near a one-month high, while Japan’s 10-year yield rose 3 basis points to 2.89% on Monday. That leaves a 10-year spread of 2.23 percentage points. Japanese long yields have climbed sharply this year as the Bank of Japan raised rates, but US yields have climbed faster.
The policy rate gap is wider. The Federal Reserve’s target range sits at 3.75% to 4.00% after its September hike. The Bank of Japan’s policy rate stands at 1.25%. The gap between the two runs from 2.50 to 2.75 percentage points.
December decides where the gap goes next. If the Fed hikes 25 basis points on December 9 and the Bank of Japan hikes 25 basis points on December 18, the gap stays the same. Both moves are mostly priced. The question for USD/JPY is whether one central bank surprises.
The carry math is simple. An investor borrowing yen at Japan’s short-term rate and holding dollars at the US rate earns the spread every day the exchange rate holds steady. With a policy gap of at least 2.50 percentage points, a holder of a ¥100 million position earns more than ¥2.5 million a year in carry before any currency move. That income is what draws buyers back into the pair after every intervention.
The gap also explains the pattern of 2026. The Bank of Japan raised rates in June and September, and the yen still weakened. Each Japanese hike was matched or exceeded by moves in US rate expectations. With the Fed now hiking again, the yen has lost the support that a narrowing gap would provide.
The spread has narrowed at the margin. Japan’s two-year yield near 1.88% reflects market pricing for further BoJ hikes into 2027. If those hikes arrive faster than expected, the two-year spread could compress toward 2.50 percentage points, which would weaken the carry bid.
For the forecast, the 2.96 percentage point two-year spread is the reason the 200-day average at 158.80 held today. As long as the spread stays above 2.75 percentage points, carry demand will absorb risk-off selling. A drop below 2.50 percentage points, from a Fed pause signal or a hawkish BoJ surprise, would remove the floor and put 156.45 in play.
The Fed Side: 97.4% December Hike Odds and Retail Sales
The US side of the pair is pushing higher. Fed funds futures price a 97.4% probability of another 25 basis point hike in December, which would lift the target range to 4.00% to 4.25%. The FOMC meets on December 8 and 9.
This morning’s retail sales report kept that path intact. Headline October retail sales rose 0.2%, in line with expectations. The control group, which feeds directly into GDP, rose 0.6% against a 0.4% forecast. Sales excluding autos also rose 0.6%. Consumer spending running hotter than expected supports the case for a December hike and keeps two-year yields elevated.
The inflation data that drove the hike pricing came earlier. US core inflation rose 0.3% in October, above the 0.2% forecast. That print pushed hike odds higher and drove the two legs of the November 10 to 11 rally in USD/JPY.
Fed officials have added to the hawkish tone. Cleveland Fed President Beth Hammack said a larger rate increase may be needed if inflation pressures worsen. That kind of language keeps the market from pricing a quick pause after December, which supports the dollar against low-yielding currencies.
The speaking calendar is busy today. St. Louis Fed President Alberto Musalem speaks at 12:30 London time, Governor Christopher Waller at 14:10, Hammack again at 14:30 and New York Fed President John Williams at 19:25. Any official who hints at a pause after December would weigh on the dollar.
Wednesday’s FOMC minutes are the next major test. Minutes that show broad support for further tightening would push two-year yields higher and lift USD/JPY back toward 159.61. Minutes that show debate over pausing after December would trim hike pricing for 2027 and give the yen room to extend today’s gains below 158.80.
The dollar index provides context. At 103.698, the index set a fresh year-to-date high this morning, its highest level since April 2025. A strong dollar across the board means USD/JPY is not rising on yen weakness alone. That makes the pair more resilient to Japan-specific news.
For the forecast, the Fed side remains the engine of the uptrend. With hike odds at 97.4% and retail sales beating, the US contribution to the rate gap is not shrinking. The path to 160.20 runs through hawkish FOMC minutes and continued strong US data. A dovish surprise is the main risk to the target.
The BoJ Side: 1.25%, a Dissent for 1.50% and December 18
The Bank of Japan is moving toward another hike, but slowly enough that it has not changed the yen’s direction. The BoJ held its policy rate at 1.25% on October 30 by an 8 to 1 vote, with board member Hajime Takata dissenting in favor of a hike to 1.50%. The bank raised rates in June and September of 2026.
The signals since October point to December. Governor Kazuo Ueda indicated after the October meeting that there was a chance for another hike in December. The summary of opinions released on November 10 showed many board members see a near-term hike as necessary. One member said the bank should decide on the next hike when possible without becoming overly cautious. A survey after the October meeting found 83% of economists expected the BoJ to raise its rate to 1.50% in December.
Takata has continued to push. On November 16, he again called for faster moves toward a neutral rate, which briefly supported the yen. The BoJ’s chief economist Seisaku Kameda said a December hike was likely and that rates could continue rising toward 2% next year.
Former governor Haruhiko Kuroda added a new variable today. He said the BoJ may need to raise its policy rate above the neutral level if inflation pressures intensify, warning of imported inflation from the Iran conflict and criticizing a ¥10 trillion food tax cut plan. Kuroda’s comments helped push USD/JPY to a four-day low during Asian trading. Japan’s two-year yield sits near 1.88%, reflecting market pricing for the December move.
The bank’s own forecasts support further tightening. In October, the BoJ projected core CPI at 2.5% for fiscal 2026, 2.6% for fiscal 2027 and 2.0% for fiscal 2028.
The problem for yen bulls is that a December hike is already priced. Traders fully expect a move to 1.50% on December 18 and further increases in the first quarter of 2027. A hike that arrives on schedule will not lift the yen, because the market has already discounted it.
The BoJ meets on December 17 and 18, nine days after the Fed. That sequencing means the Fed moves first. If the Fed hikes and signals more, the BoJ’s hike nine days later will be playing catch-up.
For the forecast, the BoJ is a slow-moving support for the yen that does not threaten the 160.20 target this week. A December hike to 1.50% is the base case and is priced. Only a surprise, such as a signal of 50 basis points or a faster path toward 2%, would push USD/JPY decisively below 158.80.
Japan’s Economy: Q3 GDP Contraction and Friday’s CPI
Japan’s data this week has made the BoJ’s job harder. The first preliminary estimate of third-quarter GDP, released on Monday, showed real output fell 0.02% from the prior quarter, or 0.1% at an annualized rate. It was the first contraction in four quarters, and it missed a consensus that called for growth of 0.2% to 0.3% annualized. The second quarter was revised to growth of 0.4%.
The details were mixed. Private consumption fell 0.3% from the prior quarter, the same drop as in the second quarter, and declined 1.1% at an annualized rate. Business investment rose 1.6%, or 6.8% annualized, after a 0.4% decline in the second quarter. Housing investment and public investment each fell 1.1%. Exports dropped 0.2%, while imports jumped 2.5%. Net exports subtracted 0.6 percentage points from growth.
Nominal GDP rose 0.4% from the prior quarter, or 1.6% annualized. The GDP deflator rose 2.4% from a year earlier, below the 2.6% forecast.
The contraction did not derail December hike expectations. Markets still fully price a December hike, because strong corporate investment and improving real wages offset the weakness in consumer spending. The contraction is small enough to be revised away. The second preliminary estimate is due on December 8, ten days before the BoJ decision.
Friday’s CPI report is the bigger test. October national CPI is due at 08:30 Tokyo time on Friday, November 20. Core inflation excluding fresh food is forecast at 2.3%, up from 2.1% in September. September’s reading had itself risen from 1.7% in August. An acceleration to 2.3% or higher would strengthen the case for a December hike.
The price pipeline points higher. Japan’s wholesale prices rose 7.1% from a year earlier in October. Producer prices running at that pace feed into consumer prices with a lag, which supports the view that core CPI will keep rising into 2027. Imported energy costs tied to the Iran war are a large part of the wholesale increase.
The weak consumer is the tension. With private consumption falling for two straight quarters, the government is pursuing support measures, including the proposed ¥10 trillion food tax cut. Fiscal support aimed at households while the BoJ tightens creates a mixed policy signal.
For the forecast, Friday’s CPI is the main Japan-side risk to the 160.20 target. A core reading above 2.3% would reinforce December hike expectations and could push USD/JPY back toward 158.80. A reading below 2.1% would weaken the hike case and give the pair room to retest 160.19 before the weekend.
Risk-Off Flows: Nikkei Down 2.42% and the Nvidia Test
Today’s yen strength is a risk-off trade. The Nikkei 225 fell 2.42%, or 1,480.33 points, to 59,662.02 on Monday, and Asian markets extended losses on Tuesday. When equities fall, Japanese investors repatriate funds and global investors cut yen-funded carry positions. Both flows buy yen.
The equity selloff is global. On Monday, the Nasdaq Composite fell 2.49% into correction territory, the S&P 500 dropped 1.92% to 7,416.59, and the Dow closed at 51,608.17. European equities and US stock futures declined on Tuesday after Asian markets, which strengthened risk-off demand for the yen through the London morning.
The crosses confirm the flow. EUR/JPY fell to 174.91 and GBP/JPY to 209.73, both lower on the day while EUR/USD and GBP/USD held steady. When yen crosses lead USD/JPY lower and dollar pairs stay flat, the move is driven by yen buying rather than dollar selling. Fresh lows in the crosses would signal that yen buying is continuing.
Positioning makes the flow sharper. Speculators held a net long position in the yen in the week ended November 3, according to the most recent futures data. That is unusual for a currency trading near 160 per dollar, and it reflects bets on intervention and BoJ hikes. Those longs add to yen buying on risk-off days.
Tonight’s Nvidia report is the key event for risk sentiment. The chipmaker reports third-quarter fiscal 2027 results after the US close, with consensus calling for $109.15 billion in revenue and $2.47 in earnings per share. Options price an 8% move. Jensen Huang’s resignation on November 12, with Colette Kress serving as interim CEO, has added uncertainty to the print.
The transmission to USD/JPY runs through Asian trading. A strong Nvidia report would lift US futures and Asian semiconductor stocks overnight, reduce risk-off demand for the yen, and push USD/JPY back toward 159.61. A weak report would extend the equity selloff into Wednesday’s Tokyo session and push the pair below the 200-day average at 158.80.
For the forecast, risk sentiment is the main short-term driver this week, ahead of the rate gap. As long as equities are falling, the yen will catch a bid regardless of yields. The path to 160.20 requires equities to stabilize first, which makes tonight’s Nvidia report the first real test of the target.
Oil, Trade and the Imported Inflation Channel
Energy prices link directly to the yen. Japan imports almost all of its oil and gas, so energy costs drive its trade balance and the demand for dollars from Japanese importers. Lower oil prices prompted dollar selling in Tokyo on Tuesday morning, adding to the yen’s gains.
Oil has dropped sharply this week. Brent crude trades at $92.61 and WTI at $85.73 after the International Energy Agency flagged the first global oil surplus since the Iran war began. On Monday, December WTI fell 3.21%. Each dollar off the oil price reduces Japan’s import bill and the dollar demand that comes with it.
The trade data shows how heavy that bill has become. In the third quarter, imports rose 2.5% while exports fell 0.2%, and net exports subtracted 0.6 percentage points from GDP. Higher energy import costs since the start of the Iran war have kept Japan’s trade balance under pressure, which has been a steady source of yen selling throughout 2026.
The inflation channel works the other way. Imported energy costs are the main driver of Japan’s 7.1% wholesale inflation. Kuroda warned today of imported inflation from the Iran conflict, saying the BoJ may need to raise rates above neutral if those pressures intensify. Higher oil therefore weakens the yen through the trade channel but strengthens the case for BoJ hikes through the inflation channel.
For USD/JPY, the trade channel usually dominates in the short term. Importers buy dollars every day to pay for energy, while the BoJ response to inflation takes months. A sustained fall in oil prices would reduce that daily dollar demand and support the yen. A rebound in oil above $95 Brent would add to dollar demand and push USD/JPY back toward 160.00.
The Strait of Hormuz remains a risk. Any escalation that threatened shipping through the strait would push oil sharply higher, weaken Japan’s trade balance and lift USD/JPY. Diplomatic progress that lowered oil further would do the opposite.
For the forecast, falling oil is a modest support for the yen this week. The drop in Brent from recent highs helped push USD/JPY to 158.87 today. It is not large enough on its own to break the 200-day average, but combined with risk-off flows, it explains why the pair failed at 159.61.
Read More
-
Yen Stalls at 160 Despite a 3% JGB and Tokyo Core CPI at 2.0% — Intervention Sits at 164, Friday's Payrolls Decide
02.09.2026 · TradingNEWS ArchiveEnergy
-
IVV ETF Holds $741.69 at a Three-Year Low Multiple; a $753.14 Reclaim Opens a $757.65 Target
17.11.2026 · TradingNEWS ArchiveStocks
-
IBIT ETF Holds $36.52 as BlackRock Ends $2.35B Outflow Run; a $38.94 Reclaim Opens a $41.30 Target
17.11.2026 · TradingNEWS ArchiveCrypto
-
December Natural Gas Holds $3.103 as Record 21.8 Bcf/d LNG Meets Warm Weather; $3.40 in Play
17.11.2026 · TradingNEWS ArchiveCommodities
-
GBP/USD Holds 1.3190 Above 2026 Low as UK Jobless Rate Hits 4.6%; 1.3252 Break Opens 1.3300
17.11.2026 · TradingNEWS ArchiveForex
Technical Map: 158.80 Floor, 160.00 Ceiling, 160.20 Target
The USD/JPY chart shows a pair in a long-term uptrend that has paused below its intervention ceiling. On the weekly chart, the pair continues to trade inside a multi-year ascending channel that has held since mid-2022, sitting above the channel’s middle line after bouncing off the 38.2% Fibonacci retracement.
The daily structure is clear. The 200-day simple moving average sits near 158.80, and today’s low of 158.87 tested it. The 100-day average sits at 158.95. Both averages are rising, which confirms the longer-term uptrend. The 20-day Bollinger Band middle line sits at 158.30, with the upper band at 160.12 and the lower band at 156.45. The daily relative strength index stood at 62.19 before today’s pullback, below the overbought threshold of 70.
Support is layered tightly. The first level is 158.95, the 100-day average. Below that, 158.87 is today’s low and 158.80 is the 200-day average. A daily close below 158.80 would break the long-term trend support. Below that, 158.60 and 158.30, the middle Bollinger Band, come next, followed by 157.00 and 156.45, the lower band. The August post-intervention low at 155.23 is the floor of the entire move.
Resistance is equally clear. The first level is 159.30, the early London rebound high. Above that, 159.36 is Monday’s low and the level where dips were bought repeatedly on Monday and early Tuesday. Today’s high of 159.61 is next, followed by 160.00, the round number and intervention line. The upper Bollinger Band sits at 160.12, and Friday’s high at 160.19 is the top of the range. Above that, 160.23 marks the spring intervention level, and 160.90 is the next technical resistance.
The upside target of 160.20 sits one pip above Friday’s high. Reaching it requires the pair to hold 158.80 on a closing basis, reclaim 159.36 and then break 159.61.
Historical year-end levels provide context. USD/JPY closed 2024 at 157.36 and 2025 at 156.86. At 159.24, the pair is up 1.5% for 2026, despite two intervention episodes totaling ¥27.13 trillion and two BoJ hikes.
For the forecast, the 200-day average at 158.80 is the line that matters. A daily close above it keeps the uptrend intact and opens 159.61, 160.00 and the 160.20 target. A daily close below it would signal that risk-off flows and BoJ expectations have overpowered the rate gap, opening 158.30 and 157.00.
That's TradingNEWS
Bear Case: A Close Below 158.80 Opens 158.30, 157.00 and 156.45
The bear case requires risk-off flows to persist and the rate gap to narrow. A weak Nvidia report extends the equity selloff, dovish FOMC minutes trim Fed hike pricing, and Japan’s CPI comes in hot enough to raise expectations for faster BoJ hikes.
The trigger sequence could start tonight. A miss from Nvidia would push US futures and Asian equities lower in Wednesday’s Tokyo session. Japanese investors would repatriate funds, and carry traders would cut positions. USD/JPY would break below the 200-day average at 158.80.
From there, the middle Bollinger Band at 158.30 becomes the target. Below that, 157.00 is the next support, with 156.45 at the lower band. A move to 156.45 would represent a 1.8% decline from the current price, or 279 pips.
The Fed minutes on Wednesday could add pressure. If the minutes show that several officials favor pausing after December, two-year yields would fall and the rate gap would narrow. With the gap at 2.96 percentage points on two-year yields, a 20 basis point drop in US yields would cut the carry advantage noticeably.
Friday’s Japan CPI could deliver the final push. A core reading above 2.5%, well above the 2.3% forecast, would raise expectations for a larger BoJ move in December or faster hikes in early 2027. Japanese two-year yields would rise toward 2%, compressing the spread from the other side.
Intervention is the tail risk that makes the bear case faster. If USD/JPY were to spike back toward 160.00 on strong US data and then reverse, Tokyo could step in on the reversal to accelerate the move. A single operation on the scale of July 30, when ¥7.98 trillion moved the pair 439 pips, would take the rate from 160.00 to below 156.00 in one session.
The yen’s positioning supports the bear case. Speculators were net long the yen as of November 3, and more longs would join on a break below 158.80. That would add momentum to the decline.
The probability of a test of 158.80 this week is high, given that the pair touched 158.87 today. The probability of a sustained break below 158.30 is lower, because the rate gap keeps carry demand alive and the Fed is still hiking. The most likely bearish outcome is a retest of 158.60 to 158.80 that holds.
For the forecast, the bear case target is 157.00 on a daily close below 158.30, with 156.45 and 155.23 as the extensions. The near-term bearish target on a weak Nvidia print is 158.60.
Bull Case: Hold 158.80, Reclaim 159.61, Then 160.20
The bull case rests on the rate gap and the strength of US data. With two-year yields 2.96 percentage points apart and Fed hike odds at 97.4%, the fundamentals favor the dollar. Today’s drop is a risk-off flush that the carry bid can absorb.
The first step is already in progress. The pair bounced from 158.87 to 159.24 after testing the 200-day average. A daily close above 158.95, the 100-day average, would confirm that the long-term moving averages held as support.
The second step is reclaiming 159.36 and then 159.61. Monday’s low at 159.36 acted as support for two sessions before giving way, and today’s high at 159.61 marks the level where the selling began. A move through 159.61 would erase today’s risk-off decline.
The third step is the approach to 160.00. The pair stalled near 160.00 for three sessions last week. A second approach would test the intervention line again. The upper Bollinger Band at 160.12 and Friday’s high at 160.19 sit just above.
The final step is the 160.20 target. A move from 159.24 to 160.20 is 96 pips, or 0.6%. It would set a marginal new high for the move, one pip above Friday’s level, without breaking deep into the zone where Tokyo has acted.
The catalysts are lined up. A strong Nvidia report tonight would lift equities and reduce risk-off demand for the yen. Hawkish FOMC minutes on Wednesday would push two-year yields higher. Strong US data from today’s retail sales and upcoming releases would support Fed hike pricing. A soft Japan CPI on Friday, below 2.1%, would weaken the BoJ hike case.
The dollar’s broad strength adds support. With the dollar index at a year-to-date high of 103.698, USD/JPY is benefiting from dollar demand across currency markets, not just yen weakness.
The constraint is Tokyo. Every move toward 160.00 brings stronger warnings, and the warnings intensify as the pair rises. The bull case does not require a break far above 160.00. It requires only a retest of the 160.19 high, which keeps the pair below the 160.23 level where spring intervention began.
For the forecast, the bull case is the more likely path this week if equities stabilize. The rate gap has absorbed every risk-off move in 2026, and the 200-day average has held. A retest of 160.20 by Friday’s CPI is the base case for buyers.
USD/JPY Price Forecast Verdict: Range 158.80 to 160.00, Upside Target 160.20
USD/JPY enters the Nvidia print at 159.24, down 0.15% on the day after a risk-off drop from 159.61 to 158.87 tested the 200-day simple moving average at 158.80. The pair set a high of 160.19 on November 13, the weakest yen since September 2, and gained 1.06% in the five sessions to Monday before Tokyo’s warnings and the equity selloff pulled it back. At 159.24, the pair is up 1.5% for 2026 from its 156.86 close in 2025.
The forces holding the floor are clear. The US two-year yield at 4.83% sits 2.96 percentage points above Japan’s 1.87%. The Fed funds rate at 3.75% to 4.00% sits at least 2.50 percentage points above the BoJ’s 1.25%. Fed hike odds stand at 97.4% for December, and October retail sales control rose 0.6% against a 0.4% forecast. The dollar index hit a year-to-date high of 103.698 this morning.
The forces capping the rally are just as clear. Japan spent ¥27.13 trillion in six days of intervention in 2026, including ¥6.28 trillion at 160.23 in April and ¥7.98 trillion at 163.86 in July. Mimura and Katayama have warned of rapid and one-sided moves and promised to coordinate with the US Treasury. The BoJ is on track to hike to 1.50% on December 18, with Kuroda warning rates may need to exceed neutral. The Nikkei fell 2.42% on Monday, and risk-off demand is lifting the yen.
The verdict is neutral with a constructive bias. Expect USD/JPY to trade between 158.80 and 160.00 through Friday’s Japan CPI, with tonight’s Nvidia report and Wednesday’s FOMC minutes setting the direction. A strong Nvidia print, hawkish minutes and a core CPI at or below 2.1% would lift the pair through 159.61 and open a retest of 160.00 and the 160.20 upside target. A weak Nvidia reaction, dovish minutes and a core CPI above 2.5% would break the 200-day average and open 158.30 and 157.00. With the rate gap intact and the 200-day average holding on the first test, the risk-reward favors buyers on dips into 158.80 to 158.95, with a stop below 158.30 and 160.20 as the target, while any move above 160.00 carries intervention risk that argues for taking profits rather than adding.