WTI Sheds 10% in 2 Sessions to $75.88 as Brent Gives Back a Third of Its 24% July Rally
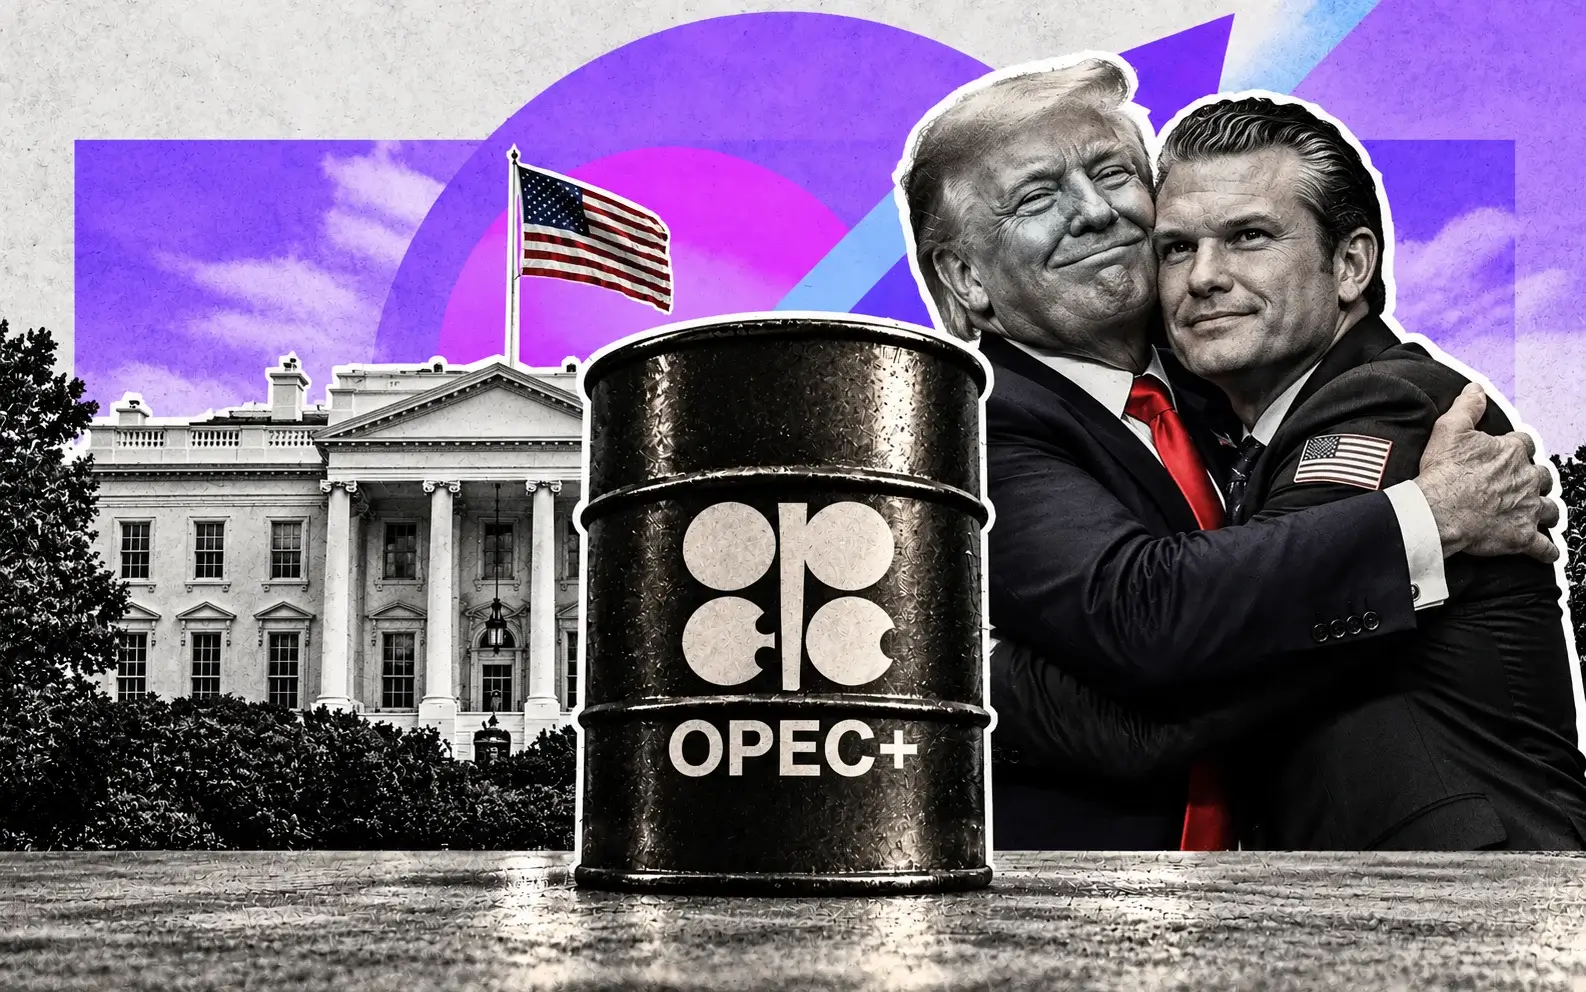
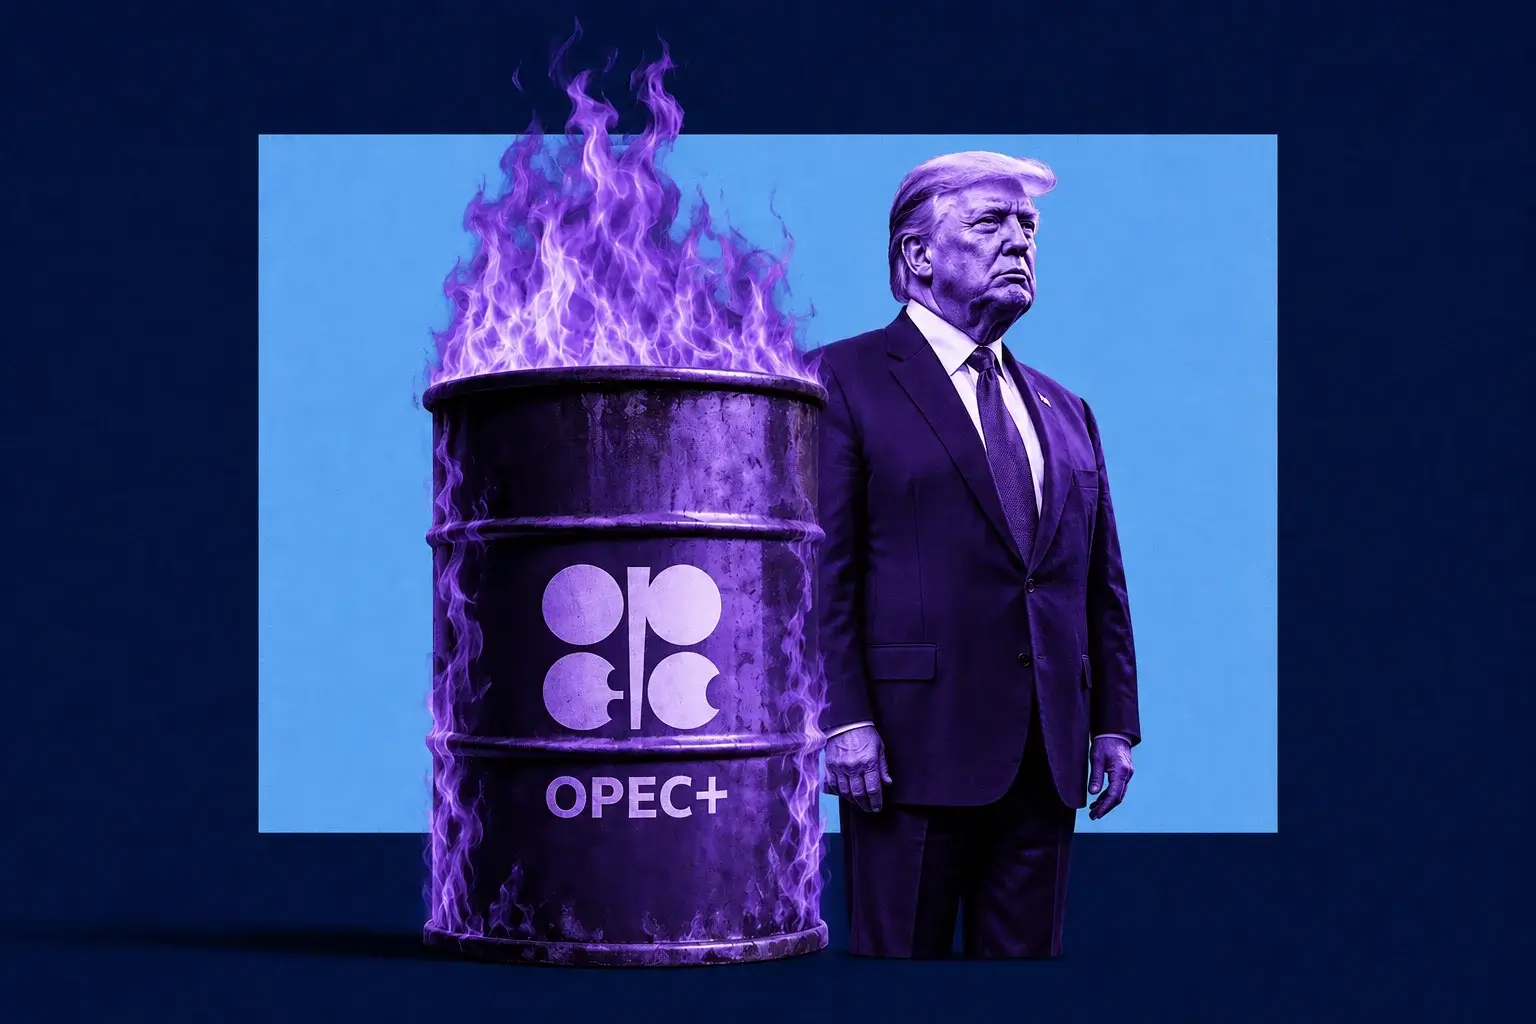
OPEC+ completed the rollback of 1.65 million bpd of 2023 cuts with a sixth straight 188,000 bpd increase | That's TradingNEWS
Key Points
- WTI fell $4.46 to $75.88, a 5.55% drop, after Monday's 5% slide to $80.34.
- Brent broke below $80 after settling at $83.77 Monday, erasing a third of July's 24% gain.
- OPEC+ raised September quotas by 188,000 bpd, completing the 1.65 million bpd restoration.
West Texas Intermediate traded $75.88 on Tuesday, down $4.46 or 5.55%, with intraday prints around $76.99 for a 4.2% decline depending on the timestamp. That follows Monday's settlement at $80.34, itself a drop of roughly 5% on the session. Two trading days have stripped nearly $9 from the U.S. benchmark — a 10.4% decline from Friday's $84.67 close.
Brent fell more than 4% and broke below $80, reversing an early advance. The international benchmark settled Monday at $83.77 after a 4.7% loss, having closed Friday near $88. The two-session move measures roughly 9% and takes the contract back to levels last seen in mid-July.
The trigger was diplomatic rather than fundamental. Washington called off a planned strike on Iran after receiving a request from Tehran and other regional governments, with the stated framing that the perimeters of a deal had been agreed. Optimism built through Tuesday that an agreement to reopen the Strait of Hormuz could land within 24 to 48 hours, and the market priced the removal of the war premium immediately.
That premium is the entire story of crude in 2026. Dated Brent traded above $140 in March — the highest since 2008 — after the conflict began on February 28 and effectively closed the strait. Prices collapsed to $69.23 on WTI and $71.99 on Brent by late June following a June 18 memorandum of understanding, with WTI printing below $70 for the first time since February 27. They then rebuilt through July as hostilities resumed, delivering a Brent gain of nearly 24% for the month — its strongest since March — before this week's unwind.
Equity markets read the move as an energy-specific event rather than a macro one. The S&P 500 cleared its June 2 record close of 7,609.78 on the same session energy sank 2.5% as the worst-performing sector, while information technology gained 2.4%. That 490 basis point spread describes a market treating falling crude as disinflationary rather than as a demand signal.
The near-term structure is binary and unhedgeable. A signed agreement takes WTI toward $70 and Brent toward $74. A collapse in talks rebuilds the premium within days. Nothing in between produces a durable trend, which is why the contract has swung 10% in two sessions on a headline rather than on a barrel.
The "Last Chance" Framing Is The Whole Trade
Public rhetoric from Washington escalated even as the strike was suspended, framing the current window as a final opportunity before military action resumes. The language delivered Monday was explicit about decapitation as the alternative and about a resolution arriving "today or tomorrow, one way or the other." A senior Treasury official put the odds of a deal to open the strait at a genuine chance within the same 48-hour window.
Tehran's response complicated the read. Iran denied that direct talks with Washington were underway while acknowledging that discussions conducted through Oman were making progress toward improving shipping through the waterway. That denial, delivered alongside a Western claim of an agreed framework, produced visible frustration in Washington and characterizations of the counterparty as unreliable.
The market has been through this cycle repeatedly. A June 18 memorandum was signed to end the conflict and open the strait. Traffic resumed. Flows returned to near pre-war levels with at least 20 million barrels exiting in a single 24-hour window, though full normalization required weeks of mine clearance. Then talks scheduled in Switzerland were abruptly called off. Then strikes resumed in early July. Then a naval blockade was reimposed and lifted. Then a proposed transit toll was abandoned after shipping industry opposition and a determination that mandatory tolls in the strait are illegal under international maritime law.
Each cycle has produced a 15% to 25% price swing. The July escalation delivered Brent from below $70 to near $88. This week's de-escalation has taken roughly $8 back out in two sessions.
The structural read from the shipping side is that the disruption which pushed prices above $120 is over, with the conditional reopening, the lifting of force majeure declarations by Kuwait and the end of the naval blockade collectively convincing traders that the acute phase has passed. The counterpoint is that renewed exchanges of fire in the Gulf highlight the risk of not reaching a lasting settlement, which remains a precondition for normalization.
Nothing about the current setup allows a directional position without headline exposure. The trade is not long or short crude. It is long or short the probability of a signature, and that probability has moved from roughly even to materially higher inside 72 hours.
Brent Gave Back A Third Of Its 24% July In Two Days
Brent's July performance was the strongest monthly gain since March at nearly 24%, driven by escalating tensions and supply concerns rather than by demand. Iran claimed attacks on two tankers transiting the strait under U.S. military escort, though Western maritime authorities never confirmed the incident. Houthi attacks in the Red Sea and strikes on Iran-backed groups compounded route risk, while attacks near Russia's Black Sea export infrastructure added a second theater.
Falling U.S. crude inventories provided additional upward pressure through the back half of the month. The benchmark closed Friday near $88, having gained 1.2% on the session.
Two sessions have erased roughly a third of that monthly advance. From near $88 to below $80 is a decline of roughly 9%, and it happened without a single barrel of additional supply reaching the market — the entire move was risk repricing.
The forward curve carries information the spot price does not. During the late-June collapse, August Brent traded beneath September at $73.59, a contango structure signaling ample short-term supply. That relationship inverted through July's escalation as prompt scarcity returned. Watching whether the front month slips back beneath the second month over the coming sessions is the cleanest available signal on whether physical tightness is actually easing or whether this is purely a paper move.
Forecasts had clustered in the upper $70s for Brent across August and September on the assumption of heightened but contained geopolitical uncertainty, with occasional spikes and dips outside the range. That call is currently being tested from the low side. A separate framework put near-term trading between $75 and $82 with Brent roughly 36% below its conflict peak.
The structural argument for a floor rests on procurement mechanics. Long-haul purchasing forces refiners to make supply decisions weeks in advance, and those decisions have already reduced immediate reliance on Middle Eastern barrels. Each escalation reinforces rather than reverses that diversification, which means the demand base for Gulf crude is permanently smaller than it was in February regardless of how the negotiation resolves.
That is a bearish structural overlay on a bullish geopolitical one, and it explains why every rally this year has failed at a lower high than the last.
OPEC+ Added 188,000 Barrels That Do Not Exist
Seven producers met virtually on August 2 and raised September quotas by 188,000 barrels per day. Saudi Arabia and Russia each added 62,000, Iraq 26,000, Kuwait 16,000, Kazakhstan 10,000, Algeria 6,000 and Oman 5,000. September required production sits at 10.478 million barrels per day for Saudi Arabia, 9.949 million for Russia and 4.431 million for Iraq.
The decision completes the phased rollback of the 1.65 million barrels per day of voluntary cuts introduced in April 2023, returning the seven producers to their original pre-cut baselines. It marks the sixth consecutive monthly increase of identical size, matching the adjustments announced in July, June, May, April and March. The group meets again on September 6.
The number is theoretical. Export disruptions across the Gulf, Russia and Kazakhstan mean successive monthly increases have remained largely on paper with minimal market impact. When the marginal producer sits 2.95 million barrels per day beneath its ceiling, moving that ceiling by 62,000 barrels changes nothing about what physically loads. Russian output hovers near 9 million barrels per day against a higher target, constrained by repeated drone strikes on domestic oil infrastructure.
The signaling channel and the volume channel have separated since March. In normal conditions a quota increase depresses the physical market and tells traders the group intends to defend share. Right now it does neither — barrels are returning because Gulf shipping is recovering, not because ceilings moved.
What matters is what comes next. The restoration campaign is finished, which removes the group's incentive to rush further supply changes. A fourth-quarter pause is the widely held base case while producers prepare for 2027 quota negotiations. A capacity review is underway that will set 2027 baselines, and those talks face difficulty with several members — Iraq among them — pushing for higher individual allocations reflecting expanded capacity.
The composition of the group has also shifted. The United Arab Emirates, an original participant in the 2023 voluntary cuts, left the organization in May 2026 and no longer participates in these decisions. That removes one of the few members with meaningful spare capacity from the coordination framework entirely.
The surplus risk sits in the fourth quarter, once export flows normalize and the scale of the supply increase becomes visible.
The EIA Cut Its Brent Forecast By $27 In One Month
The July outlook put Brent averaging $74 per barrel in the third quarter — a reduction of $27 from the prior month's projection. That revision followed the June 18 memorandum and the resumption of traffic through the strait, which prompted an upward revision to expected global production for the balance of the year.
The inventory trajectory tells the story. Global stocks were previously forecast to fall by more than 7 million barrels per day in the third quarter. That draw has been cut to 2.2 million barrels per day. The fourth quarter flips to a build of 2.7 million barrels per day, and 2027 to a build of 5.0 million barrels per day. Most crude production is expected back near pre-conflict averages by the end of this year, with the majority of shut-in capacity online by the first quarter of 2027.
Demand is the offsetting variable and it is deteriorating. Global oil consumption is forecast to decrease by an average of 1.2 million barrels per day across 2026, with 800,000 barrels per day of that decline coming from non-OECD countries — primarily Asian economies most affected by the strait closure. Consumption is expected to rebound 2.0 million barrels per day in 2027 to 104.8 million, 800,000 barrels per day above the 2025 average.
The Brent spot price averaged $85 per barrel in June, $22 below the May average and $32 beneath the April peak. Prices fell below $70 on July 1 — roughly where they sat when the conflict began in late February — before the July escalation carried them back near $88.
The next outlook lands August 11 and will incorporate July's escalation and the current de-escalation. Given that the July report was completed on July 1, before the month's 24% Brent rally, the revision cycle has been running a month behind price.
What the framework describes is a market that returns to structural oversupply once the geopolitical premium clears. That is the pre-conflict state, and it is the destination every supply-side forecast points toward. The only question is whether the path runs through a signed agreement in August or through another quarter of escalation.
Inventories At 411.7 Million Barrels Sit 6% Below Average
U.S. commercial crude inventories excluding the Strategic Petroleum Reserve stood at 411.7 million barrels for the week ending July 17, after a build of 2.0 million barrels, leaving stocks 6% beneath the previous five-year average. Gasoline inventories rose 0.8 million barrels and sit 7% below the five-year average. Distillate stocks rose 1.4 million barrels and sit 10% below. Propane and propylene inventories jumped 6.3 million barrels to 34% above average. Total commercial petroleum inventories rose 11.6 million barrels on the week.
Refineries ran at 96.1% of operable capacity, processing 17.1 million barrels per day — down 58,000 barrels per day from the prior week and running near the practical ceiling for the U.S. system. Crude imports averaged 5.7 million barrels per day in a recent week, up 60,000, with the trailing four-week average at 5.5 million barrels per day, 12.2% below the same period a year earlier.
The distillate figure at 10% below the five-year average is the tightest of the three major categories and the one that has driven margin strength all summer. A system running at 96% utilization cannot build product inventory without a demand collapse, which is why refined product markets have stayed tight even as crude has been volatile.
Globally the picture is loosening. Observed oil inventories rose for the first time in four months in June, by 21 million barrels, as sharply higher volumes on water more than offset continued onshore draws. That distinction matters — oil on water is supply in transit rather than supply available, and it reflects the restart of tanker flows through the strait rather than genuine surplus.
OECD stocks fell 62 million barrels in June after a 73 million barrel decline in May, with roughly 44 million barrels of the June draw coming from government stock releases rather than commercial destocking. Non-OECD crude stocks eased 37 million barrels, led by a 41 million barrel draw in China.
Government releases supplying two-thirds of an OECD draw is not a sustainable inventory dynamic. It means the strategic buffer has been absorbing the shortfall, and rebuilding it becomes forward demand once prices stabilize.
The next weekly report lands Wednesday and will be the first to capture the current de-escalation.
Read More
-
Yen Stalls at 160 Despite a 3% JGB and Tokyo Core CPI at 2.0% — Intervention Sits at 164, Friday's Payrolls Decide
02.09.2026 · TradingNEWS ArchiveEnergy
-
FILG ETF — Filecoin Trust ($1.51) Carries a $1.6M Gap Over Its $2.2M in FIL as the Premium Compresses From 2,000%
22.09.2026 · TradingNEWS ArchiveStocks
-
XRP ETF — Spot Funds Hit $1.68B in Inflows While XRPI's CME Futures Structure Bleeds — $1.54 Is the Trigger
22.09.2026 · TradingNEWS ArchiveCrypto
-
NG ($2.84) Fights Record Supply as Cove Point Outage Sinks Appalachian Hubs — $2.75 Next
22.09.2026 · TradingNEWS ArchiveCommodities
-
USDJPY (157.45) Coils Below 157.536 Fibonacci as 275bp Fed-BOJ Gap Keeps Carry Alive — 159.45 in View
22.09.2026 · TradingNEWS ArchiveForex
Refining Margins Hit Four-Year Highs While Crude Sold Off
The most informative divergence in the energy complex is not between Brent and WTI. It is between crude and refined products. Cracks and refinery margins rallied to four-year highs by early July precisely as increased crude supplies pushed oil prices sharply lower — a well-supplied crude market sitting alongside a genuinely tight product market.
The cause is refining capacity, not crude availability. Global refinery runs rose 1.5 million barrels per day in June but remained 6 million barrels per day below the prior year. Middle East export refineries have yet to restart. Russian throughputs are curtailed by attacks on infrastructure. Asian refiners continue running at reduced rates. Global runs are forecast to decline 2.4 million barrels per day across 2026 before rebounding 3.1 million barrels per day in 2027.
Jet fuel concerns eased in recent weeks as refiners pushed output to new highs, but diesel and gasoline markets tightened in response, with gasoline cracks moving sharply higher. Capacity that shifts toward one product creates scarcity in another when the system is already running flat out.
For price forecasting, this dynamic sets a floor beneath crude that pure supply-demand balances miss. Refiners earning four-year-high margins bid aggressively for feedstock regardless of the crude price level, because every incremental barrel processed generates outsized profit. That demand is price-insensitive in the way that consumer demand is not.
It also explains the divergence between falling crude and elevated consumer fuel costs. Lower crude prices contribute to a drop in U.S. retail gasoline prices in the third quarter relative to the second, but the pass-through is muted when refining margins absorb the difference. That gap is the source of the political pressure now being applied to the majors.
The forward risk is that the margin structure normalizes faster than crude recovers. Middle East export refineries restarting would add 2 to 3 million barrels per day of product supply into markets currently short, collapsing cracks and removing the price-insensitive refiner bid from the crude market simultaneously.
That sequencing — product surplus arriving before crude demand recovers — is the mechanism through which a Hormuz agreement produces a deeper crude selloff than the headline supply math implies.
Demand Is Contracting 1.2 Million Barrels A Day
The demand side of this market has been overshadowed by supply headlines and it is the weaker half of the equation. Global consumption is forecast to fall by an average of 1.2 million barrels per day across 2026, with 800,000 barrels per day of that decline concentrated in non-OECD countries — primarily the Asian economies most exposed to the strait closure.
That contraction is unusual. Global oil demand has grown in nearly every year outside recessions and the pandemic. A 1.2 million barrel per day decline represents roughly 1.2% of consumption and reflects price destruction rather than economic collapse: Brent averaging $85 in June and above $100 through the spring priced marginal consumption out of the market.
The recovery assumption is aggressive. Consumption is projected to grow 2.0 million barrels per day in 2027 to 104.8 million, which would be 800,000 barrels per day above the 2025 average. That path requires prices to fall and supply flows to fully return — two conditions that are related but not identical.
The inflation channel connects this directly to macro policy. U.S. annual inflation reached 4.20% in May, the highest since April 2023, driven largely by the energy shock. Euro area energy inflation accelerated to 10.0% in July from 8.5% in June, pushing headline inflation up to 2.9% from 2.8% and lifting core to 2.5%. Central banks on both sides of the Atlantic have moved toward tightening in response, with markets pricing roughly 68% odds of a September Federal Reserve hike from a 3.50%-3.75% target and roughly 79% odds of a European Central Bank hike from a 2.25% deposit rate.
That creates a reflexive loop. High oil prices force tightening, tightening slows growth, slower growth destroys oil demand, and falling demand pulls prices back down. The current selloff is the market beginning to price the back half of that loop.
The demand-side implication for the price forecast is that even a full Hormuz resolution does not produce a V-shaped consumption recovery. Refiners have already restructured procurement away from Gulf barrels. Consumers have already adjusted. Demand returns on a lag measured in quarters, while supply returns on a lag measured in weeks.
Producers Printed $26.6 Billion And Got Political Pressure For It
The two largest U.S. integrated producers delivered combined second-quarter profit of $26.6 billion, up 178% year over year, with 61% of that coming from upstream operations. Political pressure to cut fuel prices followed within days, met with the industry response that global supply and demand dynamics set prices rather than producer margins.
Across the Atlantic the numbers were comparable in direction. One European major posted net profit up 144% to $5.7 billion, with underlying replacement cost profit reaching $8,930 million against $3,734 million a year earlier, and raised its dividend 4%. Those results beat expectations on the strength of the energy shock rather than on operational improvement.
The equity market has not rewarded the earnings. Energy was the worst-performing sector on Tuesday at -2.5%, and the sector has traded as a pure derivative of the crude price rather than on cash generation. That relationship makes sense — a 10% two-session decline in the underlying commodity compresses forward earnings estimates faster than a completed quarter improves them.
The dividend and buyback capacity built during the price spike is what changes the sector's structural position. Producers entering the fourth quarter with balance sheets repaired by a $26.6 billion quarter can sustain distributions through a period of $70 crude in a way they could not in 2020 or 2015. That reduces the equity downside relative to the commodity downside.
The upstream concentration in those profits is the tell on where the value sits. Sixty-one percent from production means the integrated model captured the crude price spike rather than the refining margin expansion, which is the opposite of what the four-year-high crack spreads would suggest. Refining-weighted operators have been the better relative performers.
Political risk is now a live variable rather than a background one. Pressure to cut pump prices ahead of November midterm elections creates an incentive structure where Washington actively wants lower crude, which reinforces the diplomatic push toward a Hormuz agreement. That alignment — political incentive and negotiating posture pointing the same direction — is a meaningful bearish input for the price over the next three months.
Russia, Kazakhstan And Venezuela Are The Non-Gulf Variables
Supply risk in this market is no longer confined to the Gulf. Russian output hovers near 9 million barrels per day against a September quota of 9.949 million, constrained by repeated Ukrainian drone strikes on domestic oil infrastructure. Attacks near Black Sea export facilities have added a second disruption channel with no diplomatic process attached to it.
Kazakhstan resumed crude intake through the Caspian Pipeline Consortium after a brief suspension, though exports remain vulnerable to drone attacks targeting tankers. That route carries the bulk of Kazakh production and has been interrupted repeatedly. The country's September quota rises 10,000 barrels per day to a level it has struggled to fill consistently.
Turkey and Iraq extended a key pipeline agreement by one year, supporting alternative export routes that bypass the strait entirely. That extension is structurally bearish — it institutionalizes the diversification away from Hormuz that refiners began in March and reduces the leverage any future closure carries.
Venezuelan flows shifted materially. Exports slipped to 1.16 million barrels per day in July from 1.2 million in June, with reduced storage withdrawals the primary factor. U.S. imports from the country climbed to 786,000 barrels per day, the highest since early 2019, up from 284,000 barrels per day in January. Shipments to India and Europe fell, producing a global export decline even as the American share rose. The country has taken in $13 billion of oil revenue since January under U.S. oversight.
That reallocation matters for WTI specifically. Heavy Venezuelan crude displacing Middle Eastern barrels into Gulf Coast refineries tightens the relationship between U.S. inventories and Western Hemisphere supply while loosening the link to Hormuz. Part of the reason WTI has fallen harder than Brent this week is that the U.S. system has already substituted away from the disrupted source.
Libyan and Nigerian output disruptions from prior cycles remain unresolved background variables. None of these are large enough individually to set the price. Collectively they represent 1.5 to 2 million barrels per day of production operating below capacity for reasons unrelated to the Iran conflict — supply that returns to the market on a different timeline and adds to the fourth-quarter surplus risk.
Forecast: $70 On A Deal, $88 On A Collapse
The base case is that a Hormuz agreement lands within weeks and crude trades lower. Public positioning on both sides points that direction, the political incentive in Washington favors lower pump prices ahead of November, and the supply framework has already been revised toward normalization with production returning to pre-conflict averages by year-end.
The bear path targets the prior lows. A signed agreement takes WTI through $75 toward the $69.23 late-June settlement and Brent toward the $71.99 print from the same session. Both contracts closed beneath $70 and $72 respectively as recently as five weeks ago, and nothing structural has changed to prevent a retest. The third-quarter Brent forecast of $74 sits roughly 7% beneath current levels and would be reached on a partial resolution alone. Fourth-quarter inventory builds of 2.7 million barrels per day, followed by 5.0 million in 2027, describe a market that returns to structural surplus once the premium clears.
The bull path requires the talks to fail. Iran's denial of direct negotiations, the abrupt cancellation of prior sessions, and the repeated pattern of escalation following apparent breakthroughs all remain live. A collapse rebuilds the war premium within days, and the July precedent — Brent running from below $70 to near $88 in four weeks — establishes the magnitude. Brent above $88 and WTI above $84 would follow a resumption of strikes or a new tanker incident.
Levels for the near term: WTI support sits at $75, then $73.52, then the $69.23 June low. Resistance runs $80.34, then $84.67, then the mid-$80s July highs. Brent support sits at $80, then $78.02, then $71.99. Resistance runs $83.77, then $88, then $90.
The structural view is bearish beyond the headline cycle. Demand contracting 1.2 million barrels per day in 2026, OPEC+ having completed its restoration with 2.95 million barrels per day of unfilled quota capacity waiting, refiners permanently diversified away from Gulf crude, and inventory builds forecast through 2027 all point the same direction.
The trade: below $75 on WTI, target $73 then $69. Above $80.34, target $84.67. Everything in between is a headline.