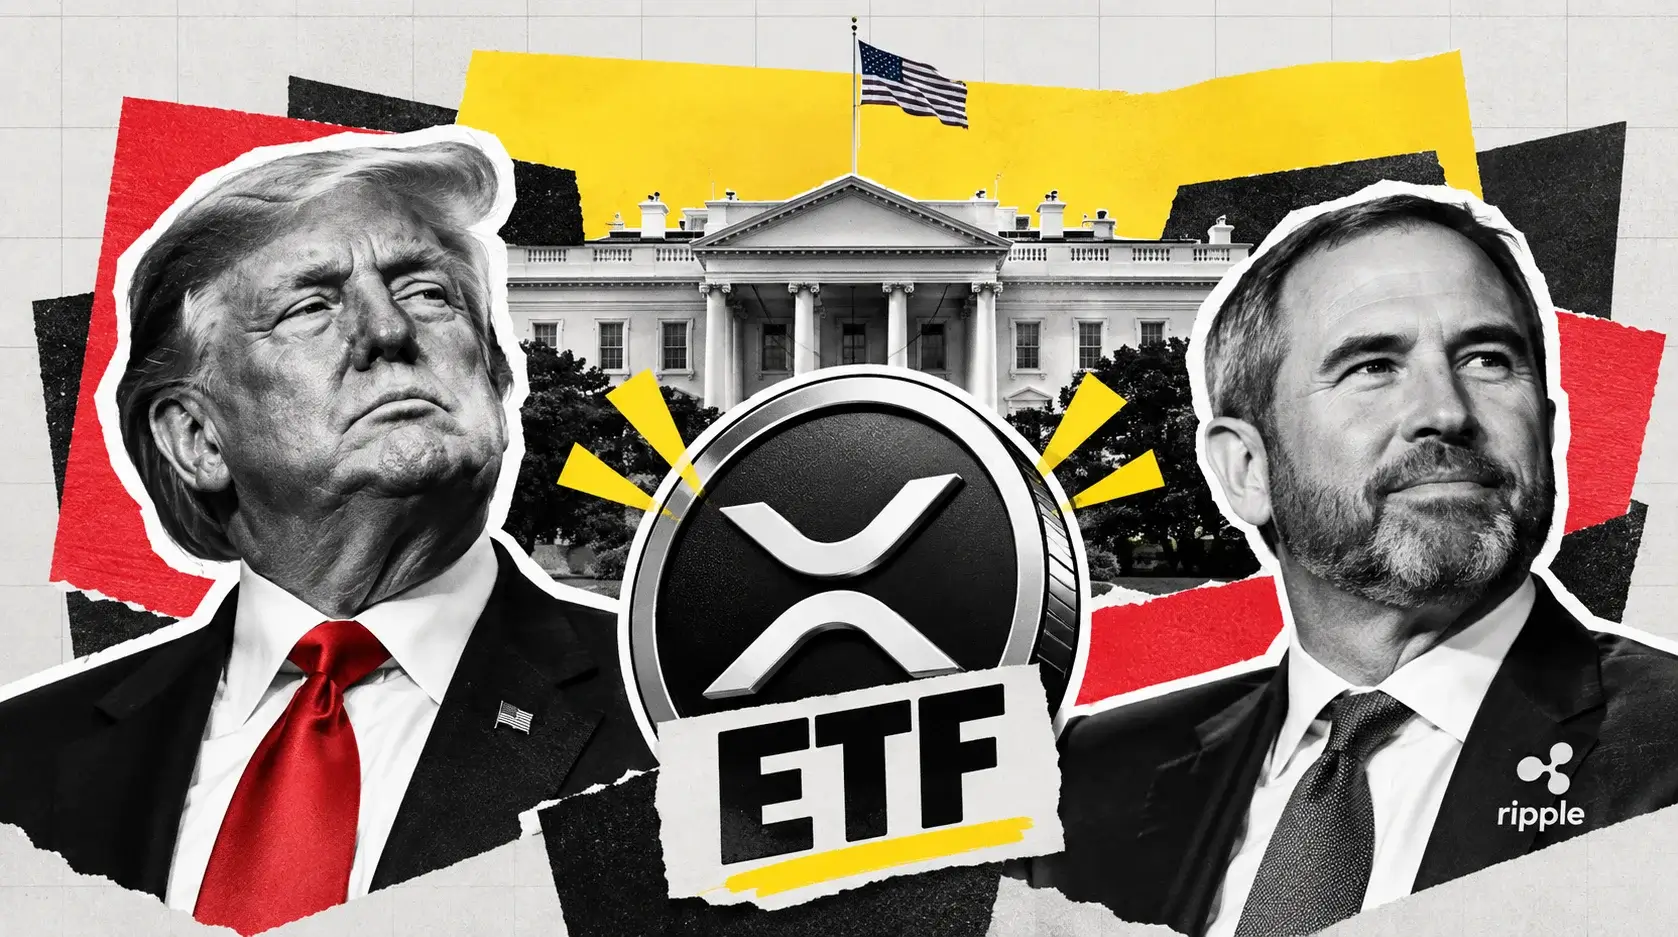
XRP-USD ($1.43) Cools From Seven-Month High as Whales Move 1.451B to Binance — Upside to $2.00
Daily RSI has eased from 85.41 to 75.335 while $500M of leveraged longs were liquidated 3 days after the breakout | That's TradingNEWS
Key Points
- XRP traded at $1.43, holding the 38.2% retracement at $1.42 after peaking at $1.6963.
- Spot XRP ETFs took $23.87 million on August 25, a ninth consecutive inflow session.
- Cumulative XRP ETF net inflows hit a record $1.57 billion, about 1.50% of supply.
XRP traded at $1.43 on Wednesday, testing $1.40 support for a second consecutive down session after last week's rally carried it from $1.00 to a high of $1.6963. Intraday quotes clustered between $1.4256 and $1.43, down 1.24% to 2.44% on the day and roughly 5% over the trailing twenty-four hours.
The performance table shows how violent the preceding move was. XRP is up 44.07% over one week, 31.69% over one month, and 0.78% over six months, while sitting 21.48% lower year to date and 52.26% below where it traded a year ago. That combination — a 44% week inside a 52% annual decline — describes a token that just staged the sharpest counter-trend move of its cycle.
The low is the anchor. XRP set a cycle bottom at $0.9870 to $0.9885 in mid-August, printing $0.9952 on August 11 and spending hours trading between roughly $1.008 and $1.05. From there it climbed approximately 70% within 72 hours to $1.6963, the highest level in seven months and the strongest weekly gain since the SEC settlement era.
Since that peak it has retraced to $1.42, recovered toward $1.50, and now sits at $1.43. August is still tracking a gain of roughly 32%, on course for the strongest monthly performance in more than a year.
Here is the thesis: XRP finally outran the entire crypto complex on a policy headline, and the composition of that move is the problem. Two days after $33 million of short liquidations powered the breakout, a $500 million long liquidation cascade ran the other way. Whales accumulated 380 million tokens in a week and then sent 1.451 billion to Binance over thirty days.
The structural case now rests on a Senate procedural vote scheduled for September 15 that prediction markets price at roughly 16% odds of passing. That is a thin foundation for a 70% repricing.
The Fear & Greed Index reads 65 on Wednesday, down from 74 the day before.
The 70% in 72 Hours and What Actually Caused It
The rally between August 18 and August 22 delivered approximately 56%, and four distinct catalysts converged inside five sessions.
The first was macro. The U.S. Treasury announced it would double long-term bond buyback operations from $2 billion to at least $4 billion per session starting September 9 and running through November 4. The buybacks pull supply off the bond market, push yields lower, and free capital to rotate into risk assets. Bitcoin surged from below $63,000 earlier in the month to a peak above $81,000, its strongest weekly gain in more than three years.
The second was regulatory. A White House crypto summit advanced the CLARITY Act, proposed legislation that would classify XRP and similar tokens as digital commodities under CFTC oversight. Separately, the SEC proposed new crypto rules on August 19 including exemptions for certain token offerings and a pathway for projects to raise up to $75 million before exiting securities classification.
The third was on-chain. Whale addresses holding between one million and ten million XRP accumulated approximately 380 million tokens in a single week, lifting tracked holdings from 16.05 billion to 16.36 billion. A separate reading showed 300 million XRP accumulated within 96 hours. Exchange outflows exceeded 240 million tokens since the start of summer.
The fourth was flow. Spot XRP ETFs attracted $39.78 million in net inflows for the week ending August 22, their strongest weekly pace since May.
The sequencing matters more than the list. Whale accumulation happened while XRP hovered near $1, well before the move to $1.23 on August 20. When large holders buy aggressively at flat prices, the market has not yet repriced whatever those holders expect. That timing is the strongest single argument that this was positioning rather than chasing.
The distinguishing feature against prior 2026 rallies is that whale buying aligned with ETF inflows for the first time this year. Previous accumulation phases occurred during ETF outflows or flat institutional interest. This time on-chain buying and fund flows moved in the same direction.
$500 Million of Longs Got Liquidated Two Days After the Shorts Did
The derivatives sequence explains both the speed of the advance and the speed of the reversal.
XRP futures open interest rose 27% in seven days to $3.50 billion. On August 20, roughly $33 million in short liquidations fueled the breakout as bearish positions were forced to cover into rising prices. Two days later, a $500 million long liquidation cascade ran the opposite direction as the price collapsed from its peak near $1.70 toward the $1.46 to $1.50 range.
That is a 15-to-1 asymmetry between the short squeeze that started the move and the long flush that ended it. The market added $3.50 billion of leveraged exposure in a week, and half a billion of it got taken out in a single event.
The current derivatives readings show the pressure has not cleared. Long liquidations reached approximately $4.66 million, a 31.82% increase in one day, while short liquidations stood at roughly $1.13 million after rising 61.61%. Longs are still being taken out at four times the rate of shorts.
The positioning data is genuinely split. Whale long-to-short ratios on Binance and OKX leaned bullish, with the OKX whale position ratio reaching 8.16 — an extreme skew toward long exposure. Smart-money sentiment reads extremely bullish on OKX, extremely bearish on Bybit, and bearish on Binance. Taker volume has stayed close to balanced.
That divergence across venues is what produces cascades. When one exchange is heavily long and another heavily short, price moves that trigger one side's liquidations feed directly into the other's, and the resulting volatility is mechanical rather than informational.
For the forecast, $3.50 billion of open interest against a token with a $1.43 handle means the eventual break out of the current range is likely to overshoot. The liquidation clusters sit at the range edges, not in the middle.
Nine Straight Days of ETF Inflows and What $56.86 Million Means
The institutional flow is real, consistent, and small.
U.S. spot XRP ETFs logged $23.87 million in inflows on August 25, extending positive flows to nine consecutive trading sessions. The week ending August 22 delivered $39.78 million, the strongest weekly figure since May. August has contributed $56.86 million in total, more than double July's $27.29 million.
The turnaround from earlier in the month is stark. During the first half of August, seven of the month's first eleven trading sessions recorded no net inflows at all. That changed on August 18, when the funds attracted $5.81 million — the largest daily figure of the month at that point. Nine sessions later the streak is unbroken.
Trading activity expanded even faster than flows. One issuer's XRP ETF recorded $125 million in single-day trading volume on August 20, beating the prior record by 42% and pushing three-day cumulative volume past $200 million by August 24. Net assets at the two largest funds stand at $442 million and $433.8 million respectively.
Institutional adoption is broadening at the holder level. One large U.S. financial institution disclosed $86.5 million spread across five spot XRP ETFs in its Q2 2026 filing after reporting zero XRP ETF exposure at the end of Q1.
The scale problem is the part that gets skipped. Fifty-six million dollars is the best month the category has produced, arriving during a 70% price move. Bitcoin ETFs took $1.918 billion in a single week over the same window and $314 million on Tuesday alone.
XRP's ETF complex is therefore a real but marginal bid. It confirms institutional participation without being large enough to set the price. The token moved 70% on roughly $40 million of weekly fund demand, which tells you the float doing the work was thin and the marginal buyer was leveraged.
The $1.57 Billion Cumulative Base and 1.50% of Supply
The longer-run flow picture is more encouraging than the monthly numbers suggest.
Cumulative net inflows across all seven U.S. spot XRP ETFs reached $1.57 billion as of August 24, a record. Those funds have been trading since November 2025 with issuers including Bitwise, Franklin Templeton, Grayscale, 21Shares, Canary Capital and Volatility Shares.
Combined, the products hold approximately 1.50% of total XRP supply. That is the entire institutional wrapper footprint after nine months of trading.
The forward case rests on that percentage rising. Research circulated ahead of the rally suggested XRP ETFs could eventually absorb 5% to 6% of circulating supply if adoption follows the trajectory of Bitcoin and Ethereum funds. Moving from 1.50% to 5% would require roughly $3.7 billion of additional net inflows at current prices — more than double the cumulative total accumulated to date.
That is achievable on a multi-year horizon and irrelevant to the next three months. At $56.86 million per month, reaching 5% of supply takes over five years.
The comparison with Ethereum is instructive on what a step-change looks like. Ethereum ETFs recorded $365 million in net inflows in July, their strongest month ever, and out-raised Bitcoin ETFs for the first time. XRP's best month is 15.6% of that figure.
The supporting fundamental narrative is Ripple's expanding payments business and an estimated $50 billion private valuation, which has underpinned expectations for continued institutional interest in the token.
For the forecast, ETF flow functions as a confirmation signal rather than a price driver. Nine consecutive positive sessions is the bullish read — the streak breaking is the first warning that the August repricing was momentum rather than allocation.
Whales Bought 380 Million and Then Sent 1.451 Billion to Binance
The on-chain data cuts both directions and the tension is unresolved.
The accumulation side is documented. Whale addresses holding one million to ten million XRP added approximately 380 million tokens in a single week, taking aggregate tracked holdings from 16.05 billion to 16.36 billion. A separate measurement recorded 300 million XRP accumulated within 96 hours. More than 240 million tokens have left exchanges since the start of summer.
The distribution side is larger. Daily whale inflows to exchanges surged to roughly 460 million XRP during the rally, the highest level since February. Over a thirty-day window, whale inflows into Binance reached approximately 1.451 billion XRP — the highest four-week total in four months — after declining through July and early August. Withdrawals over the same period totaled 231 million.
That is a net 1.22 billion XRP moved onto the largest exchange in a month. At $1.43, that represents roughly $1.74 billion of supply positioned within reach of a sell button.
A separate monitoring report tracked a $175 million exchange transfer during the pullback.
The interpretation is genuinely contested. Tokens moved to exchanges are not necessarily sold — they can go to custodians, market makers, other venues, or non-selling wallets. Equally, tokens withdrawn from exchanges are not necessarily long-term accumulation for the same reasons in reverse.
What is not ambiguous is the direction of the imbalance. Accumulation of 380 million tokens against inflows of 1.451 billion means large holders put roughly four times more supply onto exchanges than they added to their positions during the same period.
The honest read is that whales bought the base near $1.00 and are distributing into strength above $1.40. That is rational behavior, it is not bearish for the structural thesis, and it caps the rally until the flow reverses.
RSI From 85.41 to 75.335 and the Overbought Unwind
The momentum picture is cooling from an extreme rather than breaking down.
The 14-day RSI reached 85.41 at the peak, described as the most overbought reading since July of the prior year. On August 24 it printed 80.48 with XRP at $1.48. The current reading sits at 75.335 — still above the 70 overbought threshold, but 10 points below the high.
That is the constructive form of unwinding. RSI falling from 85.41 to 75.335 while price retraced only from $1.6963 to $1.43 means momentum is normalizing faster than price is giving back, which is the signature of digestion rather than reversal.
The trend indicators have not broken. MACD (12,26,9) reads 0.091 and continues to register as a buy signal. Williams %R at 37.787 also registers as a buy. XRP trades above its 50-day and 100-day exponential moving averages.
The counterweight is that the pullback has been fast and the deleveraging has been violent. XRP fell approximately 5% in twenty-four hours and has now declined for two consecutive sessions. The broader market provided no cushion — total crypto market cap sat near $2.617 trillion with Bitcoin dominance around 59.25%, and Bitcoin itself has faded from $81,255 to $78,528.
Sentiment has cooled in step. Fear & Greed dropped to 65 from 74 in a single day, moving from firm greed toward neutral greed. The Crypto Fear and Greed Index had reached 73 during the peak, its highest reading in months.
Volatility compression appeared on the lower timeframes during the consolidation, with ATR14 dropping to 0.03 and the 15-minute EMA20, EMA50 and EMA200 clustering within a cent of each other around $1.48 to $1.49 — a coiled setup that has since resolved lower.
The read: overbought conditions are being worked off through both time and price simultaneously, which is the fastest way to reset a stretched chart. That process is roughly two-thirds complete.
The Fibonacci Map: $1.42 and $1.34
The retracement structure of the August rally provides the cleanest support framework available.
Measuring the move from $0.9870 to $1.6963, the 38.2% retracement sits at $1.42 and the 50% level sits at $1.34. XRP at $1.43 is holding the first by a single cent.
That makes $1.42 the immediate decision point. Holding above it opens consolidation between $1.42 and $1.60 while the market digests the volatile move. Losing it on a closing basis puts $1.34 directly in play — a further 6.3% decline from current levels.
The 50% retracement at $1.34 carries additional weight because it coincides with the 200-day EMA, which sits at $1.34 to $1.35. Two independent methodologies converging within a penny makes that level the structural line for the entire advance.
As long as XRP remains above the 200-day EMA, the longer-term uptrend structure stays intact. Below it, the August move becomes a failed breakout rather than a trend change.
The correction itself was mechanically justified. The rally delivered more than 60% in a week with the 14-day RSI at 85.41, making a sharp pullback probable regardless of fundamentals. The broader market weakened simultaneously, with total crypto market cap down 2.41% and Bitcoin down 1.73%, amplifying a natural technical pullback into forced selling.
The current price action is a test of whether the retracement is orderly. Two consecutive down sessions with the 38.2% level holding is orderly. A third session that breaks $1.42 with expanding volume is not.
Statistical modeling projects XRP trading between $1.23 and $1.99 over the next 30 days, with the midpoint driven by recency-weighted recent price action and the range widening with realized 30-day volatility. That band brackets both the 50% retracement below and the descending trendline above.
Read More
-
Yen Stalls at 160 Despite a 3% JGB and Tokyo Core CPI at 2.0% — Intervention Sits at 164, Friday's Payrolls Decide
02.09.2026 · TradingNEWS ArchiveEnergy
-
Rocket Lab Fund Captures Neutron Delay as RKLB Slides 17.5% in Two Days — $50 RKLB Floor Defines Next Move
15.10.2026 · TradingNEWS ArchiveStocks
-
XRPI and XRPR Follow XRP Off the $1.29 Floor as the Only Crypto ETF Group Still Taking In Money — $1.42 Upside, $1.20 Risk
15.10.2026 · TradingNEWS ArchiveCrypto
-
Henry Hub Climbs to $3.26 as Storage Build Falls 23 Bcf Short of Normal — Break of $3.283 Opens $3.50
15.10.2026 · TradingNEWS ArchiveCommodities
-
Dollar Retreats to 157.79 From 159.00 High as Yields Fall and Tokyo Guards 160 — Range Holds Into Fed and BoJ
15.10.2026 · TradingNEWS ArchiveForex
The EMA Cluster at $1.36, $1.32 and $1.20
Below the Fibonacci levels, the moving average structure defines where a deeper correction terminates.
The first major support sits around $1.36, where short-term exponential moving averages converge. Additional EMA support clusters at $1.32 and $1.20, creating a stepped bullish structure beneath current price.
Holding the $1.36 area would help XRP avoid a deeper decline. A break below it puts the $1.28 region in focus — the level that served as the daily S1 pivot during last week's breakout and which would become the next meaningful support if selling pressure continues.
Further down, the 100-day EMA sits at $1.19 and the 50-day EMA at $1.16. Those represent the deeper demand zone if a broader correction unfolds, and they sit 16.8% and 18.9% below spot respectively. Reaching that band would erase roughly two-thirds of the August advance.
The structural floor remains the cycle low at $0.9870, which is 31.0% below current price and represents the level the token defended repeatedly through mid-August. XRP had been stuck between $1.00 and $1.18 since late June, with $1.00 the only level bulls successfully defended all year.
The bullish EMA configuration is the constructive detail. Short-term averages stacked above longer-term averages at $1.36, $1.32 and $1.20 means the moving average sequence has reordered from the death cross structure that governed the token through the first half of 2026, when the 50-day sat at $1.20 below a 200-day at $1.50.
That reordering is what separates this move from the failed bounces earlier in the year. Price is above all four key averages for the first time in the cycle.
The practical hierarchy: $1.42 is the first test, $1.36 is where the EMA cluster catches, $1.34 is the 50% retracement and the 200-day EMA together, and $1.28 is where the breakout structure fails entirely.
Upside Structure: $1.45, the $1.66 Trendline, and $2.00
The resistance map above is compressed near current levels and then thins out sharply.
Immediate resistance sits at $1.45, roughly 1.4% above spot and the level that has capped the two-session pullback attempts to recover. Above that, the $1.55 to $1.70 zone produced strong sell-side rejection during the retreat, generating a bearish MACD crossover on lower timeframes.
The structural cap is a descending trendline projected from $1.66. That line represents the ceiling of the multi-month downtrend, and a sustained break above it would open the door for rally continuation. Failure to clear it keeps XRP confined to a corrective phase above the clustered EMAs.
The cycle high at $1.6930 to $1.6963 is the level that matters most. It marks the seven-month peak, it aligns closely with the descending trendline, and it is where the $500 million long liquidation cascade began. Reclaiming it on a daily close would confirm the latest rally is more than a short-term recovery.
Beyond $1.70, the chart genuinely opens. The pivotal target is $2.00, a level that has been widely cited as the objective if buying continues, and above that $2.14 represents a prior high. Modeled year-end ranges span $0.6055 to $2.81 for 2026, which quantifies how wide the distribution of outcomes remains.
The bullish scenario laid out by market participants is specific: XRP holds above $1.40 to $1.50, ETF inflows continue at anything close to last week's pace, and the CLARITY Act advances on September 15. That combination would supply both the demand and the regulatory clarity to challenge $1.65 to $1.70, with $2.00 becoming realistic if resistance breaks cleanly.
The bearish mirror is equally specific: XRP loses the $1.30 to $1.40 area, ETF inflows fade back toward the near-zero levels seen earlier in August, and the CLARITY Act stalls as lawmakers turn toward November midterms. That unwinds a meaningful share of the month's gains and puts the $0.9952 low back within reach.
CLARITY Act on September 15 at 16% Odds
The single largest binary event in XRP's forward calendar is a procedural vote, and the market is pricing it as unlikely to pass.
The CLARITY Act would classify XRP and similar tokens as digital commodities under CFTC oversight rather than SEC jurisdiction. A Senate procedural vote is scheduled for September 15, 2026. Prediction market contracts assign approximately 16% odds of passage.
That 16% figure is the most important number in this analysis. A regulatory reclassification that removes securities-law ambiguity from the largest payments-focused token in the market is a structural repricing event. The market says it probably does not happen.
The asymmetry that creates is unusual. If the vote fails or gets deferred, very little of the current price reflects it — 16% odds means roughly 84% of the outcome is already discounted as a negative. If it advances, the repricing would be substantial because almost none of it is in the price.
The complicating factor is the political calendar. Lawmakers are moving toward November midterm elections, and legislation that lacks urgency tends to get deferred rather than defeated in that window. A stall is functionally the same as a failure for anyone positioned into the date.
The White House crypto summit that advanced the bill during the August rally is the reason it moved into the narrative at all. Presidential support for the legislation has been publicly stated, and the SEC's own August 19 proposal creating a token-offering exemption pathway signals the regulatory direction of travel independent of Congress.
For positioning, September 15 is a date to be flat into rather than long into. A 16% probability event does not justify carrying leverage through it, and the derivatives structure — $3.50 billion of open interest with a documented $500 million liquidation cascade three days ago — means the reaction in either direction will be amplified.
The rest of the regulatory backdrop remains supportive without being decisive.
Network Fundamentals: 267K Active Addresses and a $2.1 Billion Stablecoin
The underlying network data has improved and it is the least-discussed part of the story.
Addresses actively transacting on the XRP Ledger remain elevated at 267,000, underscoring growing user engagement. That is a usage metric rather than a speculation metric, and it has held up through both the collapse to $0.9870 and the rally to $1.6963.
The Ripple USD stablecoin's market capitalization has climbed to a record high of $2.1 billion, up from a January low of $1.5 billion — a 40% increase across eight months. Stablecoin supply on a ledger is a direct proxy for settlement demand, since issuers only mint against genuine deposit inflows.
XRPL institutional-lending initiatives and Ripple's payments expansion have been cited as the fundamental underpinning of renewed interest. The company carries an estimated $50 billion private valuation.
The contrarian setup that preceded the rally is worth recording. Through mid-August, retail sentiment appeared depressed while network participation and large-holder activity were improving. Whale inflows to Binance were near $61 million, described as among the lowest levels in several years — the mirror image of the 1.451 billion tokens flowing in now. That divergence, depressed sentiment against improving fundamentals, is the classic bottoming configuration and it worked.
The limitation is scale. A $2.1 billion stablecoin and 267,000 active addresses are meaningful for a payments network and immaterial against a token that moved $17 billion of market value in three days on a bond-buyback headline.
Network fundamentals set the floor for how low XRP can trade over years. They have never determined what it does over weeks, and the August move — driven by Treasury operations, a legislative summit, and $533 million of combined liquidations — is the current proof.
Macro: Treasury Buybacks, Sticky PCE and a December Hike
The macro backdrop that created this rally turned less friendly on the morning XRP needed follow-through.
July PCE printed 0.2% month over month and held at 3.7% year over year against 3.6% consensus. Core PCE held at 3.3%, marking a fourth consecutive month without net movement. Real consumer spending went flat. Q2 GDP was confirmed at 1.5% annualized. Corporate profits increased $400.9 billion against $74.4 billion in Q1.
The Dollar Index firmed 0.13% to 99.03. Treasury yields rebounded across the curve after Tuesday saw the 10-year fall more than seven basis points to 4.625% and the 30-year ease to 5.2004%. Money markets carry a fully priced Federal Reserve hike by December.
That configuration undermines the thesis the August rally was built on. XRP repriced 70% because a Treasury liquidity operation pushed long-end yields down and freed capital to rotate into risk. Sticky inflation with no policy response keeps real yields elevated, which is the standard headwind for a non-yielding asset.
The offsetting factor is timing. The buyback expansion from $2 billion to at least $4 billion per operation does not begin until September 9 and runs through November 4. The mechanical liquidity support that triggered the move is still ahead rather than behind.
Bitcoin's behavior is the cleanest read-through. BTC surged from below $63,000 to above $81,000 for its strongest weekly gain in more than three years, and has since faded to $78,528 while holding above $78,000. Spot Bitcoin ETFs logged a seventh consecutive inflow day at $314 million on Tuesday.
The immediate event risk sits at 5:00 p.m. Eastern, when a $5.2 trillion chipmaker reports with options pricing a 5.4% move worth $280 billion. Crypto has traded as a high-beta expression of the AI trade throughout 2026.
Friday brings the first Jackson Hole keynote from Chair Kevin Warsh, framed as a credibility event rather than a rate-signalling one.
Forecast and Verdict: $1.60 Base Case, $1.70 on a Break, $1.28 If $1.36 Fails
The verdict is constructive on structure with a hard invalidation, and the near-term risk skews modestly lower.
The base case is consolidation between $1.36 and $1.60 through the September 15 vote. XRP at $1.43 sits in the lower half, holding the 38.2% retracement at $1.42 by a single cent. RSI cooling from 85.41 to 75.335 while price retraced only $0.27 from the high is healthy digestion, MACD at 0.091 still reads as a buy, and price sits above the 50-day and 100-day EMAs for the first time this cycle. Nine consecutive sessions of ETF inflows totaling $56.86 million for the month provide a floor the token did not have in July.
The bull case requires reclaiming $1.45 first, then clearing the descending trendline projected from $1.66 and the cycle high at $1.6963 on a daily close with expanding spot volume rather than expanding leverage. That opens $2.00, and the CLARITY Act advancing on September 15 is the catalyst capable of delivering it. Whale accumulation of 380 million tokens near $1.00 and exchange outflows above 240 million since summer support the case that large holders positioned before the repricing.
The bear case triggers on a close below $1.36 where the short-term EMA cluster sits. That exposes $1.34 — the 50% retracement and the 200-day EMA together — and then $1.28, the daily S1 pivot from the breakout. Below $1.28, the demand band at $1.16 to $1.19 from the 50-day and 100-day EMAs becomes the destination, an 18.9% drawdown that would erase two-thirds of the August move. The triggers are ETF inflows breaking their nine-day streak and the September 15 vote stalling.
Weighting them: whales sent 1.451 billion XRP to Binance over thirty days against 380 million accumulated, $500 million of longs were liquidated three days ago against $33 million of shorts, open interest sits at $3.50 billion, Fear & Greed already backed off from 74 to 65, and the September 15 vote carries 16% odds. Against that, the 200-day EMA at $1.34 has not been tested, the EMA sequence has reordered bullish for the first time in the cycle, ETF flows have run positive nine straight sessions, and network fundamentals hold at 267,000 active addresses with a record $2.1 billion stablecoin — hold $1.42 and $1.6963 stays reachable, lose $1.36 and $1.28 arrives before the Senate votes.