Brent Retakes $105 From $98 Low as Houthis Hold Bab al-Mandab and Hormuz Runs at Half Capacity, WTI at $93.96
Crude reversed a six-session slide as Iran threatened Red Sea energy flows and restricted Hormuz navigation | That's TradingNEWS
Key Points
- Brent rebounded above $105 from a $98 trough as Iran warned of a new front targeting Red Sea energy supplies.
- Global oil inventories have fallen by 400 million barrels in 2026, with Hormuz flows at half their pre-war pace.
- A daily Brent close above $110 targets $115, while a close under $98 opens a slide toward $95.
Crude oil snapped back hard on Thursday. Brent futures gained 1.53% to $104.70 a barrel early in the session and then pushed past $105, while West Texas Intermediate climbed 1.95% to $93.96. The move reverses a six-session slide that had taken Brent below $100 for the first time since early September, with the international benchmark trading in the $98 to $99 range on Tuesday.
The rebound came on geopolitics. A senior adviser to Iran's supreme leader warned Thursday that Iranian forces and Houthi allies in Yemen could open a new front in the seven-month war by targeting energy supplies in the Red Sea if the U.S. launches new attacks. Iranian President Masoud Pezeshkian said Tehran would restrict freedom of navigation through the Strait of Hormuz as long as U.S. sanctions and a blockade stay in place. Hopes for a diplomatic breakthrough faded overnight.
The broader trend explains why traders reacted so quickly. WTI has risen 14.09% over the past month and 44.60% over the past year. Brent jumped more than 21% in the month to mid-September as the U.S.-Iran war disrupted Gulf exports, peaking near $110 on September 14 when Saudi Arabia shut its East-West pipeline after drone attacks. The retreat that followed was orderly, driven by Saudi restoration of export routes rather than any easing of the conflict.
The spread between the two benchmarks tells the supply story. Brent trades above $105 while WTI sits near $94, a gap of more than $11. That spread reflects the premium on seaborne crude exposed to Middle East shipping risk, while U.S. inland crude trades on domestic balances. It is far wider than the $3 to $5 spread that prevailed before the war.
This forecast rests on one thesis: the oil market is running on a thin physical buffer, and every threat to a shipping route now moves prices $5 to $10 in days. Global inventories have fallen by an estimated 400 million barrels this year, flows through Hormuz run at half their pre-conflict pace, and the two alternative routes, Saudi Arabia's East-West pipeline and the Bab al-Mandab strait, are both under attack. The $100 level on Brent decides whether that scarcity keeps a floor under prices while diplomacy stalls, or whether demand destruction and Fed tightening pull the market back toward the $90 area the government expects for the second half of 2026.
Every piece of this analysis, from Wednesday's surprise U.S. crude build to Iran's Red Sea threat, feeds into that contest between a supply shock and a demand response.
How Brent Got Here: $110 Peak, $98 Trough, $105 Rebound
The past two weeks trace the entire supply story in miniature. On September 11, drones launched from Iraq damaged Saudi Arabia's East-West pipeline, and a pumping station caught fire. Riyadh shut the line as a precaution. That pipeline carries crude from the Eastern Province to the Red Sea port of Yanbu with a capacity of 7 million barrels a day, letting Saudi exports bypass the Strait of Hormuz entirely.
The market priced the loss fast. On Monday, September 14, Brent jumped 4.83% to $109.44 intraday, nearly touching $110, before settling at $105.68. Traders viewed the pipeline as supplying 30% to 40% of crude out of the Gulf. Brent settled at $108.75 on Tuesday, September 15, after Saudi Arabia told some European customers that September deliveries were cancelled. October WTI crossed $100 for the first time since May and traded as high as $102.61.
The retreat began on September 16. U.S. officials said the outage would last days rather than weeks, and Brent fell 2.7% to settle at $105.83 while WTI shed 3.2% to $102.43. Saudi Aramco started moving barrels by sea through shuttle vessels and ship-to-ship transfers, so physical exports didn't fall as far as the headline suggested. The restoration timeline shortened to half capacity in days and full capacity in six weeks.
The slide continued for six sessions. Brent closed at $104.82 on September 17 and fell to $102.41 on September 18. By Tuesday, September 22, it had closed below $100 and traded in the $98 to $99 range as U.S.-Iran talks at the United Nations raised hopes for de-escalation. On Wednesday, it fluctuated near $100 as Saudi Arabia prepared to restart exports through the pipeline in the coming days.
Wednesday brought a sharp intraday reversal. WTI fell 0.97% to $89.64 early on de-escalation hopes, then swung to $91.92 by mid-morning, up 1.55%, after an armed group shut a pipeline valve at Libya's El Sharara field. That $2.28 swing in a few hours showed how little spare room the market has. Brent traded at $101.64, up $2.39, by 10:37 a.m. ET.
Thursday extended the rebound past $105. From the $98 trough to Thursday's high, Brent has recovered more than $6 in two sessions. That speed is the defining feature of this market: with inventories depleted, prices move in large steps in both directions.
Iran's Red Sea Threat and the Hormuz Blockade
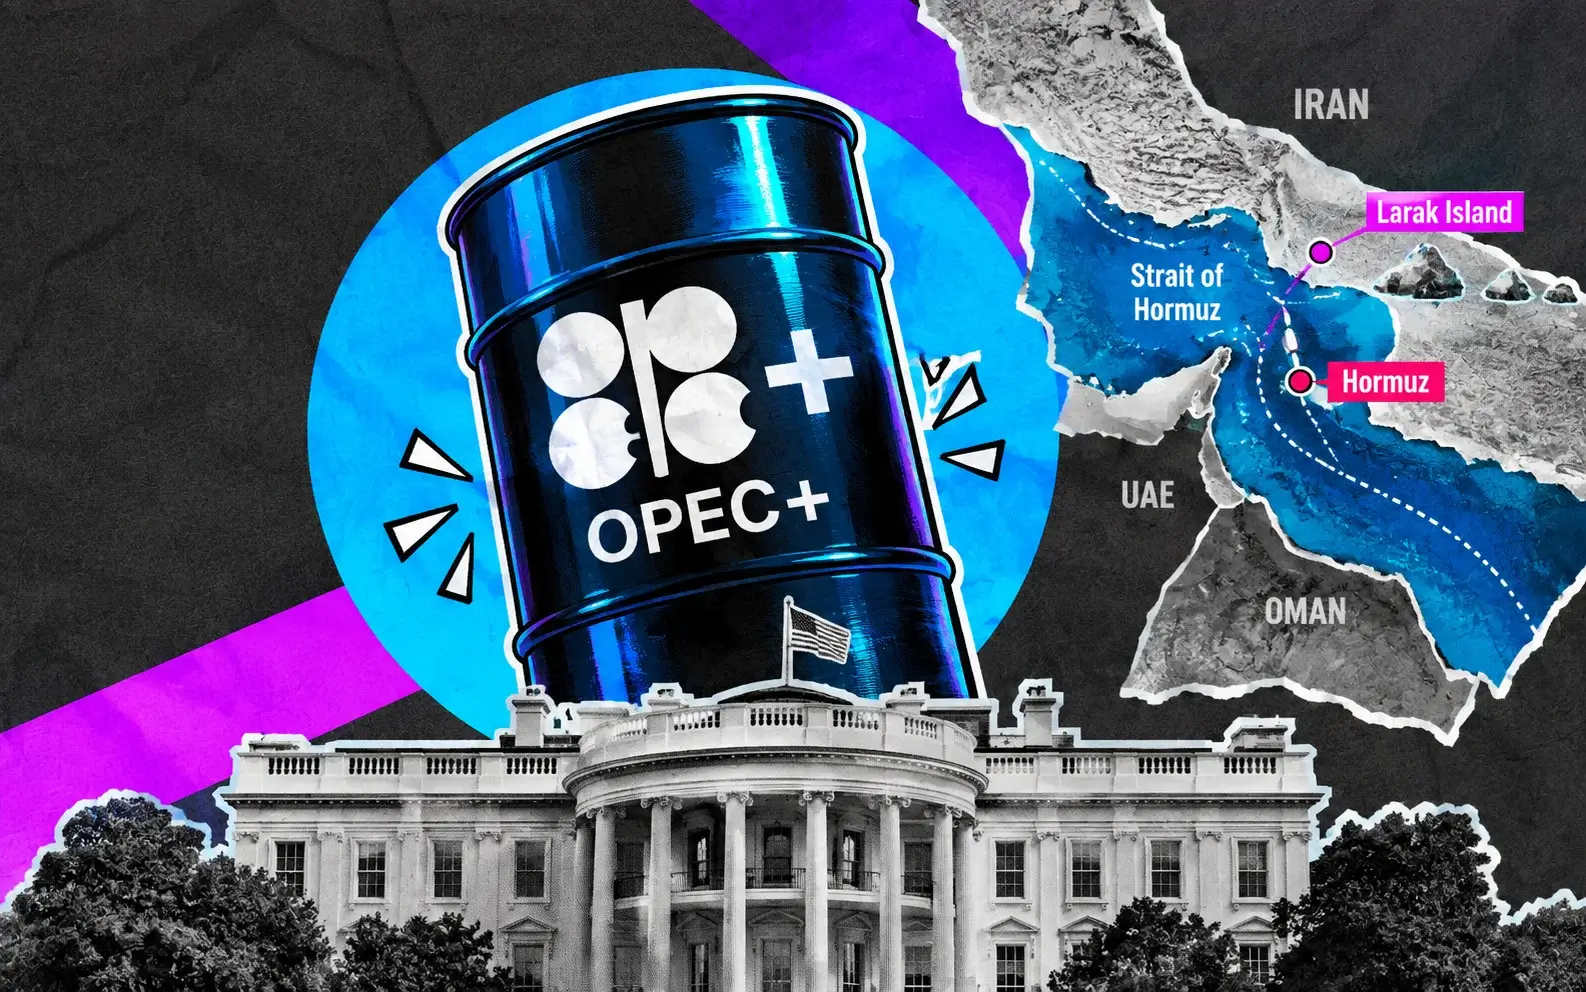
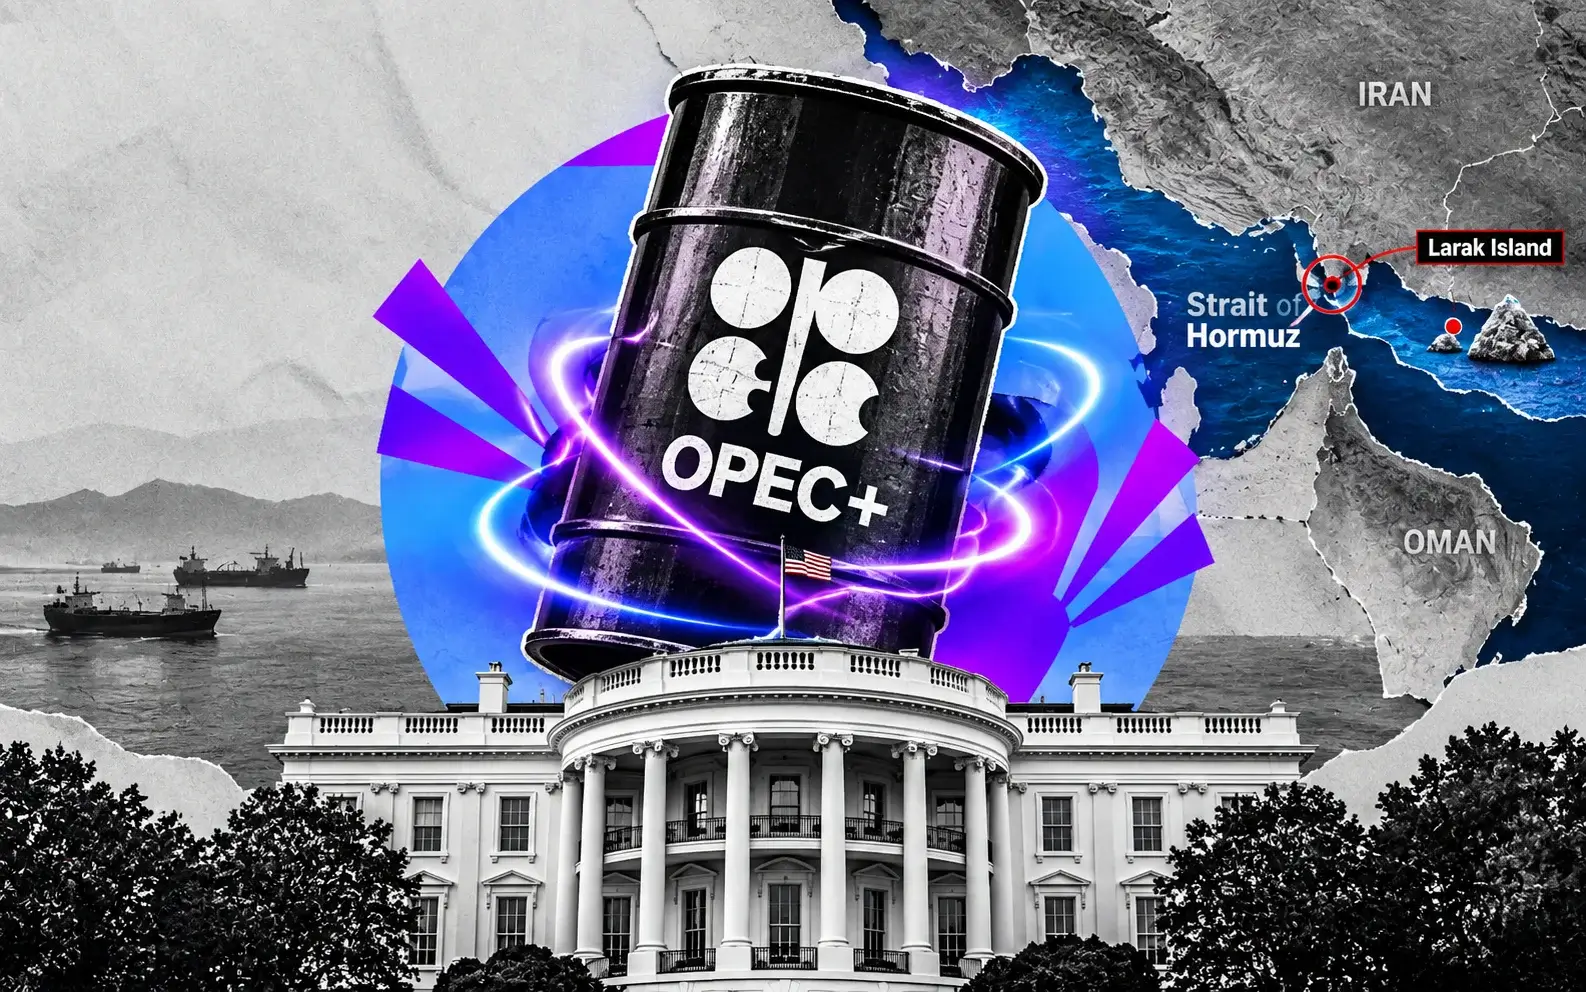
The trigger for Thursday's rally sits in Tehran's escalating rhetoric. Iran's senior adviser warned that Iranian forces and Houthi allies could respond to any new U.S. attack by opening a new front targeting Red Sea energy supplies. That threat ties the Persian Gulf and Red Sea theaters together, putting both the Strait of Hormuz and the Bab al-Mandab strait in play at once.
The context makes the threat credible. Pezeshkian told the UN General Assembly that Tehran would never surrender, a day after President Trump threatened to annihilate Iran from the same podium. The Iranian president said Iran was ready to resume talks but would not respond to threats, and that it would keep restricting navigation through Hormuz while U.S. sanctions and a blockade remain. U.S. and Iranian officials met for three hours on the assembly sidelines this week, but no path to reopening the strait emerged.
The shipping war is already active. On Wednesday, the Antigua and Barbuda-flagged bulk carrier Cape Dao was struck in the Strait of Hormuz, killing one crew member and forcing the evacuation of 27 others. Iran's Revolutionary Guard circulated video it said showed the aftermath. At least two tankers came under attack in the strait during mid-September.
Hormuz flows are severely constrained. Daily flows through the chokepoint have been choppy and have averaged roughly half of pre-conflict levels. The strait normally carries a fifth of global oil consumption, so halving its throughput removes a volume of supply no other producer can replace quickly.
Diplomatic efforts have produced little. Earlier in the conflict, reports that Oman and Iran were coordinating a toll for tankers crossing Hormuz briefly eased prices, but the optimism faded. Gulf states postponed planned talks with Iran in mid-September, and Iran has ruled out reopening the strait or returning to negotiations until Washington meets conditions including an end to the war and the release of frozen assets.
For oil prices, the threat matters because the Red Sea is the escape valve. Saudi Arabia routes exports to Yanbu specifically to avoid Hormuz. If Iran and the Houthis attack Red Sea shipping, that escape route closes too. A market that has adjusted to half-capacity Hormuz flows has no second fallback. That is why a verbal threat moved Brent $5 on Thursday.
The Houthis and the Bab al-Mandab Chokepoint
The Red Sea threat carries weight because the Houthis already control key ground along it. The Iran-backed group has reportedly seized the strategic Perim Island in the Bab al-Mandab strait after taking the port city of Mokha on Yemen's western coast. Those advances give the militants a stronger position to disrupt traffic through the strait that connects the southern Red Sea to the Gulf of Aden and global markets.
The Houthis have been escalating for months. They declared a maritime embargo of Saudi Arabia in July, seeking to control tanker traffic through Bab al-Mandab, which has served as the main alternative route for Saudi crude exports while Hormuz remains disrupted. In mid-September, Houthi forces struck energy facilities and civilian sites in Saudi Arabia, injuring more than 70 people according to Saudi state media. They also attacked sensitive sites in Riyadh with missiles and drones.
The geography makes the threat acute. Saudi crude pumped west through the East-West pipeline loads at Yanbu on the Red Sea. Tankers heading to Asia must then pass south through Bab al-Mandab. Tankers heading to Europe go north through the Suez Canal. Houthi control of Perim Island puts the southern exit directly under threat, which means Saudi exports to Asia, the kingdom's largest market, face disruption even if the pipeline runs at full capacity.
The combined effect is a squeeze on both of the Gulf's export routes. Hormuz handles half its normal flow. The East-West pipeline is still recovering from the September 11 attack. And the Red Sea exit for pipeline crude now faces a declared embargo backed by Houthi positions on the strait itself. No other region can replace the lost Gulf barrels at short notice.
Shipping insurance and freight costs add a hidden premium. Every tanker crossing a war zone pays higher war-risk insurance and demands higher freight rates. Those costs push delivered prices above benchmark futures, and physical buyers in Asia and Europe feel the squeeze first.
For the forecast, the Houthi position turns Iran's rhetoric into a credible operational threat. If Houthi forces begin attacking tankers in Bab al-Mandab, Brent would likely retest the $110 September high quickly. If the threat stays verbal while Saudi Arabia restores pipeline flows, the premium could fade back toward $100. The difference between those paths is whether the first tanker gets hit.
Saudi East-West Pipeline: Restart Versus Risk
Saudi Arabia's response to the pipeline attack is the main force that pulled Brent from $110 to $98. The kingdom is preparing to restart exports through the East-West pipeline in the coming days, potentially letting it bypass Hormuz again and lift outbound shipments. The restoration plan calls for half capacity within days and full capacity in about six weeks.
The pipeline's scale explains the market's sensitivity. With a full capacity of 7 million barrels a day, it moved 6 to 7 million barrels daily before its closure, a volume equal to the total output of most OPEC members. More than 4 million barrels a day of export capacity was put at risk by the shutdown, forcing additional volumes toward Hormuz, where flows already run at half their normal pace.
Saudi Arabia adapted quickly. Aramco rerouted barrels through Hormuz using shuttle vessels and ship-to-ship transfers. That kept export volumes from collapsing, but it also put those barrels back through the chokepoint the pipeline exists to avoid. The workaround bought time but increased exposure to Iranian action in the strait.
The damage assessment remains uncertain. Satellite imagery showed fire-damaged structures and blackened ground at a pumping station after the September 11 attack. Some analysts argued the line could stay impaired for weeks rather than days, contradicting U.S. official assurances. Riyadh has not disclosed a full damage assessment.
The restart creates a two-way risk. If the pipeline returns to full service on schedule, Saudi Arabia can move up to 7 million barrels a day to the Red Sea, easing pressure on Hormuz and supporting a return toward $100 or below. But the Red Sea threat means restored pipeline flows still face the Bab al-Mandab gauntlet on their way to Asia. A working pipeline feeding a blockaded strait solves only half the problem.
The pipeline's vulnerability to drones launched from Iraq adds another layer. The attack that shut it came from a third country, showing that Iran's network of allied groups can strike Saudi infrastructure from multiple directions. Any repeat attack would send Brent back toward $110 regardless of restoration progress.
For the forecast, the pipeline sets the downside pace. Each milestone in the restart, from half capacity to full flows, removes part of the supply premium. The October 6 government outlook will likely incorporate the latest restoration timeline.
EIA Weekly Data: A 3 Million-Barrel Crude Build and Tight Products
The latest U.S. inventory data sent a mixed signal. According to the EIA's Weekly Petroleum Status Report, crude inventories rose by 3 million barrels to 426.4 million in the week ended September 18. Analysts had expected a draw of 641,000 barrels. The build brings commercial crude stocks to 2% above the five-year average for this time of year. The industry's preliminary tally a day earlier had shown a smaller build of 1.786 million barrels.
Cushing, the WTI delivery hub, added to the bearish read. Stocks there rose by 2.2 million barrels to 23.7 million. Rising Cushing inventories tend to weigh on WTI directly, since they loosen supply at the contract's delivery point. That helps explain why WTI trades so far below Brent.
Refinery activity dropped sharply. Crude runs fell by 519,000 barrels a day, and utilization slipped 2.8 percentage points to 94%. Lower refinery demand for crude is the main reason crude stocks built. Seasonal maintenance typically cuts runs in late September, so the drop reflects the calendar as much as weak demand. Net U.S. crude imports rose by 369,000 barrels a day.
Refined products told the opposite story. Gasoline stocks fell by 1.7 million barrels to 206 million, against expectations for a 100,000-barrel build. Distillate stocks, which include diesel and heating oil, dropped by 400,000 barrels to 107.4 million, and they now sit 12% below the five-year average. That shortfall is the tightest spot in the U.S. petroleum system.
The distillate squeeze matters for prices and policy. Diesel powers freight, farming and industry, and a 12% inventory deficit heading into heating season leaves little room for disruption. That tightness explains why President Trump has floated a diesel export ban as fuel prices climb ahead of November's midterm elections. The oil industry warns a ban would backfire and worsen the global fuel crisis by pulling U.S. supply from export markets.
The market's reaction to the data was muted. Futures changed little after the release, because the geopolitical headlines outweighed a single week of U.S. inventory data. The report's message is that the U.S. is not short of crude, but it is short of the refined products consumers actually buy. The next weekly report on Wednesday, September 30, will show whether the crude build was a one-week maintenance effect or the start of a trend.
Global Inventories: 400 Million Barrels Drawn This Year
The global supply picture explains why every headline moves prices so sharply. According to the EIA's September Short-Term Energy Outlook, global oil inventories have fallen by an estimated 400 million barrels so far in 2026. The agency expects stocks to keep falling through the end of the year.
The pace of the draws has been extraordinary. The EIA estimates global inventories fell by an average of 3.9 million barrels a day in the second quarter of 2026. It projects a further drop of 3.0 million barrels a day in the third quarter and 1.7 million barrels a day in the fourth quarter. For context, a draw of 1 million barrels a day sustained over a year is considered a severe shortage.
The draws stem from Middle East disruptions. Total exports from the Middle East remain constrained, forcing more production shut-ins in the region because producers can't move the crude they pump. The EIA expects those disruptions to keep regional production below pre-conflict levels until the second quarter of 2027.
The government forecast frames the price path. The Brent spot price averaged $91 a barrel in August, $7 higher than in July. The EIA forecasts Brent will average $90 in the second half of 2026, an $8 upward revision from its August outlook. As Middle East exports gradually recover, it expects prices to fall to an average of $77 by the second quarter of 2027 and $67 in the second half of 2027 as inventories begin rebuilding.
The forecast carries a clear caveat. The EIA expects continued volatility in flows through Hormuz and alternative routes, and warns that short-term price movements will likely be more volatile than its forecast implies. With Brent trading above $105 against a $90 second-half forecast, the market is pricing more disruption than the agency's baseline assumes.
The inventory depletion is the core of the bullish case. With 400 million barrels already drawn and more to come, the market has lost the buffer that normally absorbs supply shocks. When stocks are ample, a pipeline outage or tanker attack moves prices a few dollars. When stocks are thin, the same event moves prices $10. That dynamic explains the $110 spike, the $98 trough and Thursday's $105 rebound, all within two weeks.
For traders, the takeaway from the inventory data is that volatility is structural, not temporary. Until shut-in Gulf production returns and inventories start rebuilding, oil will keep swinging on every headline.
Demand Destruction and a 5.15% Treasury Yield
The bearish forces in the oil market sit on the demand side, and they are gathering strength. The 10-year Treasury yield pushed to 5.15% on Thursday, its highest since July 2007, as markets priced more Federal Reserve tightening. Fed funds futures now price a 75.3% chance of an October hike and a 58.6% chance of another in December. New York Fed President John Williams said Thursday that another rate increase before year-end is a reasonable expectation.
Higher rates slow economies, and slower economies use less oil. The Fed's tightening cycle is aimed directly at the inflation that oil prices helped create. Energy costs feed into transportation, manufacturing and food prices, and the Fed is responding by raising borrowing costs until demand cools. Every hike increases the odds that oil demand weakens in 2027.
The dollar adds pressure. The U.S. Dollar Index climbed to 100.80, its highest since July 30. Oil is priced in dollars, so a stronger greenback makes crude more expensive for buyers paying in euros, yen and yuan. That dents demand at the margin, particularly in emerging markets that import most of their oil.
Demand destruction is already visible. Earlier in the conflict, the market absorbed the supply shock through larger-than-expected demand losses, with China providing a case study in reduced consumption as prices climbed. High prices do their own work: consumers drive less, airlines trim routes and industry shifts to cheaper fuels.
The U.S. data shows early signs. The average 30-year mortgage rate reached 7.12%, the highest in more than two years, and consumers face both higher borrowing costs and higher fuel costs. McDonald's warned this week that high inflation and flat traffic will keep weighing on restaurants. Darden's shares fell 6.6% on a revenue miss. Consumer spending pressure eventually shows up in gasoline demand.
The U.S. economy, though, is running hot for now. The September composite PMI jumped to 58.4, the strongest since July 2021, and weekly jobless claims fell to 197,000. Strong growth supports oil demand in the near term, even as it pushes the Fed toward more tightening.
For the forecast, demand is the slow-moving force that will eventually cap prices. It won't stop a supply-driven spike to $110 if the Red Sea closes. But it will limit how long prices can stay above $100 if the supply picture stabilizes, and it is the main reason the government forecast calls for Brent to fall toward $77 by mid-2027.
Libya, OPEC+ and the Spare Capacity Question
Beyond the Gulf, other supply sources add fragility rather than relief. On Wednesday, an armed group shut a pipeline valve at Libya's El Sharara field, one of the country's largest oil producers. The closure lifted WTI $2.28 in a few hours and showed that North African supply remains vulnerable to domestic conflict. Libya's output has swung repeatedly over the past decade as rival factions fight over oil revenue.
The Libyan disruption compounds the Gulf shortfall. When markets are well supplied, a Libyan outage barely registers. With global inventories down 400 million barrels this year, even a partial loss of El Sharara's output tightens balances enough to move prices. The field's restart timeline will matter for European refiners, who rely heavily on Libyan light crude.
OPEC+ faces its own constraints. Earlier in the conflict, the group considered a potential output increase, though any extra supply was unlikely to reach markets quickly. The problem is geography: much of OPEC's spare capacity sits in the Gulf, behind the same chokepoints that are disrupted. Saudi Arabia and the United Arab Emirates hold the largest spare capacity, but pumping more crude does little good if it can't reach buyers.
That leaves non-Gulf producers as the swing supply. U.S. shale, Brazil, Guyana and Canada can add barrels without passing through Hormuz or Bab al-Mandab. U.S. crude inventories building by 3 million barrels last week and net imports rising by 369,000 barrels a day show that Atlantic Basin supply remains available. That is the main reason WTI trades $11 below Brent.
Strategic reserves offer limited cushion. The U.S. Strategic Petroleum Reserve fell to its lowest level since April 1983 earlier this summer after emergency releases. Europe holds 90 days of net imports in strategic stocks under EU rules, but its working commercial buffer above that floor is thin, particularly for jet fuel and diesel.
The spare capacity picture points to one conclusion: the world has few tools left to offset a further Gulf disruption. OPEC's spare barrels are trapped. Strategic reserves are depleted. Atlantic Basin producers can help at the margin but can't replace millions of barrels a day on short notice. That scarcity is the foundation of the $100 floor on Brent.
WTI at $93.96: The Brent Spread and U.S. Crude
West Texas Intermediate is telling a different story from Brent, and the gap matters for U.S. traders. WTI traded at $93.96 on Thursday, up 1.95%, while Brent pushed past $105. The spread between the two benchmarks now exceeds $11, compared with $3 to $5 before the war.
The spread reflects geography. Brent prices seaborne crude from the North Sea and serves as the benchmark for oil traded across the Atlantic and into Asia. It carries the full premium for Middle East shipping risk, since buyers of seaborne crude compete directly for the barrels that no longer flow through Hormuz. WTI prices crude delivered at Cushing, Oklahoma, and reflects U.S. inland supply and demand.
U.S. balances are looser. Crude inventories rose by 3 million barrels to 426.4 million last week, 2% above the five-year average. Cushing stocks climbed 2.2 million barrels to 23.7 million. Refinery runs fell by 519,000 barrels a day as seasonal maintenance began. That combination leaves more crude sitting in U.S. tanks, which weighs on WTI relative to Brent.
The WTI futures curve shows the market's expectations. October WTI traded as high as $102.61 in mid-September and settled above $100. The November contract, now the front month, trades near $94. That gap signals backwardation: nearer contracts trade above later ones, reflecting tight prompt supply and an expectation that prices will ease as disruptions resolve.
Export economics tie the benchmarks together. A wide Brent-WTI spread makes U.S. crude exports more profitable, since traders can buy at Cushing and sell into the seaborne market at a premium. That pulls barrels out of the U.S., which should narrow the spread over time. But export capacity at Gulf Coast terminals caps how fast that arbitrage can close the gap.
The key WTI levels are clear. Support sits at $91.83, Wednesday's close level, and $89.64, Wednesday's intraday low. A break below $89.64 would signal that U.S. supply has overpowered the geopolitical premium. Resistance sits at $95, then $100, the level WTI crossed in mid-September for the first time since May. A return above $100 would require a fresh Gulf disruption and a narrowing of the Brent spread.
For U.S. consumers, WTI matters more than Brent, because it sets the cost of crude for domestic refiners. The gap between $94 WTI and $105 Brent gives U.S. refiners an advantage over European competitors.
Technical Map: Brent Support at $100, Resistance at $110
The technical picture for Brent follows the supply headlines closely. The first support sits at $100, the round number that Brent broke on Tuesday and reclaimed on Wednesday. That level marks the line between a market pricing ongoing disruption and one pricing a return to stability. A daily close back below $100 would signal that pipeline restoration and demand destruction are winning.
The second support is the $98 to $99 zone, Tuesday's trough after six straight losing sessions. That level marks the low of the post-pipeline-attack decline and sits $6 below Thursday's high. A break below $98 would open the path toward $95, and then the $90 area that matches the government's second-half average forecast.
On the upside, the first resistance sits at $105.83, the September 16 settlement after U.S. officials downplayed the pipeline outage. Thursday's push past $105 is testing that level now. A close above it would put the $108.75 September 15 settlement in reach.
The major resistance is $109.44 to $110, the September 14 intraday peak when the pipeline closure first hit. That level also sits near the April highs, when Brent futures soared above $109 for the first time in nearly four years. A break above $110 would signal a new phase of the supply shock, likely triggered by an actual attack on Red Sea shipping.
The extreme upside reference is the dated Brent spike in April, when physical cargoes traded above $140 a barrel, the highest since 2008. Futures never came close to that level, but the physical market showed how high prices can go when prompt supply disappears. That scenario would require a full closure of both Hormuz and Bab al-Mandab.
The momentum picture favors volatility over direction. Brent has swung from $110 to $98 and back to $105 in eight sessions, a range of 11%. That behavior reflects a market driven by headlines rather than trend, with traders reacting to each report on pipelines, tankers and diplomacy. Technical levels hold until the next geopolitical event overrides them.
The practical framework is a $100 to $110 range with headline-driven breakouts. Traders buying near $100 and selling near $108 have been rewarded. The risk is that a single event, such as a tanker strike in the Red Sea or a breakthrough in U.S.-Iran talks, breaks the range decisively in either direction.
Read More
-
Yen Stalls at 160 Despite a 3% JGB and Tokyo Core CPI at 2.0% — Intervention Sits at 164, Friday's Payrolls Decide
02.09.2026 · TradingNEWS ArchiveEnergy
-
Microsoft Rebounds From $491 Low as $678B Backlog and Positive Free Cash Flow Shield It From 5.15% Yields
24.09.2026 · TradingNEWS ArchiveStocks
-
XRP Slides to $1.50 After $1.66 Peak as Escrow Supply Meets $20M Daily ETF Bid, With $1.70 in Reach
24.09.2026 · TradingNEWS ArchiveCrypto
-
Gold Tests $4,225 Fibonacci Floor at $4,254 as Real Yields Surge to 2.76% and Fed Hike Odds Reach 75.3%
24.09.2026 · TradingNEWS ArchiveCommodities
-
Nasdaq Falls to 26,804, S&P 500 Drops to 7,688, Dow Sheds 191 Points as Oracle Tumbles 7% on Project Jupiter Notice
24.09.2026 · TradingNEWS ArchiveMarkets
-
Euro Sinks to 1.1380 on 125–150bp ECB-Fed Rate Gap as RSI Hits Oversold 25.47
24.09.2026 · TradingNEWS ArchiveForex
Energy Stocks, Refiners and the Diesel Crunch
The oil rally is feeding directly into energy equities, which have become one of the few sectors outperforming in a rate-driven selloff. On Thursday morning, Energy ranked among the leading sectors in the S&P 500 alongside Communication Services and Health Care, while Technology, Industrials and Consumer Discretionary lagged. Natural gas producer Antero Resources caught a bid in the prior session, and Chevron gained 1.38% on Wednesday even as the Dow fell 352 points.
Producers benefit most from the Brent premium. Companies with international production, such as Exxon Mobil and Chevron, sell into the seaborne market at Brent-linked prices. Those with U.S. inland production earn WTI prices, which trail Brent by $11. The spread gives globally diversified majors an earnings edge this quarter.
Refiners face a more complex picture. The diesel squeeze, with U.S. distillate stocks 12% below average, keeps refining margins elevated. U.S. refiners buying cheaper WTI crude and selling products into global markets priced off Brent capture a wide margin. But the threat of a diesel export ban hangs over that trade. If the administration restricts exports, refiners would lose access to higher-priced foreign markets and face a domestic glut of products.
Delek US Holdings announced plans to sell $400 million in convertible senior notes due 2031 on Thursday, showing that refiners are tapping capital markets even at higher rates. Energy companies are among the few issuers able to raise money easily, given their strong cash flow at current prices.
The energy sector's strength has limits. Oil producers carry debt, and a 5.15% Treasury yield raises their borrowing costs. Service companies depend on drilling activity, which tends to lag price moves by months. And energy stocks price in expected future oil prices, not current spot prices, so the market discounts the $77 average the government forecasts for mid-2027.
The consumer impact shows up elsewhere. Airlines, trucking companies and chemical producers face rising input costs. Trucking stocks have been volatile, and consumer discretionary names led Wednesday's losses. High fuel prices act as a tax on consumers, draining spending from other categories.
For investors, the energy sector offers a hedge against the supply shock. It rises when oil spikes and holds up during rate-driven selloffs in growth stocks. The risk is a sudden de-escalation: a U.S.-Iran deal or a reopened Hormuz would send oil and energy stocks lower in a single session. Energy exposure works as insurance, not as a long-term bet on $105 oil.
Catalysts: EIA Data, the October 6 Outlook and U.S.-Iran Talks
The oil market's calendar is dominated by events that can't be scheduled. Any attack on Red Sea shipping, any breakthrough in U.S.-Iran talks, or any update on the East-West pipeline can move Brent $5 to $10 in a session. Traders need to watch headlines more than data releases.
The scheduled catalysts still matter. The next EIA Weekly Petroleum Status Report arrives Wednesday, September 30. It will show whether last week's 3 million-barrel crude build was a maintenance effect or the start of a trend, and whether distillate stocks keep falling from 12% below average. A second straight crude build would weigh on WTI. Another distillate draw would support the diesel crack and strengthen the case for export restrictions.
The EIA's October Short-Term Energy Outlook lands on October 6. It will update the agency's inventory estimates, its $90 Brent forecast for the second half of 2026 and its view of the East-West pipeline restoration. An upward revision would validate the current premium. A downward revision based on faster Saudi restoration would pressure prices.
The macro calendar matters through the demand channel. Friday brings U.S. durable goods orders and consumer sentiment data. The late-September core PCE release will shape October Fed hike odds, currently at 75.3%. The Fed meets in late October. Faster tightening would strengthen the dollar and weaken the demand outlook, both bearish for oil.
The Trump–Xi summit in Washington on Thursday adds a variable. China is the world's largest oil importer, and the two sides extended their trade truce to January 10. A constructive outcome on trade supports the global growth outlook and oil demand. The Iran war is on the summit agenda, so any shared position between Washington and Beijing on the conflict could shift the diplomatic picture.
U.S. policy decisions carry weight. A diesel export ban would widen the gap between U.S. and international product prices and scramble refining margins. Any decision on renewed U.S. strikes against Iran would push Brent toward $110. Any sign of a ceasefire deal would send it back toward $95.
The Saudi pipeline restoration timeline provides a steady downward pull. Each milestone toward full 7-million-barrel capacity removes part of the premium. For traders, the calendar argues for respecting the $100 to $110 range while staying ready for a headline-driven break.
Oil Price Forecast: $110 Upside, $95 Risk, $100 the Trigger
The forecast comes down to one level and one variable. The level is $100 on Brent, the round number the market broke on Tuesday and reclaimed on Wednesday. The variable is the security of the Gulf's export routes: the Strait of Hormuz running at half capacity, the East-West pipeline recovering from the September 11 attack, and the Bab al-Mandab strait now under Houthi threat from Perim Island.
The bull case needs a physical disruption. Houthi forces attack tankers in Bab al-Mandab, or drones hit the East-West pipeline again, or U.S.-Iran fighting escalates into renewed strikes on Gulf infrastructure. Under that path, Brent clears $105.83 and $108.75 and retests the $109.44 to $110 September peak, 4.8% above Thursday's level. A sustained break above $110 would open a move toward $115 to $120 as inventories keep falling. WTI would push back above $100. Assigned odds: 30%.
The base case is a volatile range. Iran's threats stay verbal, Saudi Arabia restores the pipeline on its six-week schedule and U.S.-Iran talks continue without a breakthrough. Brent trades between $100 and $108, with headline-driven spikes and pullbacks. WTI holds between $89.64 and $97. Month-end Brent target in this path: $102 to $106. Assigned odds: 45%.
The bear case needs de-escalation. A U.S.-Iran ceasefire framework, a reopening protocol for Hormuz, or a faster-than-expected pipeline restoration removes the supply premium. Combined with Fed tightening, a dollar above 101 and rising U.S. crude stocks, Brent breaks below $98 and slides toward $95, 9.5% below Thursday's level, then toward the $90 second-half average in the government forecast. WTI falls through $89.64 toward $85. Assigned odds: 25%.
The signals to track are specific. Brent daily closes relative to $100 and $105.83. Any tanker attack in the Red Sea or Hormuz. Saudi statements on East-West pipeline capacity. The September 30 EIA inventory report, particularly distillate stocks. The October 6 government outlook. Fed October hike odds relative to 75.3%.
Verdict: Bullish bias above $100 on Brent, with the range intact between $100 and $110. The physical market is too tight to support a sustained drop below $100 while Hormuz runs at half capacity and the Houthis sit on the Bab al-Mandab. Global inventories are down 400 million barrels this year, and distillate stocks sit 12% below average. But demand destruction, a 5.15% Treasury yield and the Saudi pipeline restart cap the upside unless a new physical disruption hits. A daily Brent close above $110 extends the target to $115. A daily close below $98 flips the call to bearish with a $95 target. Until one of those triggers fires, oil is a buy-near-$100, sell-near-$108 trade, with Tehran and the Houthis holding the key.