Crude Rebounds to $77 as Hormuz Talks Stall: $10 Risk Premium Sits on a Balance Turning to Surplus
More than 10 million barrels a day of Gulf production remains shut in | That's TradingNEWS
Key Points
- WTI trades at $77.91 and Brent at $83.40 after crude swung roughly 10% this week.
- Brent is forecast at $74 in Q3 and $70 in Q4 2026, then $65 in 2027 on supply restoration.
- Iran's draft demands a 20% cargo-value penalty and bars US and Israeli vessels from Hormuz.
WTI for September delivery traded at $77.91 Friday, up 0.8%, while Brent gained 1.1% to $83.40. Both benchmarks are climbing off a week that had already delivered one of the most violent round trips of the year — crude fell more than 5% in each of two consecutive sessions early in the week on deal optimism, dropped roughly 10% at its worst, then reversed hard once the terms of the proposed Hormuz arrangement turned out to be materially stricter than the market had priced.
The sequence matters. Brent traded around $81 Thursday after three straight sessions of losses, then extended more than 4% to $82.80 as reports emerged that an Iranian parliamentary committee was analyzing a draft proposal for shipping through the strait. It pushed above $83 Friday after Iran struck what it described as hostile targets following explosions reported near Qeshm Island. WTI moved from below $76 Wednesday to around $75 Thursday to $77.91 Friday.
The dollar did its part. July payrolls printed minus 23,000 against an 80,000 consensus, September Fed hike odds collapsed from 67% a week ago to 44%, the 10-year Treasury yield fell to roughly 4.60% from 4.67%, and the greenback sold off. A weaker dollar mechanically lifts dollar-denominated crude, and it lifted it into a session where the geopolitical bid was already firm.
Put the level in context against the year. Brent traded below $68 on February 1. The war began February 28. March delivered a 50% rally — one of the steepest monthly moves on record — and Brent printed $113.52 on March 23. April 7 saw $138 a barrel, the highest since the 2022 energy crisis, with dated benchmarks touching past $140 at one point, the highest since 2008. WTI peaked at $119.48 on March 9 and breached $100 on March 23.
Then it all came back. Brent averaged $103 in the second quarter — $117.29 in April, $107.14 in May, $85.40 in June — and dropped below $70 on July 1, roughly where it sat when the conflict began. July delivered another 20% surge on renewed hostilities.
At $83.40, Brent sits 39.6% below its April peak and 22.7% above its July low. That is not a market with a view. That is a market pricing a negotiation.
The Iran-Oman Draft Is the Only Thing That Matters
The physical balance is turning bearish and everyone knows it. The reason crude is at $83 rather than $70 is a single unresolved diplomatic file.
Iran and Oman — the two states bordering the Strait of Hormuz — reached an agreement on a temporary shipping route. A joint statement is under review and in final drafting, with the proposed route expected to remain operational for two to four months. Tehran has been explicit that the arrangement does not amount to a full reopening of the waterway.
Separately, the United States, Iran and Oman have been reported close to a 60-day interim agreement to reopen the strait without tolls, with Washington aiming to announce it as early as midweek. That report is what drove the 5%-plus daily declines. The announcement did not materialize.
Then the draft terms leaked, and they were harsher than the market had assumed. Tehran seeks to prohibit US and Israeli vessels from transiting Hormuz entirely. Countries deemed hostile would be required to pay compensation before being granted passage. Violators would face penalties equal to 20% of the value of the cargo carried. And full reopening would be contingent on the lifting of the US maritime blockade of Iranian ports.
The Iranian parliament is currently reviewing that draft. Public accounts differ over whether the negotiations amount to a genuine reopening at all.
That gap between what was priced Wednesday and what was disclosed Thursday is the entire week's price action. Traders who had begun stripping the conflict premium put it straight back on.
The security backdrop deteriorated alongside. The UK Navy reported explosions near a tanker transiting the strait. Houthi forces in Yemen claimed attacks on Saudi troop positions and said they had targeted a Saudi oil tanker in the Gulf of Aden, with threats against additional vessels in the Red Sea. US officials continued to express confidence that a nuclear agreement is within reach, while investors stayed skeptical about the durability of any lasting peace.
For anyone modeling crude here, the honest framing is that the physical supply outlook and the price are being driven by two different variables. The balance says $70. The transit risk says $83.
Hormuz Has Been Closed Since February 28, and the Damage Is Historic
The scale of what happened this year is easy to lose in the daily price noise, and it explains why the premium refuses to compress.
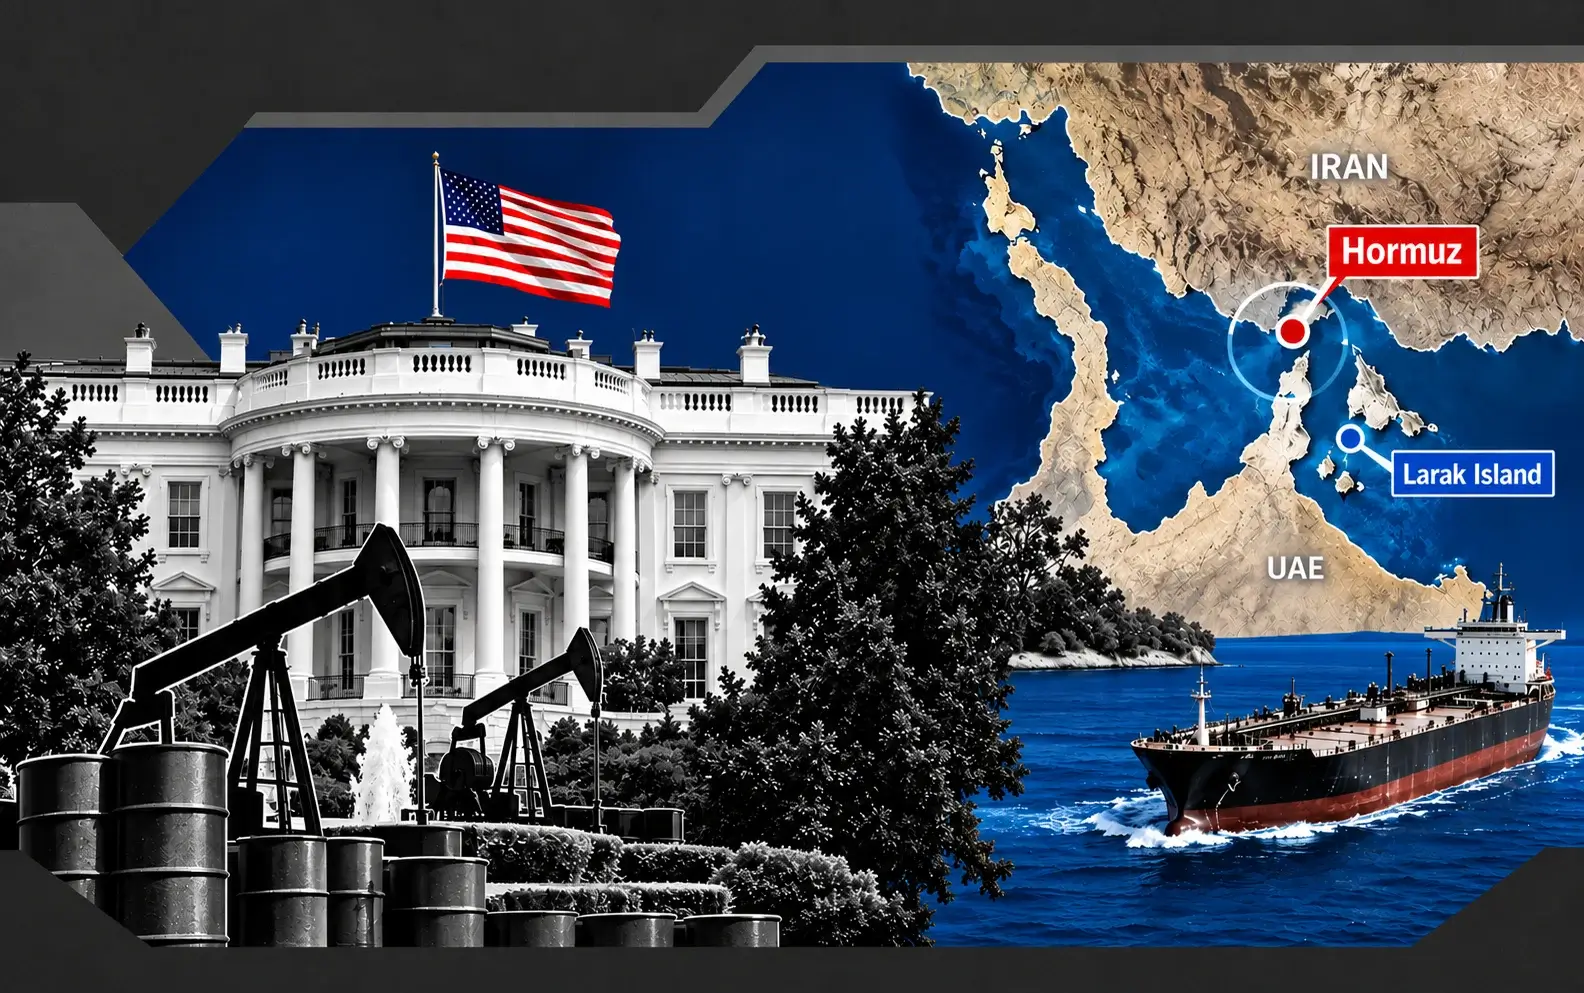
The Strait of Hormuz — through which roughly 20% of global oil supply flows — has been effectively closed to shipping traffic since February 28. The closure triggered simultaneous production shut-ins exceeding 10 million barrels per day across six Gulf producers as storage capacity filled and tankers could not load. Energy infrastructure across nine nations sustained damage to at least 40 assets since hostilities began.
That disruption was characterized as the largest in oil market history, with the crisis compared to both 1970s oil shocks occurring at once. Member countries agreed to a 400 million barrel release from strategic stockpiles — a coordinated intervention on a scale not seen in decades.
Physical damage compounded the transit problem. Saudi Arabia said its production capacity had been reduced by roughly 600,000 barrels per day following attacks on energy facilities, and a major pipeline designed to bypass the Strait of Hormuz was also struck. Those bypass routes matter enormously: Saudi and Emirati pipelines carry approximately 2.6 million barrels per day of capacity around the chokepoint, which is the only reason the shut-in was 10 million bpd rather than substantially more.
Traffic has remained impaired even through the ceasefire windows. In the first 24 hours of the April ceasefire, only one oil products tanker transited the strait. GPS jamming and missile threats disrupted roughly 90% of typical traffic through the spring. Vessel traffic has fallen sharply as Iran continues targeting tankers that disregard its demands.
A June 18 memorandum of understanding between the United States and Iran supported an interim ceasefire and a recovery in tanker traffic. Renewed hostilities in July demonstrated how fragile that improvement was.
So the market is now on its third attempt at pricing a resolution. February to April was escalation. April to June was ceasefire optimism collapsing twice. June to July was the MOU and its unraveling. August is attempt number four, and the pattern of every prior attempt has been the same: prices crater on the announcement, then recover most of the decline within two weeks when implementation fails.
That history is precisely why $83 will not break to $70 on a headline. It needs tanker counts.
The EIA's Q3 Forecast Sits $9 Below Spot Brent
The most quantifiable disagreement in the oil market right now is between the physical balance forecast and the screen.
Per the July Short-Term Energy Outlook, Brent is forecast to average $74 a barrel in the third quarter of 2026 — a $27 downward revision from the prior month's projection. Brent is modeled to fall from a $103 average in Q2 to $70 in Q4, which is $19 below the June forecast. And the 2027 average is put at $65, $15 lower than the June estimate.
Brent traded at $83.40 Friday. That is $9.40 above the Q3 forecast with two months of the quarter remaining, and $13.40 above the Q4 projection.
The reasoning behind those numbers is straightforward. Following the June 18 MOU and increased traffic through the strait, expectations for global oil production were raised. Most crude output is now modeled to return to near pre-conflict averages by the end of this year, with the majority of shut-in production back online in the first quarter of 2027. More production plus reestablished trade flows means less oil drawn from inventory than previously forecast, and moderating inventory draws push prices lower.
Restocking of strategic and commercial reserves is expected to attenuate the decline. That 400 million barrel strategic release has to be replaced, and that replacement demand is a floor under the forecast rather than a source of downside.
The next update lands August 11, alongside monthly reports from other major agencies. Given that Brent has spent the intervening five weeks between $70 and $83 rather than trending toward $74, and given that the Iranian parliamentary draft is stricter than anticipated, an upward revision to the Q3 number is the likely outcome.
Note what the forecast implies about the risk premium. If the underlying balance supports $74 Brent in Q3, then spot at $83.40 embeds roughly $9 of transit and insurance risk. On WTI at $77.91, the equivalent premium is around $10 to $13 — and one analysis has argued that removing the geopolitical premium entirely from a market with this surplus trajectory would put WTI below $60.
That is the trade. Not the direction — the size of the premium.
Ten Million Barrels of Shut-In Supply Are the Overhang
The bear case is arithmetic, and it is large.
More than 10 million barrels per day of production was shut in across six Gulf producers when Hormuz closed. That capacity did not disappear — it was warehoused. Wells were curtailed because there was nowhere to put the oil, not because the reservoirs stopped working. Every barrel of that shut-in capacity returns to the market the moment transit normalizes, and the restoration timeline now runs through the first quarter of 2027.
Set that against a demand backdrop that has been genuinely damaged. Global oil consumption is forecast to decrease by an average of 1.2 million barrels per day in 2026, with 800,000 barrels of that decline coming from non-OECD countries — the demand destruction from six months of triple-digit prices and disrupted Asian supply chains. Consumption is modeled to rebound 2.0 million bpd in 2027 to 104.8 million bpd, which would sit 800,000 bpd above the 2025 average.
Read those two numbers together. Ten million bpd of supply comes back over roughly twelve months into a market where demand fell 1.2 million bpd this year and recovers 2.0 million next. Even with the strategic reserve refill absorbing volume, the balance turns to surplus and stays there through 2027.
A record global surplus of 4.0 million bpd had been forecast for 2026 before the war began. The conflict inverted that projection into a deficit. Its resolution restores the original problem with a year's delay and a demand base that is smaller than the pre-war path.
That is why the 2027 Brent forecast sits at $65 and why one inference from the benchmark spread and surplus trajectory puts fair-value WTI below $60 absent the geopolitical premium.
The counterargument is timing and execution. Restarting curtailed offshore and onshore production after six months of shut-in is not a switch. Reservoir damage, workover requirements, and infrastructure repairs across at least 40 damaged energy assets in nine countries mean the ramp will be slower and lumpier than a spreadsheet implies. Saudi capacity alone is down roughly 600,000 bpd from physical attacks.
So the surplus is coming. The question is whether it arrives in Q4 2026 or mid-2027, and that difference is worth $15 a barrel.
The Physical Signals Have Already Turned
Forget the headlines and watch what the physical market is doing, because it has been sending a consistent message for two weeks.
US crude inventories rose from their lowest level since 2018. That is the first meaningful build after a sustained drawdown period, and it says the American barrel is no longer being pulled to fill a global shortfall.
Saudi Aramco cut its flagship crude price for Asian buyers. Official selling price reductions to the largest demand region are the cleanest read on how a swing producer sees its own market — a cut signals expectations of improving regional supply conditions and softer competition for cargoes. Aramco does not discount into a tight market.
Those two data points together are the definition of a physical loosening. Inventories building at the marginal consumer, official prices cut at the marginal producer. Both happened in the same week that crude rallied 4% on parliamentary draft headlines.
Product markets are telling a different story, and it is the one bull argument with real substance. Extreme heat and drought across Europe have been disrupting the energy system — reducing refinery efficiency, forcing cuts to nuclear and hydropower generation, and driving diesel refining margins toward 20-year highs. Twenty-year high distillate cracks pull crude into refineries regardless of the crude balance, because the incentive to run is overwhelming.
That is a genuine offset. Strong crack spreads encourage refiners to buy more crude and process it, which supports the front of the curve even as the underlying supply picture deteriorates. It is also why the whole complex has not simply reverted to $70.
The insurance and freight dimension compounds it. A barrel that must pass through a conflict zone is less certain to arrive on time and costs more to insure and transport. That friction supports WTI near $73 to $78 even while the medium-term balance turns bearish, because the marginal cargo carries a real cost that has nothing to do with the number of barrels available.
Physical loosening plus record product margins plus war-risk freight equals exactly the $77 to $83 range crude has been stuck in.
OPEC+ Has One Move Left, and It Is Small
The cartel's contribution to the balance has almost run out, which removes a variable that traders spent 2024 and 2025 obsessing over.
OPEC+ is expected to implement a final production quota increase of 188,000 barrels per day in September, completing the rollback of its voluntary output cuts. After that the group may pause further increases, though it has retained flexibility to adjust policy depending on market conditions.
One hundred and eighty-eight thousand barrels a day is noise against a 10 million bpd shut-in restoration and a 1.2 million bpd demand decline. The cartel has effectively spent its ammunition on the upside — the voluntary cuts that provided a floor through the 2025 surplus scare are gone.
That has two implications. First, OPEC+ no longer has spare capacity in reserve to cap a price spike. If Hormuz talks collapse and the premium expands, there is no unused quota to release into the market beyond whatever Gulf capacity is restored from shut-in. Second, and more importantly for the medium term, the group has no cuts to reverse if the surplus materializes — it would have to negotiate fresh reductions from a baseline that took two years to unwind.
Cartel discipline under those conditions historically deteriorates. Members who have just spent two years restoring quota are reluctant to give it back, particularly the Gulf producers who lost six months of revenue to a shut-in they did not choose.
So the supply-side backstop that supported the $60s and $70s through 2025 is structurally weaker heading into a 2027 forecast of $65 Brent.
The bypass infrastructure question sits alongside it. Saudi and Emirati pipelines route roughly 2.6 million bpd around Hormuz, and one of those lines was struck during the conflict. Expanding that capacity is the single highest-return investment in Gulf energy infrastructure right now, and any announcement of expansion would be structurally bearish for the transit premium — it reduces the leverage Tehran holds over the chokepoint permanently.
Nothing has been announced. But the incentive is now overwhelming, and a market pricing a $10 premium on a chokepoint should account for the possibility that the chokepoint gets engineered around.
The Payrolls Print Cuts Both Ways for Crude
Friday's macro data was the cleanest two-sided input crude has received in weeks, and the market resolved it bullishly for now.
Payrolls fell 23,000 against an 80,000 consensus, with May and June revised down a combined 103,000 and participation sliding to 61.4%. Average hourly earnings decelerated to 3.2% year over year from a downwardly revised 3.4%. On the demand side that is unambiguously negative — a contracting labor market with falling participation consumes less diesel, less jet fuel and less gasoline.
But the transmission ran through rates and the dollar instead. September Fed hike odds fell from 55% Thursday to 44%, the 10-year dropped to 4.60%, and the greenback weakened. A softer dollar makes crude cheaper for every non-US buyer, which supports the price, and a Fed that stays parked rather than tightening into a slowdown improves the 2027 demand path.
That is why WTI gained 0.8% on a day the US economy shed jobs.
The inflation feedback loop is what makes this genuinely circular. Energy prices are the primary driver of the inflation that had the Fed considering a hike — June CPI ran 3.5% year over year against a 2% target, and eurozone energy inflation hit 10.0% in July. Higher crude raises hike odds, which strengthens the dollar, which caps crude. Lower crude cuts hike odds, weakens the dollar, and supports crude. The system is self-stabilizing in a band, which is exactly the band the market has been trading.
The week ahead breaks it in one direction or the other. The August 11 energy outlook update, monthly agency reports, US July CPI on August 12, and preliminary August inflation expectations all land inside five sessions. Volatility should be elevated throughout.
CPI is the one that matters most. A hot print on energy pass-through pushes hike odds back above 60%, strengthens the dollar, and pressures crude even as it confirms that oil is doing the damage. A soft print takes hike odds below 30% and gives the whole commodity complex the liquidity it has been denied all year — gold already ripped 3.02% Friday on exactly that trade.
Read More
-
Yen Stalls at 160 Despite a 3% JGB and Tokyo Core CPI at 2.0% — Intervention Sits at 164, Friday's Payrolls Decide
02.09.2026 · TradingNEWS ArchiveEnergy
-
CHAT Fund Holds $96.37 as Korean Memory and Chip Exposure Drive a 109.73% Year — Break of $98.02 Opens $105.20
18.09.2026 · TradingNEWS ArchiveStocks
-
First-Generation XRPR and XRPI Ride XRP's Rebound to $1.386 as Spot Funds Post First Outflow — Break of $1.40 Opens $1.54
18.09.2026 · TradingNEWS ArchiveCrypto
-
NG Holds $2.9255 as Storage Surplus Narrows From 5.5% to 3.7% in 3 Weeks — Break of $3.00 Opens $3.15
18.09.2026 · TradingNEWS ArchiveCommodities
-
Dollar Surges to 157.90 as BoJ's Divided Hike Fails to Lift the Yen — Break of 158.87 Opens 159
18.09.2026 · TradingNEWS ArchiveForex
The 2026 Price Arc Is the Best Guide to What Comes Next
Trace the year and the pattern is unmistakable: every de-escalation headline has produced a violent decline that failed to hold.
February 1: Brent below $68 on reports of serious talks. February 27: around $73, near an eight-month high, after US officials left Geneva disappointed. February 28: war begins. March: a 50% rally, Brent above $100, $113.52 on March 23, $115-plus later in the month, WTI $119.48 on March 9 and $100.71 on March 23. Late March: WTI back toward $93 as deadlines extended, ten tankers permitted through as a gesture.
April 7: Brent $138, the cycle peak. April 8: ceasefire announced, prices crashed up to 20% — WTI printed $91.11 and Brent $91.72 intraday, closing down 14.9% and 13.3% respectively. April 9: Brent back above $96 on Israeli strikes in Lebanon, still on track for a 10%-plus weekly loss. Then a nearly 13% single-day plunge, the steepest since 2020, immediately reversed by a 4% rally above $99 as both sides accused each other of violations.
June 18: the MOU. July 1: Brent below $70, back where it started. July: a 20%-plus surge as hostilities resumed.
Five separate de-escalation events. Five failures to hold the decline. The average retracement of the post-headline drop has been well over half within two weeks.
The reason is structural rather than sentimental. A ceasefire announcement does not reopen a strait. Reopening requires shipowners to accept transit risk, insurers to write policies, and Gulf producers to restart curtailed wells. Each of those steps takes weeks and each has failed at least once this year. Traders who have been burned five times do not sell the sixth announcement.
Which means the current $10 premium at $83.40 Brent is not irrational. It is the market pricing a documented base rate of implementation failure.
The corollary is that when a deal actually sticks — verified tanker counts rising for three or four consecutive weeks — the decline will be larger and faster than anyone models, because the premium will unwind against a balance already turning to surplus.
Technical Levels and Quantifying the Premium
The level map is unusually clean because the range has been so well defined.
WTI at $77.91 sits above pivot references at $77.05 and below $79.67, both of which have acted as resolution points across the past two weeks. First resistance is $80, then the mid-$80s where the June average sat. Support runs $76, then $75, then $73 — the level at which the Hormuz premium argument has been most explicitly framed. Below $73, the structure opens toward $70 and then the low $60s where the surplus balance points.
Brent at $83.40 has resistance at $85, then $89 as the lower bound of the base-case band, then $96 where the April post-ceasefire bounce stalled. Support sits at $82, then $80 — which crude lost during the three-day decline before recovering — then $74 at the Q3 forecast and $70 at the Q4 projection.
The August forecast range for WTI runs $67.93 to $106.74, which is a 57% spread and an honest reflection of how binary the setup is. Base-case scenario work has put Brent at $89 to $106 and WTI at $74 to $91 with roughly 55% probability, with full-year averages near $95 and $84. The delay case, at roughly 25%, models Brent at $120 to $144-plus and WTI at $100 to $122 on a one-month reopening delay or ceasefire collapse.
Quantify the premium precisely. If the physical balance supports $74 Brent in Q3 and spot is $83.40, the transit premium is $9.40, or 11.3% of the price. On WTI, against a $73 unpremiumed reference, the premium is $4.91 — and against the sub-$60 surplus inference, it is closer to $18.
That dispersion is the point. Nobody agrees on the size of the premium, which means nobody agrees on the downside. A confirmed reopening takes WTI to $70 on the conservative estimate and to $60 on the aggressive one, and the difference is whether the 10 million bpd of shut-in capacity returns in six months or eighteen.
For trading purposes: sell strength above $80 WTI with a stop above $82.50, targeting $75 and then $73. Buy weakness below $75 with a stop below $72.50, targeting $79. The range is the trade until tanker transit data breaks it.
Product Markets Are the One Genuinely Bullish Leg
Crude is loosening. Products are not, and that divergence is the most durable support under the front of the curve.
European diesel refining margins have been driven toward 20-year highs by extreme heat and drought disrupting the energy system — reducing refinery efficiency, forcing cuts to nuclear and hydropower generation, and tightening distillate availability precisely when cooling and industrial demand peaked. Twenty-year high cracks are not a marginal signal. They are a structural incentive for every refiner with available capacity to buy crude.
That mechanism partially decouples crude demand from crude supply. When product margins are extreme, refiners bid for barrels even into a building crude inventory, because the processing spread justifies it regardless of the flat price. It is why US crude inventories can rise off 2018 lows while WTI holds $77.91.
The Gulf refining response has been part of the story too. Producers with intact downstream capacity have been running hard to capture cracks, converting crude that cannot transit Hormuz into products that can move on different routes and command higher margins.
The vulnerability is that crack spreads are weather-driven and weather reverses. European heat and drought abating restores hydro and nuclear generation, improves refinery cooling efficiency, and normalizes distillate margins. When that happens, the refining bid for crude weakens at exactly the moment the shut-in restoration accelerates — a double hit to the flat price.
Timing on that is seasonal. Distillate demand typically firms into the northern hemisphere winter, which would extend the crack support through Q4. But the weather-driven component of the current margin — the supply-side disruption to European refining and power generation — is a summer phenomenon.
For the forecast, treat product strength as a Q3 support that fades in Q4, which lines up almost exactly with the $74-to-$70 Brent path modeled in the official outlook. The crack spread is holding the price above the balance now. It will not in December.
What Confirms a Real Reopening
The single most valuable thing a crude trader can do right now is define, in advance, what evidence would justify removing the premium — because the headlines will not provide it.
Three markers matter. First, verified tanker transit counts rising for three to four consecutive weeks. Not a single vessel, not a permitted convoy, not a gesture. Sustained volume through the strait at a level approaching pre-conflict norms. Traffic has been running at roughly 10% of typical levels at the worst points this year, with GPS jamming and missile threats disrupting 90% of normal flow.
Second, war-risk insurance premiums normalizing. Underwriters price implementation, not announcements. When Hormuz war-risk rates compress meaningfully, the physical market has accepted that transit is safe, and the $9-to-$13 crude premium follows within days.
Third, Gulf production restart confirmations. Ten million barrels per day of shut-in capacity across six producers has to be physically brought back. Announced restart schedules from national oil companies are the tell, and they will precede the volume by weeks.
None of those three markers has triggered. What has happened is a draft proposal under parliamentary review with terms — a US and Israeli vessel ban, compensation requirements for hostile-designated states, 20% cargo-value penalties, and full reopening contingent on lifting the maritime blockade — that are stricter than the market assumed. That is not the shape of an imminent reopening.
The 60-day interim agreement without tolls, if signed and announced, would be the first genuine catalyst. It would not be a full reopening either, but a 60-day toll-free transit window with US participation would restore meaningful volume and start the clock on production restarts.
The asymmetry sits in what happens if talks collapse instead. The delay case has been priced at roughly 25% probability and models Brent at $120 to $144 and WTI at $100 to $122 — because a collapse means not just no reopening but renewed strikes on infrastructure that has already lost 40 assets across nine countries and 600,000 bpd of Saudi capacity.
That is a $40 upside tail against a $13 downside premium. Which is precisely why the premium refuses to compress despite a bearish balance.
Scenarios Into August 11 Data and the CPI Print
Base case, roughly 50% weight: WTI holds $73 to $82 and Brent $78 to $86 through the August 11 outlook update and the August 12 CPI print. The Iran-Oman arrangement remains in drafting without producing verified transit volume, US inventories continue building off 2018 lows, Aramco keeps trimming Asian official prices, and record distillate cracks hold the front of the curve. OPEC+ delivers the final 188,000 bpd in September and pauses. Month-end WTI $76 to $80. Base target $78.
Bull case, roughly 25%: the parliamentary review rejects the draft, the 60-day interim agreement fails, and strikes resume on Gulf energy infrastructure. The premium expands rather than compresses. Brent clears $89 and targets the $96 April bounce level, then the $106 May-June average. WTI moves through $85 toward $91 and, on a full ceasefire collapse, toward $100 and the $119.48 March high. This is the fat tail and it is worth $40 a barrel.
Bear case, roughly 25%: a 60-day toll-free agreement is signed and announced, tanker counts rise for three consecutive weeks, war-risk insurance compresses, and Gulf producers publish restart schedules. The $9-to-$13 premium unwinds against a balance already turning to surplus. Brent falls to the $74 Q3 forecast, then the $70 Q4 projection, with 2027 modeled at $65. WTI breaks $73, then $70, and the aggressive surplus inference puts it below $60.
Note that the bear case and the official forecast are the same thing. The forecast already assumes the reopening works — Brent at $74 in Q3 and $70 in Q4 is what the balance looks like with 10 million bpd of shut-in capacity restored by year-end and demand down 1.2 million bpd. Spot Brent at $83.40 is trading $9.40 above a forecast that already embeds the bear case.
That is the cleanest way to hold this. You are not short the balance. You are short the probability that implementation works this time, after five documented failures.
Levels and Verdict
WTI at $77.91 and Brent at $83.40 are prices for a negotiation, not for a supply-demand balance. The balance says $74 in the third quarter, $70 in the fourth, and $65 in 2027 — with more than 10 million barrels per day of shut-in Gulf capacity returning by early 2027 into a market where global consumption falls 1.2 million bpd this year before recovering 2.0 million next.
The negotiation says something else. Iran's draft terms — a ban on US and Israeli vessels, compensation from hostile-designated states, 20% cargo-value penalties, and full reopening contingent on lifting the maritime blockade — are under parliamentary review and are stricter than the market had priced. Explosions near Qeshm Island, Houthi attacks on Saudi positions and a tanker in the Gulf of Aden, and a UK Navy report of explosions near a transiting vessel all landed in the same 48 hours.
Levels: WTI resistance $80, then $85, then $91. Support $76, $75, $73, then $70. Brent resistance $85, $89, $96. Support $82, $80, $74, $70. The August range for WTI has been modeled at $67.93 to $106.74, and the 57% spread is honest.
The physical signals have turned. US inventories are building off their lowest level since 2018. Aramco cut Asian official selling prices. OPEC+ has one 188,000 bpd move left and no cuts in reserve. Against that, European distillate cracks near 20-year highs are pulling crude into refineries regardless of the flat price, and that support is seasonal.
Verdict: sell strength above $80 WTI with a stop above $82.50, targeting $75 and then $73. Buy weakness below $75 with a stop below $72.50, targeting $79. Do not sell the reopening headline — five prior de-escalation announcements this year produced violent declines that retraced most of the move within two weeks, and the market has learned that lesson at cost.
The trade is the premium, not the direction. Roughly $9 to $13 a barrel of transit risk sits on top of a balance turning to surplus, and it unwinds only on verified tanker counts, compressing war-risk insurance and published Gulf restart schedules. None of those has triggered. Until one does, respect the range and size for a $40 tail in the wrong direction.