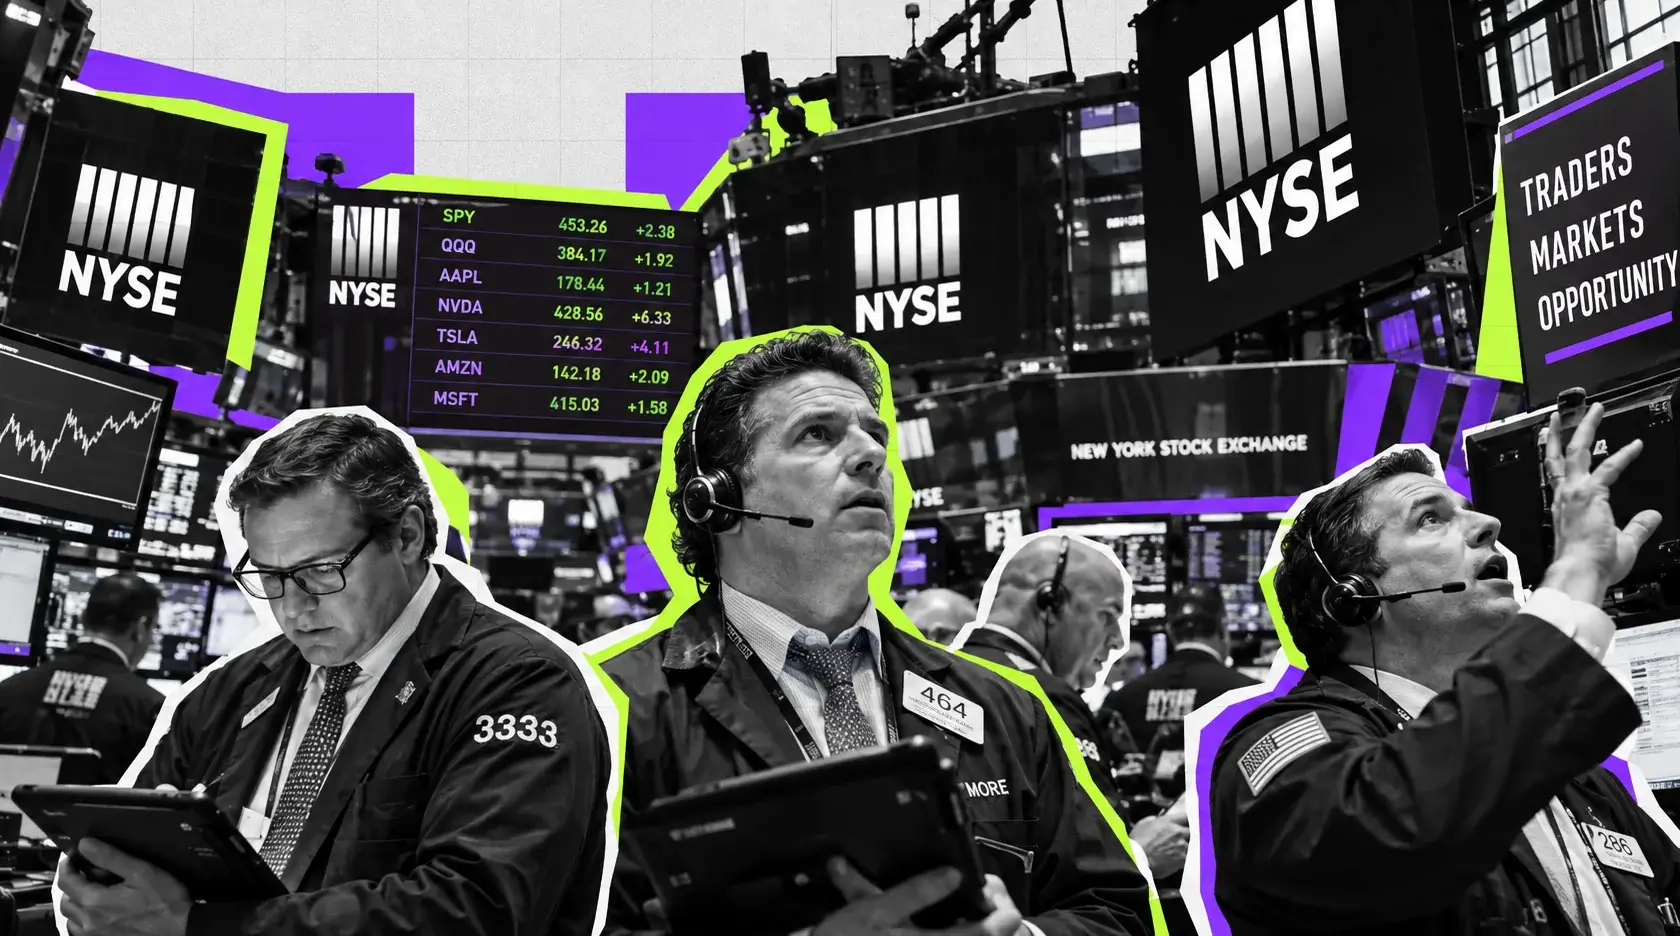
Dow Jones Hits 3-Week High at 51,913 as S&P 500 Stalls at 7,814, Nasdaq Falls on MU -3.1%
Rotation drives the tape as the Dow gains 0.50%, Meta rips 3.36% to $742.81 | That's TradingNEWS
Key Points
- Dow Jones climbs 258.68 points, or 0.50%, to 51,913.63, its highest level in nearly three weeks.
- Micron sinks 3.13% to $996.80 as China’s CXMT memory-cell progress hits the AI chip trade.
- Brent holds near $106 and WTI rises 2.01% to $93.70 after Houthi strikes on Saudi Arabia kill 12.
Wall Street reached midday on Monday, October 12, 2026, with the four major benchmarks pulling in three directions and the S&P 500 barely moving. At 11:51 a.m. ET the Dow Jones Industrial Average stood at 51,913.63, up 258.68 points or 0.50%, a near three-week high for the blue-chip average. The S&P 500 sat at 7,814.66, up 3.12 points or 0.04% from Friday’s 7,811.54 close. The Nasdaq Composite was down 58.39 points, or 0.21%, at 27,307.78, and the Russell 2000 gave back 4.66 points, or 0.17%, to 2,802.32.
The 71-basis-point gap between the Dow and the Nasdaq tells the story of the session. Money is not leaving equities. It is moving between buckets inside them, and the buckets catching the bid are the ones insulated from two pressures that refuse to break: crude oil above $93 a barrel and a 10-year Treasury yield parked at 5.24%. Software, social media, tanker owners and the beaten-down telecom carriers are drawing buyers. Memory chips, the AI hardware complex and the speculative end of the Nasdaq are being sold to fund those purchases. The S&P 500, which holds plenty of both groups, ends up frozen in a 13-point band around 7,810.
The setup coming into the day was constructive. Friday closed with the S&P 500 up 0.59%, the Nasdaq up 0.64%, the Dow up 0.83% and the Russell 2000 up 0.46%, capping a winning week in which both the S&P 500 and the Nasdaq printed record highs on Tuesday, October 6. Through Friday the S&P 500 was up 13.90% year to date, the Nasdaq up 17.78%, the Dow up 6.76% and the Russell 2000 up 11.91%. The current bull market also turned four years old on Monday, an anniversary that lands with the index sitting within striking distance of its peak.
Volatility pricing shows no panic but also no complacency. The Cboe Volatility Index was at 15.17 near midday, up 0.33 points or 2.22% from Friday’s 14.84 close. A VIX in the mid-teens alongside a flat S&P 500 is consistent with a market that is hedging event risk rather than repricing the trend. And the event risk is stacked: big bank earnings start Tuesday morning, consumer inflation data lands Wednesday, retail sales arrive Thursday, and the Treasury market, closed Monday for Columbus Day, reopens with yields already at their highest levels since 2002.
That calendar explains why the index refuses to commit. Buyers are willing to own the S&P 500 at 7,814, but nobody wants to chase it above last week’s record into a CPI print with the 10-year at 5.24% and Brent crude at $106. The result is a tape where the internals are moving hard while the headline number sits still.
Premarket to the Opening Bell: Oil Reverses and Futures Split
The day started with an energy story that flipped twice before New York opened. Overnight, crude slipped after President Trump said on Friday that Russia would immediately supply more than 300,000 metric tons of diesel, the equivalent of 2.25 million barrels, to U.S. and global markets, followed by another 500,000 tons in November and a further 1 million tons after that. On Sunday he added that Ukraine and Russia had agreed to halt attacks on each other’s energy facilities. ICE gasoil futures fell 3% on the diesel headlines, and Brent briefly eased.
The relief lasted hours. Russia struck Ukrainian power plants after the announced energy truce, and Ukraine’s president said he was still waiting for details of the ceasefire while Moscow offered no comment. Over the weekend, Houthi strikes on Saudi Arabia’s main airport killed 12 people, and Trump suggested the United States may join Saudi Arabia in attacks on the Houthis, a step that would widen the Middle East conflict that has already pushed tanker attacks and Strait of Hormuz risk into the oil price. Iran also signaled that the U.S. response to its peace terms was inadequate. By the time U.S. futures traders settled in, WTI crude was trading at $92.58, up 0.79%, and Brent was climbing toward $107.
Index futures reflected the cross-currents precisely. In early trade Dow futures were up 0.06%, S&P 500 futures up 0.11%, Russell 2000 futures up 0.04%, and Nasdaq 100 futures down 0.09%. The divergence was already visible before the bell: the price-weighted Dow and the broad S&P 500 leaned higher while the tech-heavy contract leaned lower.
The opening print confirmed it. The S&P 500 opened up 4.18 points, or 0.05%, at 7,815.72. The Nasdaq Composite opened down 12.89 points, or 0.05%, at 27,353.28. The Dow opened up 0.18%. By 9:40 a.m. ET the Dow had extended to 51,761.98, up 107.03 points or 0.21%, while the S&P 500 had added 6.14 points, or 0.08%, to 7,817.68. That 7,817 level marked the high-water zone of the morning for the S&P 500; it has not held above it since.
The calendar offered no macro anchor. There was no economic data due to the holiday and no notable earnings reports. The Treasury cash market was shut for Columbus Day, which removed the most important real-time input equities have used for weeks. The Dow then ground higher through the late morning, crossing 51,900 for the first time in nearly three weeks, while the Nasdaq slid from its flat open to a 0.3% loss before trimming it to 0.21%. The structure of the session was set in the first 20 minutes and has not changed since: steady accumulation in defensives, software and energy, steady distribution in chips.
Brent at $106 and WTI at $93.70: The Oil Price Is Setting the Ceiling
Crude is the variable the equity market cannot hedge away. November WTI was at $93.70 near midday, up $1.85 or 2.01%. Brent crude futures were trading around $106 a barrel after hovering just below $107 at the opening bell. Last Thursday Brent crossed $104 after a fresh tanker attack, and Monday’s move puts it at its highest level in roughly two weeks.
The diesel announcements that briefly knocked prices lower deserve a closer look because the numbers explain why the market looked through them. The first tranche of 300,000 metric tons equals 2.25 million barrels. Global diesel consumption is forecast at close to 29 million barrels a day. The headline Russian supply amounts to less than 8% of a single day’s global diesel demand, delivered once. Even the full 1.8 million tons promised across three tranches would cover well under two days of world consumption. The gasoil market dropped 3% on the headline, then crude rallied anyway, because the binding constraint on oil is not a shortage of refined product in one region. It is the risk premium attached to shipping lanes and producing infrastructure in the Gulf.
That risk premium expanded over the weekend. A strike that killed 12 people at Saudi Arabia’s main airport, followed by talk of U.S. participation in retaliation, is a direct threat to the world’s largest crude exporter. Russia’s strikes on Ukrainian power plants, hours after the announced energy truce, undercut the one development that was supposed to add supply. And Iran’s characterization of the U.S. response to its peace terms as inadequate keeps the Strait of Hormuz in play.
For equities, the transmission mechanism is inflation and yields, not earnings. Energy stocks themselves are winners: the S&P 500 energy sector was up 1.8% in early trade, adding to Friday’s 2.71% gain in the Energy Select Sector SPDR (XLE), which is now up 42.56% year to date and the best-performing sector of 2026 by a margin of nearly five points over technology. But every dollar on Brent feeds directly into headline CPI expectations, which feed into Treasury yields, which compress the multiple investors will pay for long-duration growth stocks.
That chain is visible in Monday’s tape. The groups being sold, memory chips, quantum computing, unprofitable small caps, are the ones whose valuations depend most on distant cash flows discounted at today’s rates. The groups being bought either produce cash now or benefit directly from higher energy prices. Until Brent breaks back below $104, the level it crossed last Thursday, that pattern has no reason to reverse.
The 10-Year at 5.24% With the Bond Market Closed
The Treasury market is shut for Columbus Day, which leaves the 10-year yield frozen at 5.24%. That number is the most important price in global markets right now and equities have to trade an entire session without seeing it move.
The context makes the freeze uncomfortable. Treasury yields climbed to 24-year highs earlier this month as elevated energy prices stoked concerns that inflation would stay sticky and keep the Federal Reserve hawkish. On October 7 the 10-year printed 5.28%, its highest level since 2002, and it has held between 5.24% and 5.28% since. Talk of 30-year mortgage rates reaching 8% is circulating again, and the bond selloff is global, with French yields among the weakest in Europe.
The sector scoreboard through Friday shows how rates have redistributed returns in 2026. Rate-sensitive sectors have been crushed: Utilities (XLU) were down 4.10% year to date, Real Estate (XLRE) up only 3.05%, and Consumer Discretionary (XLY) down 4.65%. Financials (XLF) were down 0.36% for the year despite the conventional wisdom that banks profit from higher rates. The only two sectors with double-digit gains are energy at 42.56% and technology at 37.75%, which is why the S&P 500’s 13.90% year-to-date return is so concentrated.
The equity market’s working assumption on Monday is that the bond market reopens Tuesday near where it closed. That assumption carries risk in both directions. A Brent move from $104 to $106 over three sessions while Treasuries were closed is the kind of input that can push the 10-year through 5.28% at Tuesday’s open, which would set a new 24-year high just as the big banks report. A break below 5.20% on any de-escalation in the Gulf would hand the rally its best tailwind in weeks.
Wednesday’s consumer price index release from the Bureau of Labor Statistics (bls.gov/cpi) is the real verdict. The energy component will reflect a month in which crude spent most of its time above $90. If core inflation also comes in hot, the 5.24% yield becomes a floor rather than a ceiling, and the multiple compression that has hit chip stocks over the last week spreads. If core cools, the market gets permission to look past energy.
Until then, the S&P 500 is doing what any asset does when its discount rate is temporarily invisible: it is standing still and letting the components rebalance underneath.
Salesforce Double Upgrade Lifts the Dow to a Near Three-Week High
The Dow’s outperformance has a name. Salesforce (CRM) jumped 3.5% early in the session after a double upgrade to buy from underperform, a rare two-notch move on a mega-cap software name. The argument behind the call cuts directly against the fear that has dogged enterprise software all year: that artificial intelligence will deepen customers’ dependence on platforms like Salesforce rather than disrupt them. Because the Dow is price-weighted and Salesforce is a component, a 3.5% move in CRM translates into a meaningful point contribution, and it was enough to push the average to its highest level in close to three weeks.
The upgrade did not stand alone. Software traded as a group, and the strongest moves came from names with exposure to the same thesis that AI expands rather than cannibalizes established platforms. Manhattan Associates (MANH) ripped 6.63%, adding $13.59 to $218.48, within 4% of its 52-week high of $227.03 and putting the supply-chain software company’s market cap at $12.74 billion. Shopify (SHOP) rose 4.09%, or $6.98, to $177.83, a market cap of $230.76 billion, also within striking distance of its 52-week high of $182.19.
CCC Intelligent Solutions (CCC) was the biggest percentage gainer among the most actively traded names, up 9.84%, or $0.69, to $7.71 on 14.86 million shares, already well above its three-month average daily volume of 10.67 million by late morning. The stock remains 24% lower than a year ago, but Monday’s move pushed it within reach of its 52-week high of $9.45.
The software bid stands out because of what is happening one floor down in the tech stack. Semiconductor stocks, led by memory, were the main weight on the S&P 500 technology sector, which slipped 0.2% early. Technology had already been the worst sector on Friday, down 1.30%, and on October 8, down 2.09%, even as it holds a 37.75% year-to-date gain. Investors are not abandoning technology; they are moving from the hardware layer that has carried the 2026 rally into the application layer that has lagged it.
For the Dow, the mix of Salesforce, defensive industrials and the absence of the heaviest chip names produced the cleanest gain of the four major indices. The 51,913 level is now within 87 points of 52,000, a round number that would mark another milestone for the average if the afternoon holds.
Communication Services Up 1.1% as Meta Snaps 3.36% Higher
The S&P 500’s communication services sector was up 1.1% in early trade, the strongest sector move of the morning after energy, and Meta Platforms (META) did most of the lifting. Meta climbed 3.36%, or $24.14, to $742.81 on 6.35 million shares, taking its market cap to $1.892 trillion. The stock now sits within 5% of its 52-week high of $779.82 and has traveled from a 52-week low of $520.26, a 43% recovery from the bottom.
Meta’s chart this year has been anything but smooth. The shares are up just 0.41% over the trailing 52 weeks despite the rally off the low, and the stock dropped to a 17-week low of $524.88 in late July after a quarterly report that showed aggressive capital spending and soft near-term guidance. Since then the company has rolled out its personal AI agent Muse, a series of model updates, new VR glasses and a handheld device, and the stock has steadily rebuilt its premium. At a trailing price-to-earnings ratio of 27.08, Meta trades at a lower multiple than Nvidia’s 28.99, which helps explain why rotation money leaving the chip complex is finding a home here.
Snap (SNAP) joined the move, up 2.73%, or $0.17, to $6.40 on 16.83 million shares, putting it among the 15 most active U.S. stocks. Snap remains 23% lower than a year ago, and its $10.82 billion market cap is a rounding error next to Meta’s, but the sympathy bid confirms that buyers are targeting the digital advertising group rather than just a single name.
The sector move matters because communication services has been one of the year’s laggards. Through Friday, the Communication Services Select Sector SPDR (XLC) was down 5.58% year to date, the weakest of the 11 sectors, and it fell another 0.79% on Friday as the telecom carriers collapsed. A 1.1% rebound on Monday does not repair that, but it shows the group has two engines pulling in different directions: digital advertising and AI platforms on one side, legacy wireless carriers facing a new satellite competitor on the other.
On Monday both engines happened to be running forward, because the carriers were bouncing off Friday’s wreckage while Meta extended its own uptrend. That alignment is unusual and it inflated the sector’s gain. The more durable signal is Meta’s relative strength: a 3.36% gain on a day when Nvidia, Micron and Intel were all down between 1% and 3% is a clear statement about where large-cap growth money prefers to sit with the 10-year at 5.24%.
Read More
-
Yen Stalls at 160 Despite a 3% JGB and Tokyo Core CPI at 2.0% — Intervention Sits at 164, Friday's Payrolls Decide
02.09.2026 · TradingNEWS ArchiveEnergy
-
Apple ($333.38) Loses $103B in Value as Memory Costs Squeeze Margins to 47–48%
09.10.2026 · TradingNEWS ArchiveStocks
-
Bitcoin Fades From $84,243 as 5.24% Yields Bite — $87,000 Breakout Needs a Soft CPI
12.10.2026 · TradingNEWS ArchiveCrypto
-
Gold Fails at $4,218 as Fed Hike Odds Hit 85% for December — $4,109.90 Low Now in Focus
12.10.2026 · TradingNEWS ArchiveCommodities
-
S&P 500 +26 Points, Nasdaq +0.40%, Dow +0.34% as HUM Hits $433.77 and T Drops 6.81%
09.10.2026 · TradingNEWS ArchiveMarkets
-
EUR/USD (1.1180) Slides as 175bp U.S.-Bund Yield Gap Widens — 1.1160 Support Faces CPI Test
12.10.2026 · TradingNEWS ArchiveForex
T-Mobile, Verizon and AT&T Bounce After the SpaceX Spectrum Shock
Friday’s session produced one of the most violent telecom selloffs in decades, and Monday’s bounce is modest by comparison. On Friday, T-Mobile US (TMUS) plunged 13.27% to $148.58, its worst day since 2013. AT&T (T) dropped 9.81% to $22.18, its worst day since 2000. Verizon (VZ) fell 8.75% to $41.65, its steepest decline since July 2002. Millicom (TIGO) lost 9.63% and AST SpaceMobile (ASTS) slid 10.48% to $50.97.
The catalyst was SpaceX’s agreement to acquire a nationwide portfolio of up to 14 megahertz of paired spectrum in the 800 MHz band from Grain Management. Low-band spectrum at 800 MHz penetrates buildings, which closes what SpaceX describes as one of the key remaining technical gaps in its planned Starlink Mobile service. Most existing handsets already support the band, which removes the device barrier. Combined with a constellation of more than 11,000 satellites, the deal gives SpaceX a credible path to blend satellite-to-cell coverage with a terrestrial network once the Federal Communications Commission approves the transfer. The regulator’s chair signaled openness, saying more than $100 billion of spectrum could come to market over the next two years.
Monday’s rebound recovered only a fraction of the damage. T-Mobile rose 3.16%, or $4.70, to $153.28 on 3.04 million shares by mid-morning, clawing back about a fifth of Friday’s $22.73 loss. The stock still sits 34% below its 52-week high of $230.65 and only $5.38 above its 52-week low of $147.90. Verizon rose 1.52%, or $0.63, to $42.28 on 13.39 million shares, recovering 16% of Friday’s $3.99 drop. AT&T added just 0.47%, or $0.10, to $22.28 on 18.76 million shares, retracing 4% of its $2.41 Friday loss and remaining close to its 52-week low of $19.89.
The three carriers together are now worth about $493 billion: T-Mobile $164.42 billion, Verizon $175.69 billion and AT&T $152.71 billion. Space Exploration Technologies (SPCX), the company that triggered the repricing, was the most actively traded U.S. stock Monday morning with 40.33 million shares changing hands, up 1.14%, or $1.85, to $164.43. At a $2.167 trillion market cap, SpaceX alone is worth more than four times the three incumbent carriers combined.
AST SpaceMobile, the satellite-to-phone challenger that got caught in Friday’s crossfire, bounced 5.46% to $53.75 on 13.32 million shares, but the stock remains 44% lower than a year ago and only $6.18 above its 52-week low of $47.57. The muted carrier bounce indicates investors are treating Friday as a permanent reset in the competitive outlook rather than a one-day overreaction.
Micron Breaks Below $1,000 as China’s CXMT Rattles the Memory Trade
The heaviest drag on the Nasdaq came from memory. Micron Technology (MU) fell 3.13%, or $32.20, to $996.80, slipping below the $1,000 mark on 12.38 million shares. The decline knocked Micron’s market cap to $1.128 trillion and left the stock 21% below its 52-week high of $1,255.00. Even after Monday’s drop, Micron is up 434% over the past 52 weeks from a low of $186.25, the single most spectacular large-cap run of the AI cycle, and trades at a trailing P/E of only 13.84.
The trigger came from Shanghai. ChangXin Memory Technologies (CXMT), China’s leading DRAM maker, announced significant progress on a new memory-cell architecture designed to increase storage density, the same frontier that Samsung Electronics, SK Hynix and Micron are racing to commercialize. CXMT’s president said over the weekend that the company aims to launch a server memory product built on the new design by the end of 2026. Samsung tumbled 4% in Seoul alongside a broader South Korean selloff, and SK Hynix fell more than 3%.
The market’s reaction reflects how much of the memory rally rests on pricing power. Memory has been the scarcest component in AI data centers, and that scarcity is what drove Micron from under $200 to over $1,200. A credible Chinese competitor at the high end of server memory, even on a 2027 product timeline, threatens the pricing assumption more than the volume assumption.
The selling spread across AI hardware. Nvidia (NVDA) slipped 1.24%, or $2.84, to $226.44 on 33.89 million shares, trimming its market cap to $5.468 trillion and leaving it 7% below its 52-week high of $243.37. Intel (INTC) dropped 3.22%, or $3.37, to $101.33 on 36.24 million shares, a market cap of $535.64 billion; the stock is up 181% over 52 weeks but sits 29% below its high of $142.35. Super Micro Computer (SMCI) got smoked, down 5.33%, or $2.23, to $39.62. Nokia (NOK), a networking play on AI infrastructure, fell 3.05% to $10.04 on 37.30 million shares.
The chip slide is the main reason the S&P 500 cannot follow the Dow higher. The technology sector, which makes up the largest weight in the index, was down 0.2% early on Monday after falling 1.30% on Friday and 2.09% on October 8. Three straight sessions of chip weakness, with a 5.24% 10-year in the background, show a market taking profits on the AI hardware trade rather than abandoning it. The level that matters for Micron is now $1,000; a close back above it would signal that Monday’s CXMT reaction was a headline flush.
Tanker Stocks Blow Through 52-Week Highs as Shipping Risk Reprices
If oil is the market’s main stress, tanker owners are its main beneficiaries. Every major crude tanker name on the gainers list traded at a fresh 52-week high Monday morning. DHT Holdings (DHT) jumped 6.17%, or $1.52, to $26.16, clearing its prior 52-week high of $25.07 on 2.12 million shares. Frontline (FRO) rose 5.35%, or $3.00, to $59.10, well above its previous high of $56.86, putting its market cap at $13.16 billion. Okeanis Eco Tankers (ECO) climbed 5.20%, or $4.84, to $97.95, above its prior peak of $94.98. International Seaways (INSW) added 3.38%, or $4.05, to $123.87, through its previous high of $122.75.
The 52-week returns in the group are extraordinary. Frontline is up 146% over the past year, International Seaways 173%, Okeanis 217% and DHT 117%. All four trade at single-digit trailing P/E ratios: DHT at 8.38, Frontline at 8.40, Okeanis at 8.33 and International Seaways at 7.66. The market is paying low multiples on peak-cycle earnings, which is standard for shipping, but the earnings keep climbing because every incident in the Gulf, from tanker attacks to the weekend strike on Saudi Arabia’s main airport, lengthens voyages, raises insurance premiums and pushes freight rates higher.
Refiners joined the bid selectively. Delek US Holdings (DK) rose 3.57%, or $2.66, to $77.17, leaving it up 119% over 52 weeks. Refining margins have been the cleanest way to play diesel tightness, which made Friday’s Russian diesel announcement a direct risk for the group. Delek’s gain on Monday shows the market does not believe 2.25 million barrels of Russian diesel changes the refined-product balance in a meaningful way.
Geothermal power producer Ormat Technologies (ORA) gained 3.52%, or $3.13, to $92.05, a smaller expression of the same logic: higher fossil fuel prices make alternative generation more competitive.
The energy sector’s 1.8% gain in early trading sits on top of Friday’s 2.71% advance in the Energy Select Sector SPDR. Energy and tankers are the only parts of the market where a higher oil price is unambiguously positive, and with Brent at $106, they are absorbing the capital that is leaving chips. For the S&P 500, the problem is weight: energy is a small slice of the index, while technology is the largest. A 1.8% gain in energy cannot offset a 0.2% loss in tech, which is why the rotation shows up in the Dow and the sector tables but not in the S&P 500’s headline number.
eBay, Biogen and Chipotle: The Consumer and Healthcare Crosscurrents
Away from energy and technology, the morning’s single-stock moves split along clear lines. eBay (EBAY) rose 4.39%, or $4.92, to $117.11, within 2% of its 52-week high of $119.31 and lifting its market cap to $52.11 billion. eBay is up 26% over 52 weeks, a steady performer in a Consumer Discretionary sector that was down 4.65% for the year through Friday.
Biogen (BIIB) gained 3.57%, or $8.06, to $233.77, breaking above its prior 52-week high of $230.49 to set a fresh annual peak. The biotech is up 56% over the past 52 weeks and carries a $34.54 billion market cap. Healthcare has been one of 2026’s quieter winners: the Health Care Select Sector SPDR (XLV) rose 1.18% on Friday and is up 9.84% year to date, and Biogen’s breakout extends a rally in the group that started with vaccine makers last week, when Moderna jumped 14.21% to $225.00 and Novavax added 15.8% to $12.75 on Friday.
Several old-economy names caught a bid. V.F. Corporation (VFC) rose 3.87%, or $0.58, to $15.58; Lamb Weston (LW) added 3.68%, or $1.76, to $49.63; and Allison Transmission (ALSN) gained 3.67%, or $4.03, to $113.89. SLM Corp (SLM) rose 3.60% to $23.33 and Avient (AVNT) climbed 4.10% to $39.34. None of these moves came with headline catalysts, which makes them part of the same rotation logic: cheaper multiples, domestic cash flows and little exposure to the AI capex cycle.
Chipotle Mexican Grill (CMG) went the other way, dropping more than 4% after Starbucks (SBUX) confirmed it is not buying the burrito chain. A report last Thursday that Starbucks had explored a takeover had sent Chipotle up more than 6%; Monday’s decline gives back most of that takeover premium. Starbucks edged higher on the denial, as investors who had worried about the cost of a large acquisition breathed out. The coffee chain said it remains focused on its turnaround strategy and will report quarterly results on October 29 after the close.
The Chipotle reversal is a reminder that a large part of the market’s recent gains outside of technology have come from deal speculation rather than earnings. With bank earnings starting Tuesday and the broader reporting season following, single-stock moves will shift from rumor-driven to numbers-driven, and names like Chipotle that rallied on speculation are exposed.
IonQ, NuScale and Plug Power: The Speculative End Gets Smoked
The most aggressive selling Monday hit the corner of the market that most depends on cheap money. IonQ (IONQ) tumbled 8.99%, or $3.58, to $36.31 on 18.11 million shares, after reports that the quantum computing company had agreed to buy cybersecurity firm Elisity for up to $1.3 billion. Measured against IonQ’s $14.71 billion market cap, the deal is worth close to 9% of the company, a large bet on a business outside its core. The stock is down 51% over 52 weeks and trades less than halfway up its range between $25.89 and $84.64. IonQ had jumped 12% in late September after testing the industry’s first real-time quantum error decoder, and most of that gain is now gone.
The clean-energy and nuclear speculative names fared worse on a technical basis, with several breaking to fresh lows. NuScale Power (SMR) fell 6.53%, or $0.47, to $6.73, below its prior 52-week low of $7.07, leaving the small modular reactor developer down 84% over the past year and worth just $2.76 billion. Plug Power (PLUG) dropped 5.36%, or $0.09, to $1.59, below its previous 52-week low of $1.68, on 24.73 million shares. Opendoor Technologies (OPEN) slid 5.86%, or $0.13, to $2.09, under its prior low of $2.13; the home-flipping platform is down 69% over 52 weeks, a casualty of mortgage rates now being discussed in the context of 8%.
Recursion Pharmaceuticals (RXRX) fell 8.05%, or $0.35, to $4.01 on 12.41 million shares. SoFi Technologies (SOFI) lost 2.85%, or $0.45, to $15.35, just $0.47 above its 52-week low of $14.88 and down 42% over the past year.
The pattern across these names is consistent: unprofitable or capital-intensive businesses whose valuations depend on financing costs falling are being sold on a day when the 10-year yield cannot even trade. Every one of these companies would benefit from a 10-year back below 5%. With Brent at $106 and CPI due Wednesday, that is not the base case the market is pricing.
The Russell 2000, down 0.17% to 2,802.32, absorbed some of this pressure. The small-cap index fell 1.31% to 2,793.20 on October 7 before recovering to 2,806.98 on Friday, and Monday’s dip puts it back in the middle of that range. Small caps are carrying an 11.91% year-to-date gain, ahead of the Dow’s 6.76%, but they remain the most rate-sensitive segment of the equity market and the first to break if the 10-year pushes through 5.28% when bonds reopen.
Breadth, VIX, Gold and Bitcoin: The Internals Behind a Flat S&P 500
The flat S&P 500 masks a market with negative breadth. In early trade, declining issues outnumbered advancers by a 1.25-to-1 ratio on the New York Stock Exchange and by a 1.44-to-1 ratio on the Nasdaq. The S&P 500 posted 9 new 52-week highs against 4 new lows, a positive but thin reading for a 500-stock index sitting near a record. The Nasdaq Composite recorded 23 new highs and 123 new lows, a ratio of more than 5-to-1 in favor of lows on an index that is down only 0.21%.
That Nasdaq reading is the most telling number of the session. An index within 1% of its record should not be producing five times as many 52-week lows as highs. The gap exists because the Nasdaq’s leadership is concentrated in a few dozen mega-caps while thousands of smaller listings, including the quantum, clean-energy and fintech names that broke to new lows Monday, are in sustained downtrends. Narrow leadership has been the defining feature of the 2026 rally. Strip AI-related stocks out of the S&P 500 and the remaining “old economy” index has gained only 5.5% this year, slightly behind the 5.6% gain in Europe’s STOXX 600, compared with the S&P 500’s 13.90% through Friday.
Safe havens moved lower rather than higher, a sign that Monday’s selling is rotation rather than fear. Gold futures fell $24.00, or 0.57%, to $4,192.30 an ounce, giving back part of Friday’s 1.52% gain that took the metal to $4,220.30. A 0.57% dip leaves gold above $4,190, still within easy reach of the record-setting levels it has posted during the Middle East escalation, but without the panic bid that would accompany a genuine risk-off session.
Bitcoin slid $1,168.27, or 1.39%, to $82,650.24, joining the speculative-growth selloff. Crypto has behaved like a long-duration risk asset through the yield spike, and its decline alongside IonQ, Plug Power and Opendoor fits the same pattern. Spot bitcoin is trading well below its earlier 2026 highs.
The VIX at 15.17, up 2.22%, completes the picture. Implied volatility has edged up from Friday’s 14.84 but remains in the mid-teens. Options traders are paying a modest premium for protection into the bank earnings and CPI events, not pricing a breakdown. The U.S. Dollar Index closed Friday at 102.23, up 0.09%, and has been steady through the oil rally, which removes currency as a source of pressure on multinational earnings heading into the reporting season.
Big Banks Report Tuesday After a 14% Slide From the August Peak
The first real test of the third-quarter earnings season arrives Tuesday morning, when JPMorgan Chase (JPM), Goldman Sachs (GS), Citigroup (C) and Wells Fargo (WFC) report, with Bank of America (BAC) and Morgan Stanley (MS) following later in the week. The setup is the opposite of what textbook logic would predict. Higher rates are supposed to help banks through wider net interest margins. Instead, bank stocks have been thrashed.
Over the past month, JPMorgan has shed 6%, Citigroup is down 6.5%, Wells Fargo is off 7%, Morgan Stanley has fallen 11%, Goldman Sachs is down 12% and Bank of America has dropped 13%. The KBW Nasdaq Bank Index, which tracks 24 publicly traded U.S. banks, is now down more than 14% from its August peak, putting the group firmly in correction territory. Through Friday, the Financial Select Sector SPDR (XLF) was down 0.36% year to date, though it bounced 1.82% on Friday as rotation money flowed into cheaper sectors.
The reason for the selloff is the speed of the rate move. A 10-year yield at 5.24% to 5.28% erodes the value of bond portfolios, slows mortgage origination, raises funding costs and chills dealmaking. Forecasts call for solid year-over-year results, but third-quarter reports are expected to fall short of a bumper second quarter, with fewer blockbuster deals and higher rates weighing on investment banking and trading. Investors will be focused on what management teams say about credit quality and the effect of higher rates on both the Wall Street and Main Street sides of the business.
The stakes extend beyond the banks themselves. Consensus expectations call for S&P 500 earnings growth of 25% to 30.6% in the third quarter, among the best rates of increase on record. Corporate results now carry the burden of justifying a market trading near all-time highs with a 5.24% risk-free rate. The recent de-rating in valuations has improved the asymmetry heading into reporting season: stocks are less expensive than they were at the start of October, and the profit outlook remains strong.
Banks set the tone for that reporting season because they see the economy first. A strong round of results and confident guidance on Tuesday would validate the 25%-plus earnings growth assumption and give the market a reason to look through oil and yields. A weak round, particularly any sign of credit deterioration, would confirm the bond market’s warning and hand the bears a fundamental argument to go with the macro one.
CPI Wednesday, Retail Sales Thursday and the Levels That Decide the Week
After the banks, the macro calendar takes over. The Bureau of Labor Statistics releases the consumer price index on Wednesday (bls.gov/cpi), and the Census Bureau publishes retail sales on Thursday (census.gov/retail). Together they will determine whether the 10-year yield breaks above 5.28% or retreats from its 24-year high, and that answer will decide whether the chip selloff deepens or reverses.
The technical map for the S&P 500 is tight. The index closed at 7,765.36 on October 8, its lowest close of last week, and at 7,801.77 on October 7. The 7,765 level is the first support; a break below it would complete a lower-high, lower-low sequence from last Tuesday’s record. On the upside, the morning high near 7,817 has capped the index all session. A close above Friday’s 7,811.54 would technically mark a second straight gain, but the market needs a push through the record zone to confirm that the rotation is additive rather than defensive.
For the Nasdaq, the October 8 close of 27,193.34 is the line to watch. Monday’s low has held above it, but the chip complex is now three sessions into a selloff, and Micron below $1,000 is a psychological break. The Dow has the cleanest setup: 51,913 is within 87 points of 52,000, and the average has gained 733 points since its October 7 close of 51,179.87.
In commodities, Brent at $104 is the line separating a cooling oil premium from an escalating one; $107, Monday’s opening high, is the line that would trigger fresh inflation fears. For rates, 5.28% on the 10-year is the trigger point; a print above it on Tuesday’s reopening would be a new 24-year high.
Monday’s session is mixed: a bullish rotation underneath, a bearish signal in breadth and tech, and a flat headline. The Dow’s 0.50% gain to 51,913.63 is real, driven by Salesforce, defensive cash flows and energy. The Nasdaq’s 0.21% decline to 27,307.78 is equally real, driven by memory chips, AI hardware and the speculative end of the market. The S&P 500’s 0.04% gain to 7,814.66 is the market’s honest answer to a week whose outcome depends on events it cannot yet see. The verdict on October 12, 2026 is mixed, with leadership narrowing and breadth deteriorating beneath a stable index, and the direction of the next move rests on whether Tuesday’s bank results and Wednesday’s CPI print can pull the 10-year back from 5.24% while Brent holds below $107.