Ethereum Holds $1,900: 33% of Supply Staked, Glamsterdam Targets End-August With a 78.6% Fee Cut
Ethereum sits 61.5% below its $4,953.73 August 2025 record with the ETH/BTC ratio | That's TradingNEWS
Key Points
- ETH hit $1,929.36 after payrolls fell 23,000, cutting September Fed hike odds to 44%.
- Ether ETFs took $53.1M on August 4 and $60.8M on August 5 after a $105.44M week.
- Glamsterdam targets end-August: gas limit 60M to 200M, fees down roughly 78.6%.
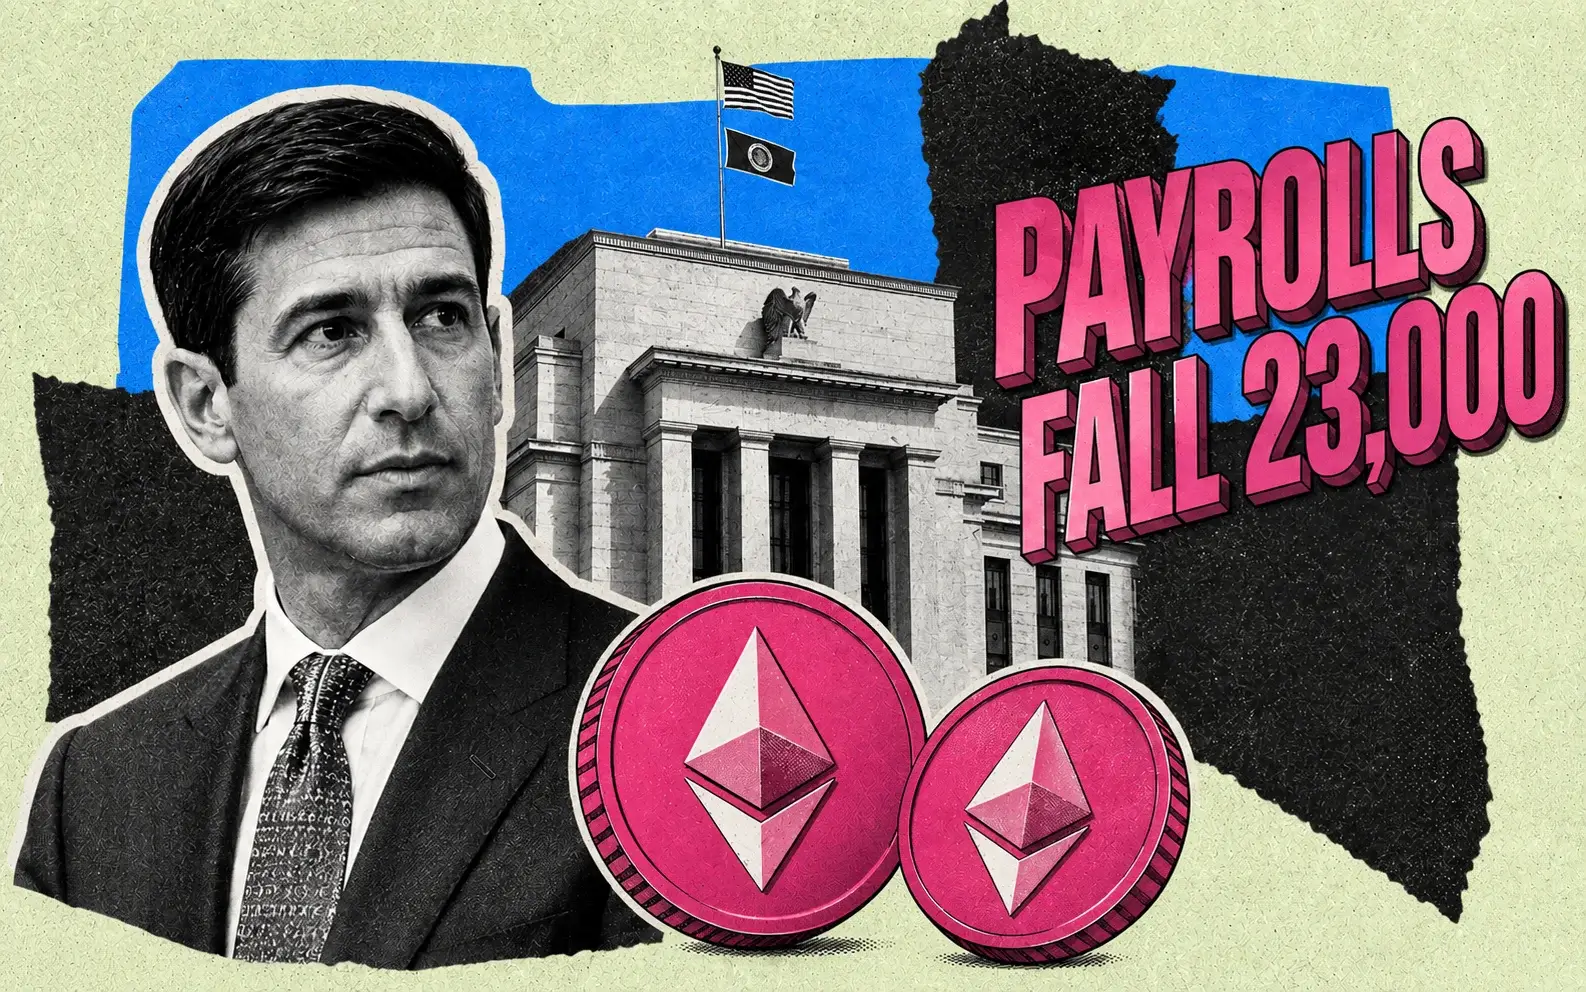
Ethereum opened Friday at $1,902.20, down 0.2% from Thursday's open, then moved to $1,929.36 by 9:02 a.m. ET after July payrolls printed minus 23,000 against an 80,000 consensus. By mid-morning ETH was changing hands near $1,904.87 with a 24-hour high of $1,917.70 and a low of $1,890.96, on roughly $7.6 billion of volume and a market capitalization near $230 billion across 120,682,000 circulating coins.
That is a $27 move on the most dovish macro surprise of the quarter. Bitcoin cleared $65,000 and traded near $65,200 for a gain approaching 2%. The Nasdaq Composite rose 0.86%, gold futures ripped 3.02%, and the S&P 500 sat four points from a record close. Ethereum did the least of any major risk asset on the board.
The reason is structural, not sentimental. ETH touched a fresh local high of $1,981 earlier in the week and immediately ran into the $1,980–$2,030 supply zone that has capped every attempt since May. Daily RSI is holding above 54, buyers keep stepping in on dips, and the price has spent the entire week grinding within $50 of $1,900 without resolving in either direction. The next hurdle is $1,930. Clearing it opens $1,965 to $2,000.
Position the drawdown properly before assessing the setup. The all-time high was $4,953.73 on August 24, 2025. At $1,905 Ethereum is 61.5% below that peak and down roughly 32% year to date. Bitcoin is 48% off its own record and down considerably less on the year. The ETH/BTC ratio bottomed near 0.027 — a multi-year low — and currently sits near 0.0292.
The path here was brutal and specific. A sharp January-February decline from $3,400 to $1,800, a choppy recovery toward $2,500 by May, another selloff to the $1,520–$1,600 zone in June, and now a methodical climb back. Early-year weakness was compounded by recession concerns and heavy insider selling.
What changed since June is the shape of the recovery. From $1,450 through $1,600, $1,700, $1,800 and now $1,900, ETH has built the most constructive higher-low sequence it has shown all year. That is the argument for owning it. The $2,000 ceiling is the argument against paying up.
Why ETH Underperformed Its Own Macro Catalyst
The Federal Reserve repricing Friday was the cleanest liquidity signal crypto has received in months, and Ethereum captured less of it than any comparable asset.
September hike odds collapsed from 67% a week ago to 55% Thursday to 44% within minutes of the release. The target range stays at 3.50%–3.75%; a hike would lift it to 3.75%–4.00%. The 10-year Treasury yield fell to roughly 4.60% from 4.67% immediately before the print. Lower yields reduce the relative attraction of interest-bearing alternatives, which is mechanically supportive for a non-yielding — or in ETH's case, low-yielding — digital asset.
Payroll detail reinforced it. Per the BLS employment situation report, May and June were revised down by a combined 103,000, participation slid to 61.4% from 61.5%, and average hourly earnings decelerated to 3.2% year over year from a downwardly revised 3.4%. Wage cooling with contracting payrolls is the configuration that keeps the Fed parked without triggering a growth panic.
Ethereum's muted response tells you where the marginal buyer is. It is not in ETH. Spot Ether ETF assets sit near $10.2 billion to $13.71 billion depending on the measurement date, against a Bitcoin ETF complex carrying $51.3 billion of cumulative net flows and roughly $61 billion into a single fund. The regulated demand channel for Ethereum is roughly one-fifth the depth of Bitcoin's, which means the same macro impulse produces a fraction of the price effect.
The Fear and Greed Index reading of 25 — extreme fear — applies across crypto, and it explains why a dovish print produced grinding rather than gapping. Traders positioned defensively into the release did not chase.
There is also a specific 2026 drag. Sentiment has been subdued all year on a hawkish Federal Reserve posture that sustained pressure across risk-sensitive assets, and crypto absorbed the brunt of it while equities decoupled upward on AI capital expenditure. Bitcoin and Ethereum spent the year watching from the sidelines at depressed prices while indices notched near-daily records — a divergence with no precedent in prior cycles, where crypto and equity risk appetite moved together.
The August 12 US CPI print is the next resolution point. A soft number pushes September hike odds below 30% and gives ETH the liquidity backdrop it needs to attack $2,000. A hot number reverses everything Friday delivered.
The Drawdown Math and What ETH/BTC at 0.029 Actually Says
At $1,905 against a $4,953.73 peak, Ethereum has given back 61.5%. That is deeper than Bitcoin's 48% drawdown from $126,198.07, and the gap is the entire 2026 story.
The ETH/BTC ratio compressed to roughly 0.027 in June — a multi-year low — reflecting capital preference for Bitcoin through the risk-off phase. At $1,905 against $65,200 the ratio has recovered to approximately 0.0292, an 8% improvement off the trough. That is the first sustained relative-strength signal ETH has produced this cycle.
Market capitalization frames the divergence. Ethereum at roughly $230 billion sits against Bitcoin at approximately $1.33 trillion, which puts ETH at 17.3% of BTC's size. At the August 2025 peak that ratio was materially higher. The total crypto market capitalization is $2.19 trillion, meaning Ethereum represents 10.5% of the entire asset class — down from the mid-teens percentage it commanded through 2024 and 2025.
The behavioral read on a 61.5% drawdown is that the marginal seller is largely exhausted. Ethereum has posted gains exceeding 80% and losses surpassing 60% across its history, and the pattern following the deepest drawdowns has been mean reversion rather than continued decay. ETH held above $1,700 through a second night of Iran strikes in June, recovered its dip faster than Bitcoin, and clawed back from the June capitulation that dragged it toward $1,520.
That relative resilience through a genuine geopolitical shock was a change of character for an asset that had spent the year as crypto's biggest disappointment.
The bear counterargument is that a 61.5% drawdown with no bid is exactly what a structural derating looks like rather than a cyclical low. Ethereum lacks Bitcoin's fixed-supply narrative, launched its US ETFs without staking, and has less institutional history behind it. If ETH is being repriced as an application platform rather than as money, the relevant comparison is not the prior cycle high.
Both readings coexist at $1,905, which is why the price has spent six weeks compressing rather than trending. The resolution comes at $2,000 in one direction and $1,750 in the other.
Technical Structure: The Higher-Low Sequence Versus the $1,980–$2,030 Wall
The four-hour and daily structure has genuinely improved, and it deserves credit separate from the price level.
Since the June low near $1,520, ETH has built a series of higher lows from $1,450 through $1,600, $1,700, $1,800 and now $1,900. Price reclaimed the $1,800 zone and converted it from resistance into support. That constitutes a W-shaped recovery on the daily chart, confirmed with expanding volume on the advance. Buyers pushed price above both the 20-day and 50-day exponential moving averages during July.
Momentum reads constructive without being extended. Daily RSI holds above 54 — comfortably above the midline, nowhere near overbought. Volatility has narrowed, which typically precedes resolution rather than continuation.
The problem is what sits overhead. ETH touched $1,981 this week and stalled. The $1,980–$2,030 band is where prior selling clustered and it has rejected every attempt since May. Above that, several distinct layers: $2,050–$2,100, a Fibonacci extension near $2,062, the 200-day exponential moving average near $2,200, then the $2,400 level that capped price throughout April and May, and $2,600 beyond it.
The weekly timeframe remains the bear's evidence. The 50-week moving average sits above price and is falling, which makes it resistance rather than support. The 200-week moving average has been rising since January 18, 2026, which anchors the longer-term structure but does nothing for the intermediate trend.
The immediate ladder is precise. First resistance $1,930. Clearing it targets $1,965 to $2,000. A decisive break above $2,000 on strong volume would trigger short covering and open $2,200 to $2,450 — an 18% to 31% move from current levels. Failure to hold $1,900 brings $1,850 back into focus.
Seasonality provides no edge. Across eleven years of trading history, Ethereum's August performance has been split roughly evenly between gains and losses with no consistent directional bias. Anyone selling an August seasonal thesis in either direction is selling noise.
What matters is the $2,000 line and whether ETF flows can sustain long enough to force it.
Level Map: $1,849 Is the Invalidation, $2,200 Is the Prize
Trade this off levels rather than narrative, because the narrative is genuinely two-sided.
Downside structure first. Immediate support is $1,890, Friday's 24-hour low. Then $1,850 to $1,870, which has absorbed every pullback for two weeks. The 50-day EMA at $1,849 is the line that matters — losing it turns the August outlook defensive and puts $1,750 in play. Below that, $1,800 to $1,830 is the zone buyers would need to defend, then $1,780, then $1,700. A break under $1,700 weakens the entire structure and raises liquidation risk toward $1,550.
Note how far the moving averages have travelled. In June the 50-day EMA sat near $1,708 and the 200-day moving average near $1,693 — the two lines separating a broken chart from a recovering one. ETH held both through the Iran escalation. The 50-day has since risen to $1,849, which means the recovery has been steep enough to drag the intermediate trend line up 8.3% in six weeks.
Upside targets stack cleanly. $1,930 is the first gate. $1,950 to $1,965 next. $2,000 is the psychological and technical ceiling. Above it, $2,050 to $2,100, then $2,062 as the Fibonacci extension, then the 200-day EMA near $2,200 — 15.5% above spot and the level that would confirm a genuine trend change rather than a range expansion.
Forecast distributions bracket the range tightly for August: a base case of $1,750 to $1,980 with roughly 10% to 15% realized volatility, a bull case targeting $2,200 to $2,450 on a volume-confirmed break above $2,000, and September models pointing to $2,050 with a $1,849 to $2,160 band. Longer-run base-case ranges span $1,700 to $3,300, with bull scenarios reaching $6,000 to $10,000 on sustained ETF inflows, monetary easing and successful network upgrades.
Spot at $1,905 sits almost exactly at the midpoint of the August base range. That is a coin flip with defined boundaries 4% away in each direction, and the only honest trade is at the edges.
Consolidation between $1,800 and $2,050 remains the highest-probability near-term path. A close above $2,000 changes that.
Read More
-
Yen Stalls at 160 Despite a 3% JGB and Tokyo Core CPI at 2.0% — Intervention Sits at 164, Friday's Payrolls Decide
02.09.2026 · TradingNEWS ArchiveEnergy
-
QQQ ETF ($739) Fades From an Early Tech Rally as a 77.9 ISM Prices Index Meets Micron's $61.5B Guide — $760 Record Test Ahead
01.10.2026 · TradingNEWS ArchiveStocks
-
XRPR and XRPI Follow XRP's $1.49 Test as Spot Funds Hold 1.16B XRP and a 1 Billion Token Escrow Release Lands — $1.70 in Play
01.10.2026 · TradingNEWS ArchiveCrypto
-
November NG Slips Below $3 as Decade-High Storage Meets Capped LNG Exports — $2.75 in Sight
01.10.2026 · TradingNEWS ArchiveCommodities
-
Dollar-Yen at 158 Presses Toward 160 as a 363 bp Carry Gap Meets Katayama-Bessent Intervention Risk — 159 in Sight
01.10.2026 · TradingNEWS ArchiveForex
ETF Flows Turned, and for Three Weeks They Out-Gathered Bitcoin
The single most underappreciated development in this asset is that spot Ether ETFs attracted more inflows than Bitcoin funds for three consecutive weeks in late July. After eighteen months of Ethereum products bleeding assets while Bitcoin's complex absorbed billions, the relative flow picture inverted.
Recent session detail: Ether ETFs opened August with an $11.9 million net outflow on August 3, then took in $53.1 million on August 4 and $60.8 million on August 5, with one issuer's clients accounting for roughly $50.3 million of the latter. The prior week delivered $105.44 million of net inflows — a second consecutive positive week and the strongest weekly result since April 2026, with the largest fund contributing more than $100 million of it.
Zoom out and the reversal is clearer. The July 14 through July 21 window brought $196.4 million of net inflows, with the dominant fund supplying $58.3 million on July 14, $31.7 million on July 17 and $52.8 million on July 21. July 2 registered $29 million. July 31 closed the month at a marginal $6.40 million net outflow with the major funds in the red and only one staking product positive.
Set that against the damage. Spot Ether ETF outflows reached $401.62 million through late May. The category has cumulative inflows above $11.2 billion since launch against current assets near $10.2 billion — meaning the funds have given back value through price decline even as flows stayed net positive. Assets under management measured $13.71 billion as of July 31 on a different accounting basis.
Concentration is the vulnerability. The largest issuer's original spot fund holds roughly $11.4 billion of cumulative net inflows and $5.4 billion to $6.5 billion of current assets. The next-largest products carry $1.57 billion and $1.4 billion. Beyond that, cumulative inflows drop to $66 million, $29 million and $25 million across the remaining issuers. A healthy market would show broader participation. This one depends on one distribution channel, exactly as Bitcoin's does.
Comparative flow data from last month puts Ethereum's rebound in context: Bitcoin ETFs added $172 million, Ether funds led, XRP products took $27.29 million and Solana $14.6 million. Ethereum is winning a small race.
The Staking ETF Mechanism Is the Real Structural Change
Regulators cleared staking structures for Ethereum ETFs, and on January 5, 2026, the first US crypto exchange-traded product distributed staking rewards to shareholders. That single decision reframed what an Ethereum ETF is.
A Bitcoin ETF can only track a price. An Ethereum ETF can hold a productive asset and pay income. The mechanical consequence matters more than the marketing: every dollar entering a staking ETF requires buying spot ETH and locking it with a validator, which removes coins from the liquid float. That is a supply-tightening channel Bitcoin's product complex structurally cannot replicate.
The clearest expression sits inside one issuer running two funds. The original product tracks price with no staking risk and offers the cleanest, most liquid pure-price exposure. The staking product launched March 12, 2026, stakes 70% to 95% of its holdings, and pays yield monthly. Anticipation of staking approval drove a 19-day inflow streak and a single-day spike of $727 million in March before the surge faded and cumulative flows drifted back from their late-2025 peak.
The complication is cannibalization. Capital has rotated from the non-staking fund into the staking fund to capture the incremental return, which means a meaningful share of staking inflows is not new money at all — it is the same issuer's assets migrating between wrappers. Net new demand is smaller than the staking-fund flow data implies.
Even so, the direction of travel is the correct one for ETH. Staking makes the funds competitive against fixed income, which broadens the buyer base from crypto-native allocators to yield-motivated institutional holders with long time horizons who do not trade on short-term news. That is the closest thing Ethereum has to a strategic reserve dynamic.
With approximately 30% to 33% of all ETH already staked and locked, the ETF channel adds a regulated layer on top of an already constrained float. The parent issuer now manages more than $130 billion across its crypto exchange-traded products, which gives it distribution reach no competitor matches.
The bull case for ETH above $2,000 leans heavily on this mechanism becoming persistent rather than episodic. Several strong flow days do not make a rally. Institutional demand has to compound.
The Fee Math Undercuts the Yield Story
Before treating staking ETFs as the catalyst, run the arithmetic, because it is less compelling than the headline suggests.
Ethereum staking yields roughly 2.6% to 3.0% at current validator counts. The staked-product filing specifies an aggregate staking fee equal to 18% of gross staking consideration, with the trust retaining that layer before shareholders see anything. Layer management fees on top of that and the net income reaching an ETF holder lands somewhere near 2% — a modest benefit rather than a game-changing income stream.
Compare that to alternatives. The Federal Reserve target range sits at 3.50%–3.75% with the effective funds rate at 3.63%. The 10-year Treasury yields 4.60%. A money market fund pays more than a staked Ethereum ETF, without duration risk, slashing risk, validator operational risk or a 61.5% drawdown from peak.
The yield argument only works if ETH price appreciation carries the total return. Which means the staking ETF is not really an income product — it is an equity-like growth product with a 2% coupon attached. Institutions buying it are buying Ethereum's terminal value with a small carry offset, and the marketing framing obscures that.
Staking also introduces risks the pure-price product avoids. Liquidity constraints on validator exits, slashing exposure, operational failure at the validator level, and regulatory uncertainty about how proof-of-stake yield is treated. Those are real and they are why some allocators deliberately stay in the non-staking wrapper despite forgoing the yield.
The exit-queue problem is being addressed. Approximately 38.9 million ETH was staked as of April 2026, and churn limits scale with total staked supply. Large concentrated exit requests that currently might take weeks to clear the queue could be processed in days after the next protocol upgrade. That materially improves exit liquidity for institutional stakers and removes a genuine objection to the product category.
But better exit liquidity cuts both ways. A staking channel that locks supply on the way in and releases it faster on the way out is less of a one-directional supply sink than the bull case assumes.
The honest framing: staking ETFs broaden Ethereum's buyer base and tighten float at the margin. They do not solve a 2.6% gross yield against a 3.63% risk-free rate.
Supply Is Genuinely Tight, and Exchange Balances Prove It
The on-chain supply picture is the strongest pillar of the ETH thesis and it has not deteriorated through the drawdown.
Roughly 30% to 33% of circulating ETH — approximately 35 million to 38.9 million coins — is staked and locked, structurally removing that supply from the sell side. Against a 120,682,000 circulating supply, that leaves a liquid float far smaller than the market capitalization implies.
Exchange balances are on a multi-year downtrend. Between June 4 and June 7, 2026, roughly 475,000 ETH left major exchanges — a significant accumulation signal in the middle of the worst drawdown of the cycle. Coins moving to self-custody or staking contracts during a capitulation is the behavioral opposite of distribution.
Whale wallet data has shown ongoing accumulation near current levels, and the pattern has persisted through July and into August alongside the ETF flow reversal. Two independent demand sources — regulated products and large private holders — buying the same constrained float.
The counterweight sits in the price. Despite roughly a third of supply locked, exchange balances at multi-year lows, whale accumulation and three weeks of ETF flows exceeding Bitcoin's, ETH trades at $1,905 and cannot clear $2,000. Tight supply is a necessary condition for a rally. It is manifestly not sufficient.
The reason is that supply metrics measure the coins available to sell, not the demand available to buy. A 33% staked ratio was also true at $4,953 in August 2025 and at $1,520 in June 2026. The variable that moved was demand, and demand for ETH has been the weakest link in the entire asset class this year.
Insider behavior did not help. Heavy selling by a co-founder in early 2026 contributed to the sharp decline alongside recession concerns — a supply event that no amount of staking-lock arithmetic offsets when it lands on a market with thin bids.
Where the supply story becomes genuinely powerful is in combination with the staking-ETF channel. If regulated inflows compound at $100 million-plus weekly while 33% of supply stays locked and exchange balances keep falling, the float mathematically cannot absorb it without price. That is the bull case in one sentence, and it requires flow persistence that has not yet been demonstrated.
Network Economics: $42 Billion Locked, $161 Billion in Stablecoins, and a Value-Accrual Gap
Ethereum's fundamental usage metrics are strong in absolute terms and disconnected from the token price, which is the central analytical problem.
Decentralized finance total value locked on Ethereum stands at roughly $42 billion, maintaining the network's lead among smart contract platforms. The stablecoin market on Ethereum has reached approximately $161 billion in market capitalization — a figure that exceeds Ethereum's own $230 billion valuation by a factor of 0.7 and represents the single largest settlement layer for dollar-denominated digital value anywhere.
Think about what that means. Ethereum secures $161 billion of stablecoins and $42 billion of DeFi collateral, and the asset securing it is worth $230 billion. That is a security budget only modestly larger than the value being secured, which is either a sign of extraordinary capital efficiency or a structural fragility depending on your framing.
The value-accrual question is the one the market keeps answering negatively. Growing stablecoin volume, tokenization activity and Layer-2 throughput generate economic value — but the mechanism by which that value reaches ETH holders has weakened, not strengthened. Layer-2 rollups settle to Ethereum at a fraction of the fee they would pay on the base layer, which means activity growth no longer translates proportionally into burn.
Post-Merge economics were built on the premise that EIP-1559 fee burning plus proof-of-stake issuance reduction would make ETH structurally deflationary as usage scaled. Usage scaled. The burn did not, because usage migrated to L2s.
That is why the next rally requires more than ETF flow days. It requires Ethereum to demonstrate that growing stablecoin, tokenization and Layer-2 activity creates economic value for ETH itself — a proof the network has not delivered through two years of throughput growth.
Security development has been a bright spot. AI agents identified and helped patch a critical vulnerability in July 2026 that could have crashed validators, which speaks to a maturing defensive posture around the protocol. The longer-term roadmap targets quantum resistance and privacy by 2029.
None of that moved the tape. ETH fell 32% year to date through a fork cycle that materially improved block processing, gas predictability and node efficiency. The market has been explicit: it does not currently pay for Ethereum's technical execution.
Glamsterdam Targets End-August, and It Cuts Fees by 78.6%
The next upgrade is the biggest hard fork since The Merge, it is close, and it is a double-edged catalyst that most bullish framing misreads.
Glamsterdam combines Gloas on the consensus layer with Amsterdam on the execution layer, outlined in EIP-7773. The internal working target is mainnet activation at the end of August 2026, with a realistic window running roughly September through December depending on devnet readiness and cross-client testing. The Soldøgn interop devnet concluded May 2, 2026, and a stable multi-client devnet has been running since, with public testnet activations on Sepolia and Hoodi as the clearest leading indicator that mainnet is imminent.
The Amsterdam execution-layer implementation already landed in July 2026, with client code finalizing EIP-7928 for Block-Level Access Lists and a new state-sync protocol.
Three headline changes carry the scaling load. EIP-7732 delivers enshrined proposer-builder separation, moving block building on-chain and cutting MEV extraction by up to 70%. EIP-7928 enables parallel execution through block-level access lists, targeting 10,000 transactions per second. EIP-7904 repricing lifts the gas limit from roughly 60 million to 200 million — a threefold increase, with up to 3.3x observed in testing — and reduces fees by approximately 78.6%.
Read that last figure carefully. A 78.6% fee reduction is a 78.6% reduction in the burn on base-layer activity at constant transaction volume. Glamsterdam expands Ethereum's long-run capacity, but it does not automatically lift the burn that ETH's monetary case depends on. It arguably suppresses it until throughput grows enough to compensate.
Timing risk is real. Glamsterdam's scope exceeds prior upgrades, and the interaction between ePBS and block-level access lists has not been tested at mainnet scale. Three specific delay vectors have been flagged: ePBS complexity, cross-client parity, and gas repricing behavior under real load. Developers have said repeatedly that getting ePBS right outranks any date.
And the historical pattern after activation is negative. ETH has typically dropped 10% to 15% in the days following a major upgrade as pre-positioned investors take profits. The Merge, Shapella and Pectra all followed that template.
So the fork is a scaling win, a burn headwind, and a sell-the-news risk arriving inside three weeks.
Layer-2 Cannibalization Is the Structural Bear Case Nobody Solves
The bear thesis on Ethereum is not macro and it is not technical. It is that the network's own scaling strategy transfers value away from the token.
Rollups process transactions off the base layer and settle compressed proofs back to it. That was the design goal and it worked — Ethereum's effective throughput is orders of magnitude higher than mainnet capacity. The consequence is that fee revenue, and therefore burn, accrues to the L2 operators rather than to ETH holders. Activity growth on Base, Arbitrum, Optimism and their peers generates far less ETH burn per unit of economic value than the equivalent mainnet activity would have.
Glamsterdam is explicitly designed to address this. It is the first upgrade built to scale base-layer throughput and pull activity back to L1, which would restore the burn linkage if it works. But a 78.6% fee reduction is a strange tool for that job — cheaper base-layer transactions attract volume, and whether total burn rises depends entirely on whether volume grows more than 4.7x to offset the per-transaction fee cut.
That is a genuinely open question. Glamsterdam does not fully resolve L2 fee cannibalism, and the structural challenge to ETH's value accrual remains after activation. Analysts split on this: some build a constructive 2026 thesis on capacity expansion plus staking-ETF demand, others stay cautious on fee cannibalization and macro conditions. The debate is legitimately two-sided rather than a bull case with skeptics attached.
The competitive dimension makes it sharper. Alternative L1s are pitching themselves as global payments settlement layers with lower fees and simpler user experience, and the market has been willing to fund those narratives. Ethereum's defense is neutrality, security budget and the $161 billion stablecoin base — real advantages that do not translate into token cash flows.
Put the pieces together and the honest valuation framework for ETH at $1,905 is uncomfortable. Roughly a third of supply is staked earning 2.6% to 3.0%. Base-layer fee revenue is being deliberately reduced. Application-layer value accrues to rollups. The asset's monetary premium rests on a burn mechanism whose inputs are shrinking.
The counter is that a 61.5% drawdown may already price all of that. Which is exactly the argument for buying the $1,849 support rather than chasing $2,000.
Scenarios Into August 12 CPI and the End-August Fork
Base case, roughly 45% weight: ETH consolidates between $1,800 and $2,050 through the August 12 US CPI print and into the Glamsterdam window. The 50-day EMA at $1,849 holds, the $1,980–$2,030 supply zone caps, ETF flows continue at the current $50 million to $100 million weekly pace without accelerating, and price chops with 10% to 15% realized volatility. Month-end lands between $1,850 and $1,980. Base target $1,980.
Bull case, roughly 35%: July CPI comes in soft on August 12, September Fed hike odds fall below 30%, and ETF inflows compound past $150 million weekly as staking-product demand broadens beyond one issuer. ETH clears $2,000 on volume, triggering short covering, and runs to $2,062 at the Fibonacci extension and then $2,200 at the 200-day EMA. A full extension targets $2,200 to $2,450 — an 18% to 31% gain from spot. This scenario requires flow persistence plus a Glamsterdam activation that does not trigger the usual post-fork profit taking.
Bear case, roughly 20%: CPI reaccelerates on energy, the September hike gets repriced back above 60%, and Glamsterdam slips to Q4 on ePBS complexity or cross-client parity failures. ETH loses $1,890, then the 50-day EMA at $1,849, then $1,800. Below $1,780 the structure breaks and $1,750 comes fast, with $1,700 as the line whose loss raises liquidation risk toward $1,550. A post-activation sell-the-news drop of 10% to 15% from $1,905 lands at $1,620 to $1,715 on its own.
The asymmetry is modestly favorable — 5% to the $2,000 trigger versus 3% to the $1,849 invalidation — but the flow evidence caps enthusiasm. Three weeks of Ether ETFs out-gathering Bitcoin funds produced a move from $1,867 to $1,905. That is $38 for the best relative flow stretch in eighteen months.
Watch the weekly ETF print above all else. A continuation of positive flows is the one variable that can push ETH through technical resistance that has held since May.
Levels and Verdict
Ethereum at $1,905 has built the most constructive structure it has shown all year and cannot convert it. The higher-low sequence from $1,450 through $1,900 is real. Daily RSI above 54 is real. Exchange balances at multi-year lows, 475,000 ETH leaving major exchanges in a four-day June window, roughly 33% of supply staked and locked, $42 billion of DeFi TVL and $161 billion of stablecoins settling on the network are all real.
So is the $1,980–$2,030 ceiling that has rejected every attempt since May, and so is a 61.5% drawdown from $4,953.73 that no amount of on-chain tightness has reversed.
The map: first resistance $1,930, then $1,965 to $2,000, then $2,062 at the Fibonacci extension and $2,200 at the 200-day EMA. Support at $1,890, then $1,850 to $1,870, then the 50-day EMA at $1,849 as the invalidation. Below it, $1,800, $1,780, $1,750, $1,700, and liquidation risk toward $1,550.
The flow turn is the genuine new information. Spot Ether ETFs out-gathered Bitcoin funds for three consecutive weeks, took $105.44 million the prior week — the best since April 2026 — and added $53.1 million and $60.8 million on August 4 and 5. Staking products mechanically lock spot ETH with every dollar of creation, which is a supply channel Bitcoin's complex cannot replicate.
The structural drag is equally concrete. Staking yields 2.6% to 3.0% gross against an 18% staking fee layer and a 4.60% ten-year Treasury. Glamsterdam targets end-August with a threefold gas limit increase and a 78.6% fee reduction — a scaling win that suppresses the burn ETH's monetary case rests on. L2 cannibalization remains unresolved after the fork. Post-upgrade drawdowns of 10% to 15% are the historical norm.
Verdict: buy the $1,849 support, do not chase $2,000. Long above $1,930 with a stop below $1,890 targets $2,000 and then $2,062, extension $2,200. A confirmed daily close above $2,000 on expanding volume is the only signal that converts this from range to trend, and it needs the August 12 CPI print to cooperate.
Own ETH as the highest-beta expression of a Fed pause, size it for a fork that may sell the news, and understand that the asset's terminal value question — whether network growth ever accrues to the token — is still unanswered at 61.5% below the high.