





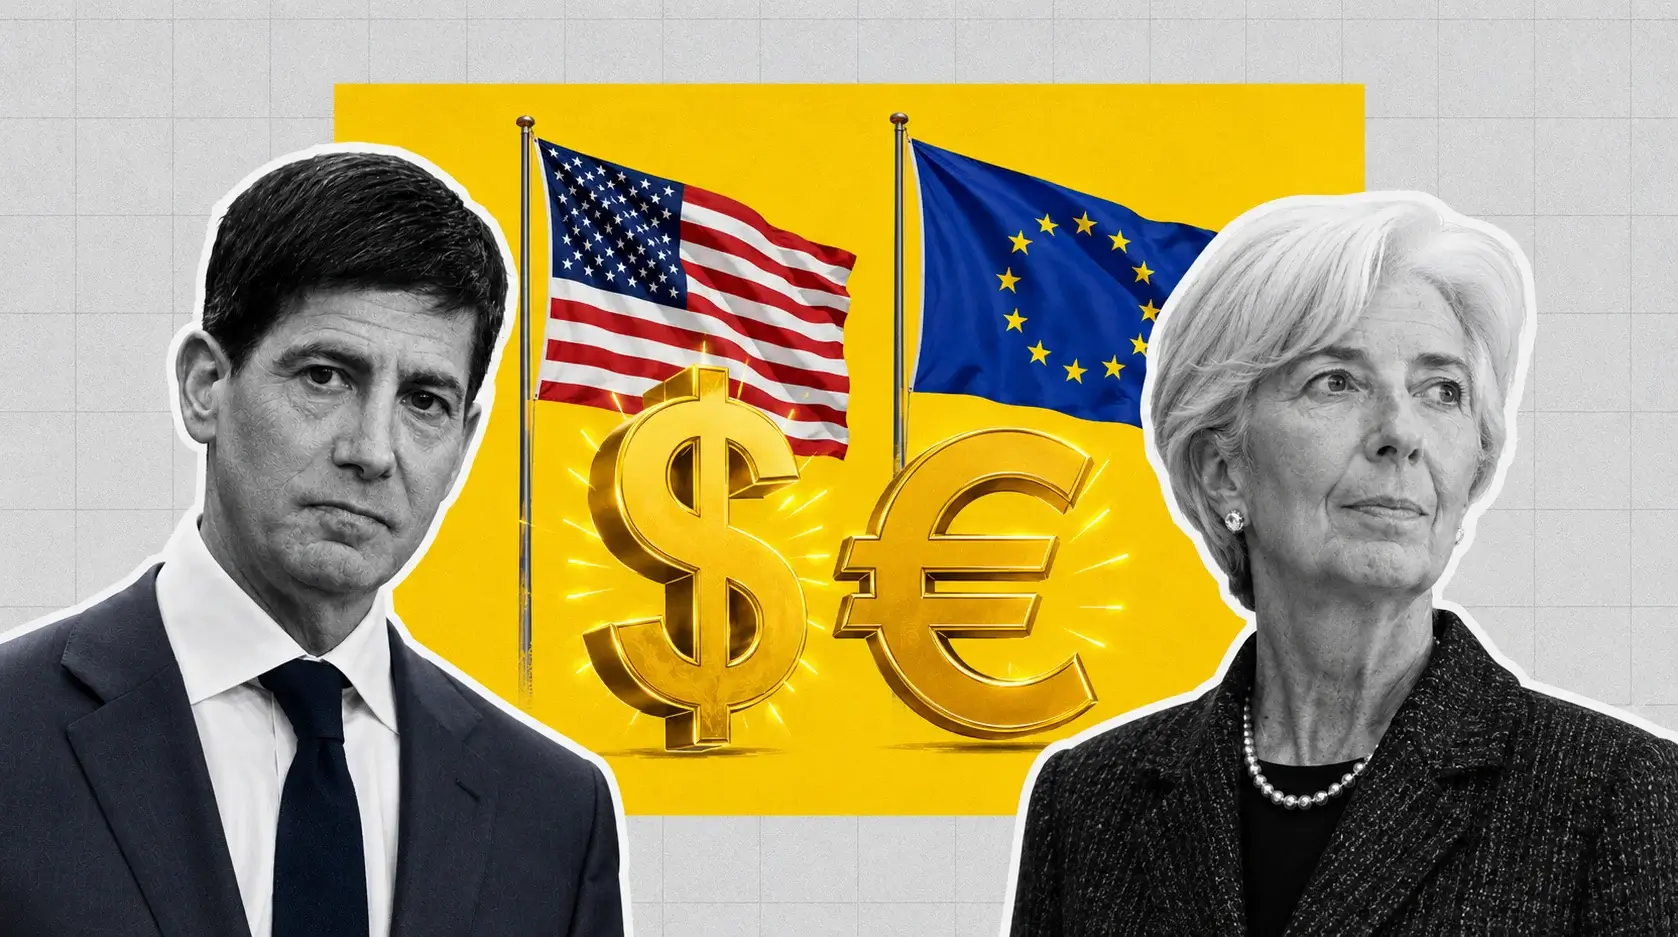
Euro Defends 1.1600 as Both Central Banks Hike Into the Same Oil Shock — 1.1660 Is the Line That Matters
German energy inflation ran 10.5% while core held at 2.4% | That's TradingNEWS
Key Points
- EUR/USD trades near 1.1600 after Friday's 0.57% drop to 1.15830 on Warsh's Jackson Hole remarks.
- German flash HICP hit 2.9% versus 3.1% expected, with energy at 10.5% and core flat at 2.4%.
- The ECB deposit rate at 2.25% faces a near-fully-priced 25bp hike on September 10.
EUR/USD trades near 1.1600 into the close of August, having spent Monday clawing back part of what Friday cost it. The pair slipped to one-week lows near the 1.1600 handle in Asian dealings, traded around 1.1595 through the European session, and holds moderate daily gains of roughly 0.15%. Friday's close was 1.15830, a 0.57% decline that came almost entirely in the ninety minutes after Federal Reserve Chair Kevin Warsh spoke at Jackson Hole.
The move erased a three-month high. On August 25 the pair traded 1.16706, holding above its 200-day moving average near 1.1650 with the 1.1800 resistance band in view. Six sessions later it is 1.5 big figures lower and back below every reference level it had cleared.
The dollar did the work, not the euro. Warsh's remarks pushed September Fed hike odds from 35.4% to 59.7% by late Friday morning, and the dollar index rose 0.4% to 99.57 — its strongest single-day gain in about two months. Every major fell against the greenback: the euro 0.57% to 1.15830, sterling 0.43% to 1.35307, the Australian dollar 0.40% to 0.71611, the New Zealand dollar 0.63% to 0.59073. USD/JPY rose 0.42% to 159.972 and has since broken 160. Unidirectional dollar strength, not idiosyncratic euro weakness.
Monday brought a partial unwind. The dollar eased in Asian trading, the two-year Treasury yield backed off two basis points to 4.32%, and the euro recovered. Germany's flash August HICP landed at 2.9% year over year against a 3.1% consensus — a miss that barely moved the pair, which tells you where the pricing power currently sits.
The euro is also underperforming elsewhere. EUR/JPY slipped 0.1% to near 185.20 as the yen firmed on Bank of Japan hike expectations running near 84% for September. The single currency is not being bought, it is being bought back.
The thesis for this forecast: the Fed and the ECB are both hiking into the same oil-driven inflation shock, which is why the rate differential has barely moved all year and why EUR/USD keeps failing at 1.1660 and holding above 1.1520. This pair does not break out until one of the two central banks blinks. Friday, September 4 and Thursday, September 10 are the two dates that could make that happen.
German HICP at 2.9% Missed Consensus and the Euro Did Not Care
Monday's German inflation print was the euro's own catalyst, and it landed soft.
Preliminary August HICP from Destatis came in at 2.9% year over year against estimates of 3.1%, up from 2.8% in July. On a monthly basis it grew 0.2%, below the 0.3% consensus and well under July's 0.9%. The national CPI measure also printed 2.9% annually and 0.2% monthly, the highest level since April but below the 3.0% market expectation.
Consumer price data from all six German states reporting ahead of the national figure came in higher than July readings, which is why the market was positioned for 3.0% to 3.1%. The aggregate undershot both.
EUR/USD reaction: 0.15% higher, to near 1.1595. That is nothing. A soft inflation print from the eurozone's largest economy, on a day the market is nearly fully priced for an ECB hike in ten days, produced no meaningful repricing at all. Interest rate expectations remained unchanged.
The composition explains the non-reaction better than the headline does. Energy inflation accelerated to 10.5% year over year from 8.3% in July and 3.4% in June — a direct pass-through from the Iran conflict and higher crude. Services inflation eased to 2.8% from 2.9%. Food inflation slowed to 0.1% from 0.4%. Core inflation, excluding energy and unprocessed food, held unchanged at 2.4%.
That is an energy shock, not a demand shock. Every component the ECB actually controls either eased or stayed flat. The only thing pushing headline higher is the price of oil, which no European rate decision affects.
The distinction matters enormously for the September meeting. A central bank hiking against a core reading stuck at 2.4% with services decelerating is a central bank managing expectations rather than demand. That is precisely the framing Danske Bank applied, calling the latest data — energy-driven headline gains in French and Spanish HICP alongside muted core momentum and softer French GDP — marginally dovish versus market pricing.
Eurostat publishes the eurozone flash HICP on Tuesday, September 1. If the bloc-wide print mirrors Germany's composition, the euro loses its inflation premium and the hike gets delivered as a one-and-done.
Energy at 10.5% Is Doing the ECB's Work, and It Cuts Both Ways
The eurozone's inflation problem in August is an imported energy problem, and Monday's oil move made it worse.
U.S. forces struck two rocket launchers on Iran's Larak Island in the Strait of Hormuz on Sunday, the first publicly confirmed strike on Iranian territory since late July, with Central Command stating the launchers were preparing to lay mines in the waterway. Iran's Revolutionary Guards responded by firing on two U.S. air bases in Jordan. Brent gained 3.5% to $91.20 a barrel and West Texas Intermediate 3.5% to $86.30 by 05:06 ET. Treasury Secretary Scott Bessent said new secondary sanctions on Iran would be announced weekly, starting with banks tied to the regime.
Friday's settlements had been $89.31 for Brent and $83.40 for WTI, capping the first weekly decline in three as traders reframed the standoff from a supply crisis into a sanctions confrontation. That reframing lasted one weekend.
German energy prices rising 10.5% annually in August, against 8.3% in July, is the direct consequence. French HICP hit 2.7%, a three-month high. Spain climbed to 4.5%, its highest since 2023 and more than double the ECB's target. Every one of those prints is energy-led.
The two-sided nature of this is what makes EUR/USD so hard to trade. Higher energy costs strengthen the immediate case for ECB tightening — the euro's inflation premium. They also degrade the eurozone's terms of trade, because the bloc imports the energy it is now paying more for. One leg is euro-positive, one is euro-negative, and they arrive simultaneously.
Which one dominates depends on the horizon. Over days, the hike premium wins and the euro firms. Over quarters, the terms-of-trade hit compounds into weaker growth and a wider current account drag.
A de-escalation headline would deflate the dollar's haven bid and the euro's inflation premium at the same time, which is why oil-driven moves in this pair rarely resolve into clean direction. Qatar and Oman have both attempted mediation. Neither has produced a reopening of the strait.
Watch Brent through $95. Above that level the terms-of-trade argument overtakes the rate-premium argument and the euro loses the energy trade outright.
The September 10 Meeting Is Nearly Fully Priced
The ECB's Governing Council concludes its next monetary policy meeting on Thursday, September 10, with the decision published at 14:15 CET and Christine Lagarde's press conference at 14:45. It is one of the four meetings a year that carries updated Eurosystem staff macroeconomic projections, which historically produces the largest market reaction of any ECB session.
Markets are nearly fully priced for a 25 basis point increase. That would lift the deposit facility rate to 2.50% from 2.25%, the main refinancing rate to 2.65% from 2.40%, and the marginal lending facility to 2.90% from 2.65%. The €STR benchmark last printed 2.189%.
The precedent is June. The Governing Council raised all three key rates by 25 basis points at its June 10–11 meeting, effective June 17, marking the first ECB hike since September 2023, when the deposit rate peaked at 4.00%. The stated rationale was explicit: the war in the Middle East is generating inflation pressures, and the decision was described as robust across a range of scenarios mapping how the shock might evolve. June staff projections put headline inflation averaging 3.0% in 2026, 2.3% in 2027 and 2.0% in 2028, with the ex-energy-and-food baseline at 2.5% for 2026 and 2027 and 2.2% for 2028. Those numbers were revised up from March specifically because of a higher energy path.
Lagarde was careful at the time. She characterised the move as not an insurance hike, not a cycle, and not the beginning of a cycle. The July 23 meeting held all three rates unchanged.
The forward pricing is where the euro's upside lives. Markets see the deposit rate reaching 2.80% by March 2027, up from 2.25%, and around 2.90% by late 2027, implying roughly a 60% chance of a move to 3.00%. Recent Governing Council minutes pointed toward another increase, and reporting indicated policymakers are prepared to raise in September to contain the fallout from the Iran war while remaining reluctant to signal anything beyond that.
Danske Bank's read is that September will be the final hike for now, citing declining firms' selling price expectations. One more 25 basis points, then a pause.
If Lagarde validates that framing on September 10, the euro sells the fact.
Both Central Banks Are Hiking Into the Same Shock
This is the structural reason EUR/USD has gone nowhere in 2026 despite enormous headline volatility.
The pair opened the year as the consensus long trade on Wall Street, with Goldman Sachs, Deutsche Bank and MUFG all targeting 1.24 to 1.25 by year-end. That call rested on rate divergence — a Fed cutting toward neutral while the ECB held. The Hormuz conflict destroyed the premise. It pushed inflation sharply higher on both sides of the Atlantic, the ECB hiked on June 11 for the first time since 2023, and the Fed shifted from signalling cuts to signalling hikes.
What followed was not divergence but convergence in direction. Both central banks are now leaning hawkish, and neither is providing the clear differential signal that drives a trend move in a currency pair. EUR/USD pulled back from its 2026 high of 1.20 to test critical support at 1.14 — the 23.6% Fibonacci retracement of the 2022–2026 rally — and has spent the summer chopping between there and the mid-1.16s.
The current setup is the same problem in miniature. September Fed hike odds sit at 58% with December at 80%. September ECB hike odds are near 100%. If both deliver, the differential is unchanged. If the Fed delivers and the ECB is done after one, the differential widens in the dollar's favour. If the Fed holds and the ECB hikes, the differential narrows.
Only two of those three outcomes move the pair, and the market is currently priced for the one that does not.
That is why Friday's shock produced 0.57% rather than 2%. The euro leg of the trade already had a hike embedded. Warsh moved only the dollar leg, and only partially, because 58% is a lean rather than a done deal — the threshold at which the Fed tends to validate market pricing sits between 60% and 70%, and a certainty reads 90% or higher.
The pair breaks its range when one central bank blinks. Everything else is noise inside a band.
The Rate Differential: 3.50%–3.75% Against 2.25%
The nominal policy gap currently stands at 125 to 150 basis points in the dollar's favour, and it has held roughly there for months.
The Fed has kept the target range at 3.50%–3.75% for five consecutive meetings. The ECB deposit rate sits at 2.25%. On the yield curve the gap is wider still: the U.S. two-year closed Friday at 4.36% after ripping 11.97 basis points in a session to its highest since July 24, and the ten-year finished at 4.72% with the thirty-year at 5.21%. The full U.S. curve — 3.83% at three months, 4.13% at one year, 4.49% at five years — offers carry the eurozone cannot match at any tenor.
That carry is the dollar's floor. It is also why the euro's rallies have been shallow and its declines have been fast.
The offset is fiscal. The U.S. national debt crossed $40 trillion, long-dated Treasury yields sit at multi-year highs, and the Treasury has been actively intervening — doubling the maximum size of long-dated buyback operations, with the first at $4 billion or larger scheduled for September 9. Reporting has highlighted the contrast between Treasury pushing long yields down and the Fed Chair emphasising inflation discipline. Rabobank framed the euro-dollar outcome as exactly that tug of war, noting that markets have strong belief in the ECB's inflation-fighting credentials while the Fed's credibility remains up for debate.
That credibility gap is the euro's structural bid, and it is the reason a currency backed by a 2.25% deposit rate is trading at 1.16 against one backed by 3.50%–3.75%. Pure carry logic would have this pair considerably lower.
Eurozone inflation expectations have stayed relatively contained even as headline reached 3.2% earlier in the year. U.S. long-run expectations have not: the University of Michigan five-to-ten-year measure held at 3.3% for a third consecutive month, above the entire 2.8%–3.2% range of 2024, with year-ahead expectations at 4.0%.
If Warsh hikes in September specifically to defend that credibility, the dollar's fiscal discount narrows and the euro loses its best structural argument.
Warsh at 58% and the Front-End Repricing That Did the Damage
The mechanics of Friday matter because they define what a reversal would look like.
Warsh told Jackson Hole that inflation data are more concerning than labor-market trends, that inflation is unlikely to return to target on its own, and that the Fed will have work to do if policymakers are not confident underlying inflation is heading to 2% clearly and at sufficient speed. He cited PCE at 3.7%. He noted more than half of tracked goods and services saw price increases of 3% or higher over the past year against roughly one-third in the two decades before the pandemic. He described financial conditions as not restrictive.
September hike odds jumped to 59.7% from 35.4% on Thursday and 39.9% a week earlier, per CME FedWatch. December odds moved to 80%. The two-year ripped nearly twelve basis points. The dollar posted its largest one-day gain in two months.
The curve shape is the part traders should focus on. While the two-year spiked, the thirty-year held flat at 5.19% and the ten-year rose less than four basis points — a textbook bear flattener. The market is pricing near-term tightening and betting it works to contain long-end inflation compensation. Robin Brooks of the Brookings Institution argued a September hike would be aimed at anchoring the ten-year and avoiding a repeat of the post-July 29 bond selloff, calling it performative with the principal aim of keeping financial conditions loose.
If that read is correct, the dollar's Friday gain is a spike rather than a trend. A hike that succeeds in compressing term premium reduces the fiscal risk discount on the dollar — but it also does not deliver the sustained tightening that widens a carry differential.
Monday's price action supports the spike interpretation. The two-year eased two basis points to 4.32%, the dollar backed off, and EUR/USD recovered from sub-1.1600 to hold the handle. One session of consolidation is not a reversal, but it is the market declining to extend the move.
The 58% figure is the one to track. Below 45% the dollar gives back Friday entirely.
Read More
-
Yen Stalls at 160 Despite a 3% JGB and Tokyo Core CPI at 2.0% — Intervention Sits at 164, Friday's Payrolls Decide
02.09.2026 · TradingNEWS ArchiveEnergy
-
QQQ ETF ($706.22) Slides 7.4% Below Its High as the Market Reprices the AI Capex Bill — $686.57 Target if $700 Breaks
22.10.2026 · TradingNEWS ArchiveStocks
-
XRPI ($7.00) and XRPR ($10.74) Slide Toward 52-Week Lows as Spot XRP ETF Flows Stall at $708,510
22.10.2026 · TradingNEWS ArchiveCrypto
-
NG ($2.775) Decoupled From Europe’s €88 Gas Crisis as LNG Feedgas Hits 18.9 Bcf/d — $3.30 Upside on Cold Weather
22.10.2026 · TradingNEWS ArchiveCommodities
-
Dollar-Yen (157.35) Loses 157.65 as the Yen Rallies on Haven Demand — 155 Target if 156 Breaks
22.10.2026 · TradingNEWS ArchiveForex
The Eurozone Is Structurally More Exposed to Hormuz Than the U.S.
This asymmetry is underpriced and it is the strongest medium-term bear case for the euro.
The eurozone is a net energy importer. The United States is a net energy exporter. When Brent goes from $89.31 to $91.20 on a Larak Island strike, the U.S. terms of trade improve at the margin and the eurozone's deteriorate. The bloc is also geographically closer to the conflict, which raises the risk premium on European assets independent of the commodity move.
The transmission is already visible in the data. German energy inflation accelerating to 10.5% year over year while core held at 2.4% is the cleanest illustration available: the entire inflation overshoot is imported, and it is a tax on European consumers and manufacturers rather than a symptom of domestic demand strength.
That distinction is why an ECB hike into an energy shock is a defensive move rather than a confident one. The central bank is raising rates to prevent an imported price shock from unanchoring expectations, in an economy that contracted 0.2% quarter over quarter in the first quarter of 2026 and is running annual growth near 0.8%. Economists warned of stagflation at the time of the June hike, and the August data has not disproved them.
Persian Gulf crude exports have recovered to 15–16 million barrels per day against pre-conflict volumes of 22–24 million and a March trough near 5–6 million, with roughly 6 to 8 million barrels transiting Hormuz daily. That recovery is what allowed EUR/USD to rally into late August. Sunday's escalation puts it back in question.
The trade implication is directional and simple. Escalation headlines are euro-negative even when they lift ECB hike odds, because the growth hit outweighs the rate premium in a bloc with this little growth cushion. De-escalation headlines are euro-positive on the same logic reversed, even though they would lower ECB pricing.
Anyone treating higher oil as an ECB-hawkish, euro-positive input is trading the first-order effect and ignoring the second.
Q2 GDP Beat, but Q1 Contracted 0.2% and Growth Runs Near 0.8%
The euro's cyclical case improved in August, and the improvement is thinner than the headlines suggested.
Eurozone second-quarter GDP came in stronger than expected, which Rabobank cited directly as evidence the economy has held up better than feared. German business confidence beat expectations. Those two datapoints, alongside the energy-driven inflation prints, are what pushed EUR/USD to a three-month high of 1.16706 on August 25 and firmed September ECB pricing.
Against that, the first quarter saw the bloc shrink 0.2% quarter over quarter. Annual growth is running near 0.8%. French GDP came in softer in the latest read, and France carries its own political uncertainty premium that has periodically weighed on the euro throughout 2026.
A bloc growing at 0.8% with a central bank raising rates into an imported energy shock is not a currency with a growth story. It is a currency with a policy story, and policy stories have shorter half-lives.
The comparison is unflattering. U.S. labor data is deteriorating — July payrolls fell 23,000 against an +83,000 consensus, May and June were revised down a combined 103,000, participation slid to 61.4% — and the Chicago Business Barometer collapsed 10.5 points to 47.1 in August, the first contraction in four months. But U.S. equity indexes closed August higher, the S&P 500 returned 13.43% year to date through August 28, and the dollar still commands a 125 to 150 basis point policy premium.
Continued U.S. economic outperformance is one half of the contested medium-term picture. The other half is the fiscal deficit and dollar debasement concern that has kept the euro elevated relative to what the carry differential alone would justify.
Neither side has won that argument in eight months of trading. Until one does, the pair mean-reverts.
COT Positioning Has Turned Net Bearish on the Euro
Speculative positioning stopped supporting the euro months ago, and the latest data confirms it.
The Commitments of Traders report dated August 25 shows the net position of non-commercial traders has turned bearish and has decreased significantly across 2026 as geopolitical events reshaped the trade. Traders have been shedding euro exposure in favour of the dollar for months, with the Middle East conflict making the dollar temporarily attractive as the reserve destination.
That matters for two reasons. First, it removes the crowded-long overhang that made every euro rally vulnerable to a squeeze earlier in the year. Second, it means the pair's failure to break 1.1670 in late August happened without heavy speculative buying — the rally was dollar weakness rather than euro demand, which is a lower-quality advance.
The weekly FX heat map through August 29 showed the euro's sharpest decline against the dollar of any major cross, comparing prices at 18:21 UTC on August 29 against the August 22 daily close. The single currency underperformed everything.
The counter-argument from the positioning bears themselves is that this is a temporary condition. The war made the dollar attractive; once that factor expires, the flow normalises. Some desks argue that process may already be complete, with no fundamental factors currently supporting sustained dollar strength beyond the rate path.
Rabobank's framing captures the current state: messy trade around 1.16 to 1.17 first, then a gradual move towards 1.18 into spring. That 1.16 floor is already being tested. If Fed hike pricing keeps building, EUR/USD spends more time below the 1.16–1.17 zone. If Treasury intervention pulls long yields lower while confidence in U.S. policy comes under pressure, the dollar side reverses quickly.
Positioning that is net short into a two-sided catalyst week is positioning that can be forced. A weak payrolls print on Friday has more fuel behind it than a strong one.
The Level Map: 1.1520, 1.1620, 1.1660, 1.1800
The technical structure is a range with well-defined edges, and the pair sits in the middle of it.
Immediate resistance is 1.1620. Above it, 1.1660 is the level that matters most — it sits directly on the 200-day moving average zone near 1.1650 and coincides with the hourly 100-period and 200-period simple moving averages at 1.1658 and 1.1655. A daily close above 1.1660 opens 1.1710 and then 1.1750. Above 1.1750, the 1.1800 resistance band comes into view, and that band capped every attempt through August.
The August 25 high of 1.16706 is the reference peak. Reclaiming it would mean Friday's Warsh shock was fully absorbed.
Downside is where the structure gets serious. The first major support is 1.1520, which aligns with the 200-period simple moving average on the four-hour chart. A downside break and daily close below 1.1520 would start a major leg lower, with bears targeting 1.1440 and then 1.1420. Below 1.1420 sits 1.1400 — the 23.6% Fibonacci retracement of the entire 2022–2026 rally and the level the pair defended in June and July.
Between 1.1520 and 1.1620 is roughly 100 pips of empty space with no meaningful structure. That is where price is now.
Momentum is neutral rather than directional. The pair ended its upward trend on the hourly chart on Friday but held its longer-term support zone. The 50-day moving average has been leaning toward the 200-day, a configuration that would eventually produce a golden cross — but that process remains some distance from completion and a failed 1.1660 test would push it back.
The trading read: 1.1520 and 1.1660 define the near-term box. Neither the German inflation miss nor the Iran escalation nor the Warsh repricing has been sufficient to break it. It takes a U.S. labor surprise or an ECB projection surprise.
Range call into September 10: 1.1520 to 1.1710.
Bank Forecasts Span 1.12 to 1.26, and the Spread Is the Whole Story
Sell-side dispersion on this pair is extreme, which is exactly what you would expect when two central banks are moving the same direction.
Standard Chartered raised its 12-month EUR/USD forecast to 1.20 from 1.18. Danske Bank forecasts 1.12 over the same horizon. That is an 800-pip disagreement between two major desks on identical information. Rabobank sits between them at 1.18 into spring, having brought that target forward as U.S. debt-market concerns intensified.
The scenario framework circulating on the sell side puts roughly 25% probability on a bull case of 1.21 to 1.26 — requiring U.S. inflation to cool fast enough to take the Fed hike off the table while the ECB delivers a second increase, restoring genuine divergence. It assigns roughly the same 25% to a bear case of 1.08 to 1.13, requiring the Iran ceasefire to fully collapse, oil to re-spike, and the Fed to deliver one or two actual hikes the ECB cannot match given 0.8% eurozone growth. In that scenario 1.1400 breaks and the pair extends toward 1.10.
The remaining 50% is the range. That is the honest base case and it is where price has lived since June.
Note how far consensus has travelled. Goldman Sachs, Deutsche Bank and MUFG all opened 2026 targeting 1.24 to 1.25 by year-end. The pair peaked at 1.20 and has spent the rest of the year retracing. Every one of those forecasts rested on Fed easing that never arrived.
Nearer-term technical projections cluster around 1.12 to 1.16 while broader bank consensus for the rest of 2026 sits closer to 1.18 to 1.25. That gap between what the charts imply and what the fundamental desks publish has persisted for months, and the charts have been right.
The practical conclusion: nobody has a mechanism for 1.24 that does not require the Fed to cut, and nobody has a mechanism for 1.08 that does not require the ECB to stop at 2.50% while oil goes to $110. Both are tail scenarios. Position for the middle.
The Week That Decides: Eurozone Flash CPI, ISM, ADP, Payrolls
Five prints across four sessions, and they arrive from both sides of the pair.
Tuesday, September 1 carries the eurozone flash HICP for August alongside U.S. ISM Manufacturing PMI, July JOLTS job openings and the Atlanta Fed's Q3 GDP estimate. Massachusetts holds midterm primaries. Wednesday, September 2 brings U.S. ADP private payrolls and July factory orders, with Bank of Canada and Reserve Bank of New Zealand decisions landing the same session. Thursday, September 3 delivers Challenger layoffs, weekly jobless claims, the July trade balance and ISM Services, with Fed Governor Waller speaking. Friday, September 4 is the August employment report.
Then the ECB on Thursday, September 10 with new staff projections, U.S. CPI on September 11, and the FOMC on September 16.
The euro-side test is Tuesday. If the bloc-wide flash HICP mirrors Germany's composition — headline lifted by 10.5% energy while core stays anchored near 2.4% and services decelerate — the ECB hike becomes a one-and-done and the euro's inflation premium deflates ahead of September 10.
The dollar-side test is Friday, and the setup is asymmetric. July payrolls fell 23,000. Government shed 53,000 while private added 30,000. Household employment dropped 87,000 and the labor force contracted 264,000. Average hourly earnings grew 3.2% year over year, the slowest since May 2021. The preliminary benchmark revision came in at -79,000. Capital Economics forecasts +90,000 for August with unemployment unchanged at 4.2%.
A payrolls print below 40,000 pushes September Fed hike odds under 45% and sends EUR/USD through 1.1660 toward 1.1710. A print above 130,000 with wages firming pushes odds past 70% and tests 1.1520. Anything in between leaves the pair in its box.
CPI does not print until September 11, so this week is a labor and manufacturing read on the U.S. side and a pure inflation read on the European side. That split is unusual and it means the two legs of the pair are trading different variables.
EUR/USD Price Forecast: 1.1440 Downside, 1.1710 Upside, Range-Bound Between 1.1520 and 1.1660
EUR/USD at 1.1600 is trading a rate differential that has barely moved in six months, and the technical structure reflects exactly that.
The bear case has four supports. The nominal policy gap sits at 125 to 150 basis points in the dollar's favour with the U.S. two-year at 4.36% and the thirty-year at 5.21%, carry the eurozone cannot match at any tenor. German core inflation held flat at 2.4% with services decelerating to 2.8%, meaning the September ECB hike is defensive and probably terminal — Danske explicitly calls it the last one before a pause. Brent at $91.20 after the Larak Island strike hits an energy-importing bloc harder than an energy-exporting one, and eurozone growth near 0.8% has no cushion. And COT positioning as of August 25 has turned net bearish on the euro.
The bull case has three. September Fed hike odds at 58% are a lean rather than a done deal, and the front-end move already partially unwound Monday with the two-year back to 4.32%. U.S. labor data is deteriorating fast enough that Friday could reprice the entire dollar leg, with July payrolls negative and revisions running against the hawks. And the fiscal argument remains live: $40 trillion of debt, Treasury actively suppressing long yields with $4 billion-plus buybacks from September 9, and a Fed whose inflation credibility is, in Rabobank's framing, still up for debate while the ECB's is not.
The verdict is range-bound with a mild upside skew above 1.1520. Base case through September 10: 1.1520 to 1.1710, midpoint near 1.1615. Upside target on a daily close above 1.1660 is 1.1710, then 1.1750, with the 1.1800 band the ceiling that has held all summer. Reaching 1.1800 requires Fed hike odds below 40%. Downside target on a daily close below 1.1520 is 1.1440, then 1.1420, with 1.1400 the structural floor at the 23.6% retracement of the 2022–2026 rally.
Trade the payrolls print, then reposition for the ECB projections. The German miss on Monday told you the euro leg is already priced. Everything left is dollar.





