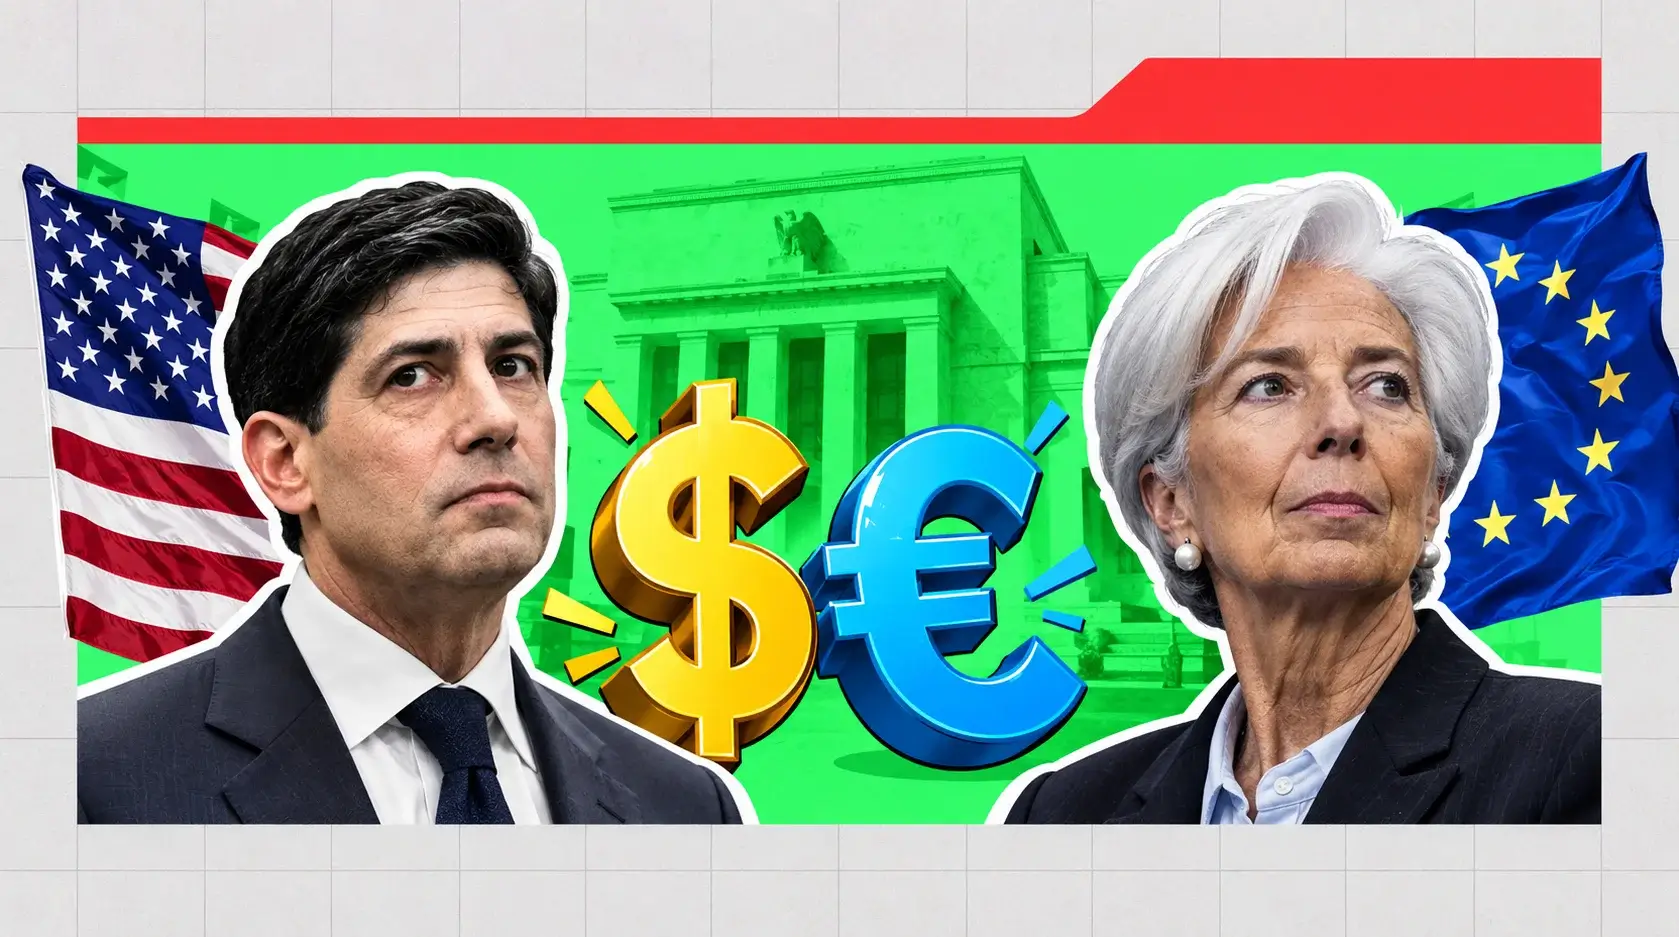
Euro Slides to 1.1604 Despite an ECB Hike as the Dollar Index Reclaims 99.10
The ECB lifted all three key rates 25 basis points and raised its 2027 core inflation forecast to 2.6% | That's TradingNEWS
Key Points
- EUR/USD dropped to 1.1604 after the ECB hiked its deposit rate to 2.50% from 2.25%.
- August headline PPI hit 5.4% annually while core PPI missed at 0.2% month over month.
- Fed hike odds reached 64% for September 15–16 as the 10-year yield climbed to 4.90%.
EUR/USD traded at 1.1604 shortly before 1:00 p.m. GMT Thursday, down roughly 0.25% on the day, having spent the Asian and early European sessions holding above 1.1600 and touching 1.1638 ahead of the European Central Bank decision.
The pair went into the event with momentum. Wednesday's close at 1.1652 marked a 0.33% gain and a recovery from an intraday low near 1.1608, driven almost entirely by positioning ahead of the announcement. Euro swap rates had risen roughly 8 basis points across the two-year to ten-year segments of the curve on Wednesday as energy prices climbed, and the currency had clawed back above its 200-day moving average at 1.1623 for the first time since the early-September correction.
Then the ECB delivered a 25-basis-point hike, revised its inflation projections higher, and the euro fell.
That reaction is the entire story of this session and the central problem for anyone forecasting the pair into next week. A central bank tightening into an energy shock, upgrading its price outlook, and explicitly warning that inflation risks are skewed higher would normally be an unambiguous currency positive. It produced a 50-pip decline instead, because the market had priced the hike in full and was trading the guidance rather than the decision.
The dollar side did the rest. August producer prices came in hot on the headline, the dollar index recovered from an intraday low of 98.71 to 99.10, and the benchmark 10-year Treasury yield climbed toward 4.90% — its highest since November 2023.
The context is a range that has held for three weeks. EUR/USD peaked at 1.1712 on August 21, corrected 1.23% to a low of 1.1566 on September 2, and has traded between roughly 1.1580 and 1.1650 ever since. Thursday's move takes the pair back toward the middle of that band rather than through either side of it.
Five-day average volatility sits at 40 pips, which is low by any standard for a pair going into a central bank decision and a U.S. inflation print in consecutive sessions.
What the ECB Actually Did: Three Rates, 2.50%, and Higher Inflation Forecasts
The Governing Council raised all three key interest rates by 25 basis points at the 12:15 GMT announcement, the second increase of 2026. The deposit facility rate moves to 2.50% from 2.25%, the main refinancing operations rate to 2.65% from 2.40%, and the marginal lending facility to 2.90% from 2.65%.
The July 22–23 meeting had left all three unchanged, so this is a resumption rather than a continuation. The ECB framed the decision directly around the energy shock, stating that the Middle East conflict continues to generate inflation pressures and that inflation is set to remain well above target for an extended period. The language on commitment was explicit: the decision underscores the Council's determination to ensure inflation stabilises at 2% over the medium term.
The updated staff projections carry the detail that matters. Headline inflation is now forecast to average 3.0% in 2026, 2.5% in 2027 and 2.1% in 2028. Inflation excluding food and energy is projected at 2.5% in 2026, 2.6% in 2027 and 2.3% in 2028.
Read that core path carefully. It rises from 2.5% to 2.6% between 2026 and 2027 before easing to 2.3%. The ECB is forecasting that underlying price pressure gets worse next year before it gets better, and that it does not reach target inside the projection horizon. That is a hawkish set of numbers, and it is the reason interest-rate markets have been pricing a higher terminal rate than the economist consensus.
The risk assessment was equally direct: inflation risks tilted to the upside, growth risks tilted to the downside. That is a stagflationary framing, and it is precisely why the euro could not convert the decision into gains.
Eurozone annual inflation hit 3.3% in August, its highest reading in three years and 130 basis points above target. Euro area growth continues at a modest pace, expected to remain below trend through the second half of 2026 as elevated uncertainty, higher energy prices and weaker external demand weigh on activity. Balance-sheet normalisation continues as planned.
Markets are now pricing two ECB hikes in 2026, with the deposit rate reaching 3.1% by late 2027.
Lagarde Kept Optionality, and That Is What Cost the Euro Fifty Pips
The press conference at 12:45 GMT was where the euro's advantage evaporated.
President Lagarde declined to be drawn on future rate increases and was firm that she was not precommitting to any interest-rate path. She reiterated the meeting-by-meeting, data-dependent framing that has governed ECB communication all year, and justified the optionality on the grounds that eurozone inflation is being driven by a supply shock rather than by demand. She also noted surprise at the resilience of the economy.
The stance mirrors the approach the Federal Reserve chair adopted at Jackson Hole — refusing to give guidance in an environment where the inflation impulse originates outside the central bank's control. Two of the world's largest monetary authorities have now independently concluded that forward guidance is a liability when the price level is being set by tanker traffic through the Strait of Hormuz.
For the euro, the absence of a signal was the signal. Positioning into the meeting was built on the possibility that Lagarde would open the door to another increase this year, which would have pushed the terminal rate higher and lifted EUR/USD back above 1.1700. Without it, the market defaulted to the consensus view.
That consensus is bearish for the currency. A poll of economists found 91% expect the deposit rate to finish 2026 at 2.50% — meaning Thursday's move was the last one — and 78% expect it to remain there through the middle of 2027. An earlier poll characterised this as the second hike before the ECB brings what would be its shortest tightening cycle in fifteen years to an end.
Interest-rate markets have been more hawkish than that, pricing the possibility of another increase. The gap between market pricing and forecaster consensus is where the euro's next move lives, and Lagarde declined to resolve it.
European bond yields rose through the press conference, though the move is difficult to separate from crude pushing above $102 a barrel during the same window. The euro extended mild losses into and through the session.
The PPI Detail the Market Ignored: Hot Headline, Soft Core
August producer prices arrived at 8:30 a.m. ET and delivered a split verdict that the dollar traded as one-sided.
Headline PPI rose 0.4% month over month, matching consensus and accelerating from 0.1% in July. The annual figure climbed to 5.4%, slightly above the 5.3% forecast and up from 4.8%. That is a 60-basis-point acceleration in twelve-month wholesale inflation in a single month.
Core PPI told a different story. It rose 0.2% month over month, below the 0.3% forecast and below the 0.3% prior reading. On an annual basis core producer inflation rose to 4.6% from 4.3%, in line with expectations.
The distinction matters enormously and the market largely disregarded it. Headline acceleration driven by energy is a pass-through effect that reverses when crude does. Core deceleration to 0.2% monthly — a miss against forecast — suggests underlying pipeline pressure is softening even as the energy component surges. That is the opposite of an entrenched inflation problem, and it is the outcome a central bank looking through a supply shock would want to see.
The dollar bought the headline anyway. The full PPI release shows the composition, and energy does most of the work in the annual figure.
Weekly initial jobless claims printed 206,000 against 205,000 expected, a 1,000-claim variance that changed nothing.
The reason the market took the hawkish read is sequencing. August nonfarm payrolls came in at 162,000 against a consensus near 56,000, roughly a threefold beat, which removed the labor-market case for patience. With employment strong, any inflation acceleration — regardless of source — pushes the Fed toward action, because the growth cost of tightening looks manageable.
Friday's consumer price index is where the core-versus-headline split gets adjudicated for the currency. Consensus calls for 0.4% monthly headline, 3.4% annually, with core expected at 2.4%. If core CPI mirrors the core PPI miss, the dollar's Thursday gains are unwound quickly.
DXY at 99.10 and a 10-Year at 4.90% Are the Dollar's Real Support
The dollar index traded around 99.10 after the PPI release, recovering from an intraday low of 98.71. That is a swing of nearly 40 basis points on the index inside a single session, and it came almost entirely from the rates market rather than from any change in the fundamental picture.
The 10-year Treasury yield climbed to roughly 4.90%, its highest level since November 2023. It has repriced from the 4.78% to 4.81% band earlier this week. The two-year sits near 4.36%, having touched a 52-week high around 4.4% after the payroll data. The 30-year is near 5.27%.
The yield move has a supply component that has nothing to do with inflation. The Treasury Department announced it would triple its buyback of longer-dated debt to $6 billion, up from an earlier plan to at least double it to $4 billion. The long end rose on the announcement rather than falling — a $6 billion operation against record issuance was read as inadequate, and the market pushed back on an attempt to suppress term premium.
That distinction matters for EUR/USD. A dollar supported by higher real yields on hawkish policy expectations is a durable dollar. A dollar supported by higher nominal yields driven by fiscal supply concerns is a fragile one, because the same dynamic that lifts yields eventually undermines the currency.
Evidence for the fragile reading was visible before the data. The dollar had remained flat through Wednesday despite Brent topping $100 and the 10-year hitting a 2023 high, which is not the behaviour of a currency with genuine buying interest. Investors showed no appetite to add long dollar positions ahead of the inflation data and next week's FOMC, and the index drifted to 98.71 on that indifference.
The recovery to 99.10 is a reaction to a number, not a repositioning. Whether it holds depends entirely on Friday.
64% Odds on a Fed Hike Against an ECB That May Be Finished
The rate differential is the core of this trade, and it moved against the euro Thursday.
Following the PPI print, market pricing put the probability of a 25-basis-point Federal Reserve increase at the September 15–16 meeting at roughly 64%, up from around 60% before the release and from about 58% earlier in the week. The odds were near 45% a month ago, before the Jackson Hole address and the payroll beat. The target range under consideration is 3.75% to 4.00%.
Against that, the ECB has just moved to 2.50% and 91% of surveyed economists believe it is done.
Run the arithmetic. If the Fed hikes next week and the ECB holds through year-end, the policy spread widens to roughly 125 to 150 basis points in the dollar's favour. That is a meaningful carry advantage and it argues for EUR/USD toward the bottom of its range rather than the top.
The counterargument sits in the ECB's own projections. Core inflation forecast to rise from 2.5% to 2.6% in 2027 and only reach 2.3% by 2028 is not a profile consistent with a terminal rate of 2.50%. Interest-rate markets already price the deposit rate at 3.1% by late 2027, which implies two more increases beyond Thursday's. If eurozone inflation stays at 3.3% or climbs with European gas prices at three-and-a-half-year highs, the consensus forecast for a finished cycle looks premature.
There is a symmetric risk on the U.S. side. A poll of economists points to no further Fed hikes through year-end, against market pricing of 64% for next week alone. Both central banks have market pricing running well ahead of forecaster consensus, and both are refusing to arbitrate.
This is what an environment produces when neither the Fed nor the ECB will give guidance: a currency pair that compresses into a 40-pip daily range and waits for data to make the decision that policymakers will not.
Technical Structure: A Double Bottom at 1.1566 Under a Ceiling at 1.1712
The chart has produced a clean, tradeable structure over three weeks, and Thursday's move leaves it intact.
The high is 1.1712, set August 21 — a three-month peak. From there the pair corrected 1.23% to 1.1566 on September 2, where price action formed a double-bottom pattern above the 1.1570 pivot. Since Friday, September 4, following the nonfarm payroll release, EUR/USD has traded back above its rising 20-day moving average and was inching above the 200-day at 1.1623 before the ECB.
On the four-hour chart, spot held above the 200-period exponential moving average at 1.1582 and reclaimed the 23.6% Fibonacci retracement at 1.1625 during the Asian session. The four-hour RSI sat around 58 — below the overbought threshold, with room to extend — and the MACD line held marginally above zero with a shallow positive profile. Momentum was constructive without being aggressive.
Thursday's decline to 1.1604 puts the pair back below both the 200-day at 1.1623 and the 23.6% retracement at 1.1625, which converts both from support into resistance. The 4H 200-period EMA at 1.1582 is now the level that separates a correction from a trend change.
Support layers: 1.1590 as the near-term floor, 1.1582 at the 4H EMA, 1.1570 at the pivot, and 1.1566 at the double-bottom low. A daily close below 1.1566 invalidates the pattern and opens 1.1500 as the next round-number objective.
Resistance layers: 1.1623 and 1.1625 as the immediate cluster, then 1.1650 at the top of the recent range, then 1.1670, then 1.1700 and the 1.1712 high.
The major linear-regression channel still points higher, and the pair remains above its 200-day on a closing basis for the week. The structure is a bullish consolidation until 1.1566 breaks, and a failed breakout the moment it does.
Projected trading range for Thursday was 1.1590 to 1.1670. The pair has traded inside it all session.
The Euro Fell Least: Reading Thursday's Currency Board
The single most informative piece of data in this session is not the EUR/USD price. It is the dollar's performance against everything else.
The dollar gained 0.71% against the Australian dollar, 0.58% against the New Zealand dollar, 0.51% against the Japanese yen, 0.35% against the Swiss franc, 0.29% against sterling, 0.25% against the euro and 0.16% against the Canadian dollar.
The euro was the second-best performing major against the dollar on the day, behind only the commodity-linked loonie. A currency that supposedly disappointed after its central bank meeting outperformed sterling, the franc and the yen.
That reframes the session. The euro did not sell off on Lagarde. The dollar rallied on PPI, and the euro absorbed less of that rally than almost anything else — which is what a currency backed by a fresh 25-basis-point hike and upgraded inflation forecasts should do.
The Australian dollar's 0.71% decline is the outlier and it deserves explanation. AUD/USD had been extending a consolidation above 0.7200, near its highest level since May 14, supported by rising Reserve Bank of Australia hike expectations. It gave back the most on the day, partly because commodity-currency positioning was hit by the copper liquidation that sent Freeport-McMoRan down 7.69% and Southern Copper down 6.49% after reports that Washington has not decided on refined-copper tariffs.
Sterling at 1.35506 was roughly unchanged before the data and lost 0.29% after it, with the Bank of England meeting next week alongside the Fed.
The Canadian dollar's relative resilience is straightforward: WTI at $99.35, up 3.44%, with Brent at $105.37. Oil-linked currencies get a terms-of-trade offset that the euro does not.
For a forecast, the cross-currency picture argues the euro's underperformance is dollar-driven rather than euro-driven. That distinction determines whether 1.1566 holds.
Oil at $102 and European Gas at Three-and-a-Half-Year Highs
The energy shock is the shared driver of both legs of this pair, and it is not symmetric.
West Texas Intermediate touched $100.10 a barrel Thursday, up 4.2%, and traded $99.35 mid-session for a 3.44% gain. Brent jumped 3.6% to $105.37, having pushed above $102 during the ECB press conference. Both benchmarks sit at their highest since May, driven by strikes on tankers around the Strait of Hormuz, damage to American military aircraft at Muwaffaq Salti Air Base in Jordan, and reports that Iran and Oman are close to an agreement on managing transit through the waterway — an arrangement that would increase Tehran's leverage over it.
European natural gas prices climbed to fresh three-and-a-half-year highs, the strongest levels since late 2022.
That last figure is the euro's structural problem. The eurozone is a net energy importer with no domestic hydrocarbon offset. Rising crude and rising gas prices simultaneously degrade the region's terms of trade, widen the current account drag, and transmit into consumer prices faster than they do in the United States, which is a net exporter of both.
The United States has also just secured unprecedented access to a portion of Venezuela's reserves, which changes the medium-term supply picture asymmetrically in the dollar's favour.
The ECB's response acknowledges the bind. Raising rates to 2.50% does not produce a molecule of gas or a barrel of crude. It compresses domestic demand until imported inflation is absorbed by a weaker consumer, which is why the projections show upside inflation risk alongside downside growth risk.
The Fed faces the same shock with a cushion the ECB lacks. That is the argument for a lower EUR/USD over a multi-month horizon regardless of what happens Friday, and it is why the pair has struggled to hold above 1.1700 despite an ECB that has now hiked twice.
Crude backing off $100 would relieve pressure on both currencies. It would relieve more on the euro.
Cross-Currents: A Yen at Seven-Month Highs and a Bank of England on Deck
Three other central bank stories are shaping the dollar side of this pair, and each carries a different sign.
USD/JPY stabilised above 153.50 Thursday, having stabilised above 153.50 in Asia and rebounded from a six-month low below 153.00 earlier in the week toward 154.00. The yen has been underpinned by hawkish Bank of Japan repricing, with the central bank warning about potentially faster rate increases ahead of its September 16 decision. Risks around that meeting are skewed toward a stronger yen.
A materially stronger yen is a dollar-negative event with a specific transmission channel: yen-funded carry trades unwind, capital repatriates to Japan, and dollar-denominated risk assets face forced selling. The 2024 carry unwind is the template. Any repeat would lift EUR/USD as a second-order effect even without any change in relative Fed-ECB pricing.
The Reserve Bank of Australia is expected to hike later this month, which had carried AUD/USD to its highest since May 14 above 0.7200 before Thursday's reversal.
The Bank of England meets next week alongside the Fed, with sterling at 1.35506. A hawkish BoE would compress the dollar's advantage across the G10 board and provide indirect support for the euro through the broad dollar index, where sterling carries meaningful weight.
The pattern across all four is the same. The energy shock has produced synchronised hawkishness — the ECB hiked Thursday, the RBA is expected to move this month, the BoJ is signalling faster tightening, and the Fed is priced at 64% for next week. When every major central bank tightens together, currency pairs stop trading policy direction and start trading policy magnitude and growth differentials.
That regime favours the dollar in the short run, because the U.S. can absorb tighter policy with a domestic energy base and 162,000 monthly job gains. It favours the euro over a longer horizon if the ECB is forced past 2.50% by inflation the consensus does not expect.
Volatility at 40 Pips Is the Coiled Spring Into Friday Morning
Five-day average volatility on EUR/USD stands at 40 pips, which the market classifies as low. For a pair that has just traded through a central bank decision, a press conference and a producer price release, that reading is remarkable in itself.
Compressed volatility ahead of a binary catalyst is the setup that produces outsized moves, not muted ones. The realised range has been narrowing while the event risk has been building, which means positioning is light and stops are clustered close to price on both sides.
The clusters are identifiable. Below current price, stops sit under 1.1590, then under the 1.1582 four-hour EMA, then under 1.1570 and the 1.1566 double-bottom low. Above, they sit above 1.1625, then above 1.1650, then above 1.1670 and the 1.1700 handle.
The distance from 1.1604 to the nearest downside cluster is 14 pips. The distance to the nearest upside cluster is 21 pips. A CPI surprise in either direction triggers a cascade through at least two levels before finding genuine liquidity.
That is why the projected Thursday range of 1.1590 to 1.1670 has held with room to spare while the projected Friday reaction is far wider. The 1.23% correction from 1.1712 to 1.1566 took eight sessions to complete. A hot core CPI could reproduce it in eight hours.
There is one technical caution against the bearish case. The commodity channel index entered oversold territory during the recent correction, warning that the pullback may have run its course, and the four-hour chart has maintained an uptrend that could represent the start of a new leg within a larger advance. The 20-day moving average is rising and price has held above it since September 4.
Low volatility, oversold short-term oscillators, a double bottom, and price sitting on a 200-day moving average is not a distribution pattern. It is a coil.
Read More
-
Yen Stalls at 160 Despite a 3% JGB and Tokyo Core CPI at 2.0% — Intervention Sits at 164, Friday's Payrolls Decide
02.09.2026 · TradingNEWS ArchiveEnergy
-
Apple Adds 1.2% to $319.14 as the Duo Opens a $2,000 Tier and Pro Prices Rise $100
10.09.2026 · TradingNEWS ArchiveStocks
-
XRP Token Defends $1.31 With Exchange Balances Down From 4B to Under 1.5B
10.09.2026 · TradingNEWS ArchiveCrypto
-
WTI Reclaims $100 With Supply Falling 4.3M Barrels a Day and Demand Down 1.6M
10.09.2026 · TradingNEWS ArchiveCommodities
-
S&P 500, Nasdaq and Dow Break Down a 4th Session as AVAV Rips 11% and Copper Miners Collapse
10.09.2026 · TradingNEWS ArchiveMarkets
-
GBP/USD Defends the 1.3524 Fibonacci Level With 2 Central Banks Meeting Next Week
10.09.2026 · TradingNEWS ArchiveForex
Friday's CPI: Three Scenarios and the Level Map for Each
The consumer price index at 8:30 a.m. ET Friday is the last major input before the September 15–16 decision, and it resolves this range.
Consensus: headline 0.4% monthly, 3.4% annually; core 2.4%.
Scenario one — soft core at or below 2.3% with headline in line. Hike odds collapse from 64% toward 35%, the 10-year backs away from 4.90%, the dollar index breaks 98.71, and EUR/USD clears the 1.1623 and 1.1625 cluster on the first attempt. Targets: 1.1650, then 1.1670, then 1.1712. A weekly close above 1.1712 opens 1.1800. This scenario gains credibility from the core PPI miss at 0.2% against a 0.3% forecast. Probability: roughly 30%.
Scenario two — core at 2.4% to 2.5% with headline at 0.4%. Nothing resolves. EUR/USD chops between 1.1582 and 1.1650 into the FOMC, with the meeting itself becoming the catalyst. The pair spends four sessions doing what it has done for three weeks. Probability: roughly 40%.
Scenario three — core above 2.6% or headline above 0.5%. Hike odds run toward 85%, the 10-year pushes through 5.00%, the dollar index clears 99.50, and EUR/USD breaks 1.1582 and 1.1570. First target 1.1566. A daily close below it invalidates the double bottom and opens 1.1500, then 1.1450. Probability: roughly 30%.
The energy component is what tilts the risk. Crude at $99.35 and Brent at $105.37 pass into headline CPI through gasoline and utilities with a short lag, and both are at four-month highs. Headline is more likely to run hot than cool. Core is the variable that can offset it, and August core PPI at 0.2% monthly is the only evidence pointing that way.
Weighting the three gives a mildly bearish skew for EUR/USD over the next 48 hours and a neutral-to-constructive one over the next month.
Verdict and Forecast: A Range Trade Until Friday Morning, Then a Directional One
EUR/USD at 1.1604, down 0.25%, is not a euro problem. It is a session in which the dollar rallied on one number and the euro absorbed less of that rally than sterling, the franc, the yen, the Aussie or the kiwi did.
The evidence for that reading is on the currency board. The dollar gained 0.71% against the Australian dollar and 0.51% against the yen while taking only 0.25% out of the euro. A currency that had just watched its central bank refuse to signal further tightening finished second-best among the majors. That is not what disappointment looks like.
What the ECB actually delivered was a hawkish package with a neutral wrapper: three rates up 25 basis points, the deposit facility at 2.50%, inflation projected at 3.0% for 2026 and 2.5% for 2027 with core rising to 2.6% next year before easing, upside inflation risks and downside growth risks named explicitly, and market pricing already carrying the deposit rate to 3.1% by late 2027. The 91% consensus that the cycle is finished is a forecast, not a commitment, and eurozone inflation at 3.3% with European gas at three-and-a-half-year highs argues against it.
The dollar's Thursday strength rests on a headline PPI figure of 5.4% that was driven by energy, while core PPI missed at 0.2% monthly against a 0.3% forecast. That is a thinner foundation than 64% hike odds suggest.
The forecast follows. Between now and Friday's 8:30 a.m. ET print, EUR/USD is a range trade: sell strength toward 1.1650 to 1.1670, buy weakness toward 1.1582 to 1.1570, and respect a 40-pip realised range. From Friday, it becomes directional. Above 1.1625 on a soft core CPI, the path runs 1.1650, 1.1670, 1.1712, and a weekly close above the August high opens 1.1800 into the FOMC. Below 1.1566 on a hot print, the double bottom fails and 1.1500 comes quickly, with 1.1450 behind it.
The structural bias remains modestly higher over a three-month horizon, because the ECB's own projections do not support a terminal rate of 2.50% and because a dollar propped up by fiscal-supply-driven yields at 4.90% is a dollar with a shelf life. The near-term bias is lower, because energy is manufacturing exactly the CPI print that gets the Fed to move next week.