Gold ($4,053) Rips 3% Off the $3,870 Yearly Low as Gridlock Sinks the Dollar — Close Above $4,080 Opens $4,200
Gold recovered $183.43 in three sessions as Democrats took the House and Senate and dollar weakness lifted the entire metals complex | That's TradingNEWS
Key Points
- Spot gold rose 2.95% to $4,053.68, recovering $183.43 from Friday’s $3,870.25 one-year low.
- Central banks bought 321 tonnes of gold in Q3 2026, the fastest quarterly pace since late 2024.
- Futures price a 78% chance of a December Fed hike, keeping $4,000 the key support for gold.
Gold printed its worst levels in more than a year five sessions ago. On Friday, October 30, spot fell 3.6% in a single day and set a weekly low of $3,870.25 an ounce late in the afternoon, closing at $3,876, the weakest finish since October 2025. The metal had broken below $4,000 for the first time since July, and October was on track for its worst performance since 2008. Tuesday brought another leg lower in futures, which settled at $3,931.90, down 0.95%, as strong job openings data lifted Treasury yields.
Wednesday flipped the script. Spot gold traded at $4,053.68 at 8:21 a.m. ET, up $116.29 or 2.95%. December futures pushed to $4,060, a gain of $119.60 or 3.04%. Another spot feed marked the metal at $4,046.31, up 2.92%. From Friday’s $3,870.25 low, gold has now recovered $183.43, or 4.7%, in three sessions.
The rally built in stages through the night. During Asian trading, spot gold was only 0.5% higher at $3,947.49 by 04:15 GMT, with December futures at $3,958, as the first Senate results came in for Democrats. Resistance at $3,971 to $3,982 capped the early session. Once networks called the House and the Senate math turned decisive, the dollar broke lower, yields fell and gold ripped through $4,000, posting an intraday high of $4,029 before extending into the $4,040s and $4,050s in the European morning. The total intraday swing ran past $100 from the session low.
Indian markets confirmed the bid ahead of Dhanteras, two days away. MCX gold futures jumped ₹2,843, or 2.04%, to ₹1,42,295 per 10 grams, and MCX silver soared ₹6,532, or 3.63%, to ₹1,86,230 per kilogram.
Context keeps the move in proportion. Gold set its all-time high of $5,589.38 on January 28, 2026, and at $4,053.68 it still sits 27.5% below that peak. The second half of 2026 has been a grind lower driven by a Fed that started hiking again in September, a 10-year Treasury yield that touched 5.34% in early October and an oil shock tied to the Iran war. Wednesday’s rally doesn’t erase any of that.
What it does is establish a level. Gold reclaimed $4,000 on the single most important political event of the year, and it did it with the dollar, yields and the volatility index all moving in its favor at once. The forecast below runs from one thesis: as long as $4,000 holds on a closing basis, the October washout to $3,870 marks the low of the correction, and the next target is $4,200.
Why the Democratic Sweep Lifted Gold: Gridlock, Shutdown Risk and a $40 Trillion Debt Load
Democrats took the Senate with wins in historically red states including Texas, South Carolina and Kansas, and flipped House seats from Florida to New Jersey to Kentucky. President Trump accepted the results, which removed the risk of a contested count. The outcome sets up divided government for the remaining two years of Trump’s final term, and the gold market priced three consequences within hours.
The first is fiscal friction. A Democratic Congress controls appropriations and the debt limit, and the new majority has already signaled it will challenge the administration on the debt ceiling. A December 11 government funding deadline now lands in front of a Congress controlled by the opposition party. The last two funding fights ended in a 43-day shutdown in autumn 2025 and a 76-day partial shutdown of the Department of Homeland Security in early 2026. Economists flagged a higher risk of another shutdown immediately after the results, and every shutdown scare in this cycle has pulled money toward gold.
The second is political volatility. The new majority has flagged investigations into administration allies and potential impeachment proceedings. Those headlines don’t move earnings for most companies, but they raise the uncertainty premium that safe-haven assets carry. A weaker dollar combined with demand for protection against a more confrontational Washington gave gold buyers a cleaner backdrop than they’ve had in two months.
The third is the debt itself. U.S. federal debt has passed $40 trillion, and neither party has offered a credible plan to stabilize it. Gold’s long-term bull case rests on the risk that policymakers eventually respond to mounting debt with easier money that erodes the dollar’s purchasing power. Gridlock doesn’t solve that problem; it delays the decisions, which keeps the debasement hedge relevant.
The election cut the other way on one front. Divided government limits the odds of new deficit-financed spending packages, which lowers the term premium bond investors demand. That pushed the 10-year Treasury yield down to 4.92% overnight from Tuesday’s 4.95% close. Lower long-end yields reduce the opportunity cost of holding a non-yielding asset, so even the fiscally conservative read on gridlock works in gold’s favor this week.
The equity market priced the same outcome as tolerable. S&P 500 futures traded 1.13% higher at 7,682.75 and Dow futures 2.11% higher at 52,991 by 8:30 a.m. ET, while the VIX collapsed 12.1% to 18.31. Gold rallying 3% alongside stocks rather than against them tells you the bid isn’t panic. It’s a repricing of the dollar and rates, and that kind of move tends to stick longer than a fear spike.
The Dollar at a One-Month Low: DXY Breaks Lower, EUR/USD 1.1231, USD/JPY Below 158
The dollar took the cleanest hit of any asset on the board. The U.S. Dollar Index, which had edged up 0.12% to 101.87 on Tuesday, fell 0.59% overnight to a one-month low in the 101.3 area. Traders priced two forces at once: lower long-end yields on gridlock, and tighter oversight of the AI data-center boom that has pulled foreign capital into U.S. equities all year. When that capital pipeline slows, so does demand for dollars.
The major pairs show the breadth of the move. EUR/USD climbed 0.4% to 1.1231. USD/JPY fell 0.4% to 158.12 and broke below 158.00, giving back Tuesday’s 0.46% rise to 158.66 near its 200-day average. The Mexican peso, which got smoked on Tuesday as USD/MXN jumped 1.50% to 18.84 on election caution, had the setup to recover as the dollar slid.
A weaker dollar makes gold cheaper for buyers holding euros, yen, rupees and yuan, which is where the bulk of physical and official-sector demand sits. That matters more in 2026 than in past cycles because the marginal buyer has shifted. Asian-listed funds accounted for almost half of the increase in global gold ETF holdings over the 12 months to September, compared with 30% from U.S.-listed funds and 20% from Europe. Central banks in China and Poland led disclosed official buying in the third quarter. Every point of dollar weakness lowers the local-currency cost for exactly the buyers who have been holding the market up.
The dollar’s direction from here depends on why yields move. If yields fall on gridlock and softer growth, the dollar weakens further and gold extends. If yields rise because Friday’s payrolls and next week’s CPI force the Fed to hike in December, the dollar firms and gold gets pushed back toward $4,000. September showed how fast that can happen: the Dollar Index rose 2% in that month alone as yields climbed and the Fed delivered its first hike since July 2023.
The level to watch on the dollar is the October low. A DXY break below 101 would confirm the election as a regime change for the currency and give gold the room to run toward $4,200. A recovery back above 101.87, Tuesday’s close, would signal that the rate market has reasserted control and that Wednesday’s dollar drop was a one-day event.
For now the alignment is unambiguous. Dollar down, yields down, gold up 3%. Bitcoin, the other debasement trade, gained only 1.14% to $78,180 on the same tape, which shows how much of the morning’s flow went specifically into bullion rather than into risk assets broadly.
Yields and Real Rates: The 10-Year at 4.92% and the Opportunity Cost Gold Has Fought All Year
Gold’s 2026 correction has been, at its core, a rates story. The 10-year Treasury yield pushed above 5% in mid-September for the first time since 2023 and touched 5.34% in early October, its highest level in 24 years. The 10-year TIPS yield, the cleaner measure of the real return investors give up by holding gold, climbed to a multi-year high of 2.84%. At those levels, a metal that pays nothing faces an opportunity cost it hasn’t seen since before the 2008 crisis.
The bond market closed Tuesday on a hawkish note. The 10-year rose 4 basis points to 4.95% after September job openings jumped 333,000 to 7.523 million against a 7.15 million forecast. The 30-year rose 4 basis points to 5.32% and the 2-year added 2 basis points to 4.61%, leaving the 2s10s spread at 34 basis points. Factory orders rose 1.8% against 1.3% expected. That combination of firm labor demand and firm industrial data is exactly the mix that has kept gold under pressure.
Wednesday’s dip to 4.92% on the 10-year is small in basis-point terms but significant in direction. Gridlock lowers the odds of new fiscal stimulus, which trims the term premium on long bonds. Nominal and real Treasury yields both declined overnight, and that two-sided drop is what gave gold the room to clear $4,000. On Friday’s selloff, by contrast, gold fell 3.6% even as the 10-year eased toward 4.93%, because forced liquidation across markets overwhelmed the rate signal.
The disconnect on Friday is the key warning in the data. Falling nominal yields don’t always translate into falling real yields, and real yields matter more for gold. On October 30, a tech-led equity slide, with the Nasdaq-100 down more than $1.2 trillion in October, triggered margin calls and forced selling of the most liquid holdings, including gold. Money rotated into Treasuries rather than bullion. That episode showed gold doesn’t automatically benefit from falling yields when the cause is a liquidity scramble.
Wednesday’s setup is different. Yields are falling while stocks are rising and the VIX is collapsing, which points to a real repricing rather than a dash for cash. If the 10-year holds below 4.95% through Friday’s payrolls, the real-rate headwind eases and gold has a path toward $4,100. A move back above 5% would put $4,000 back in play.
Seasonality offers modest support. In midterm years, the 10-year has historically risen in the first half and eased in the second, falling an average of 40 basis points over the back half of the year. This cycle has run late, with yields peaking in October rather than mid-year, but the pattern argues the rate peak is closer than the rate floor.
The Fed Problem: 78% Odds of a December Hike, PCE at 3.6% and Warsh’s Tightening Bias
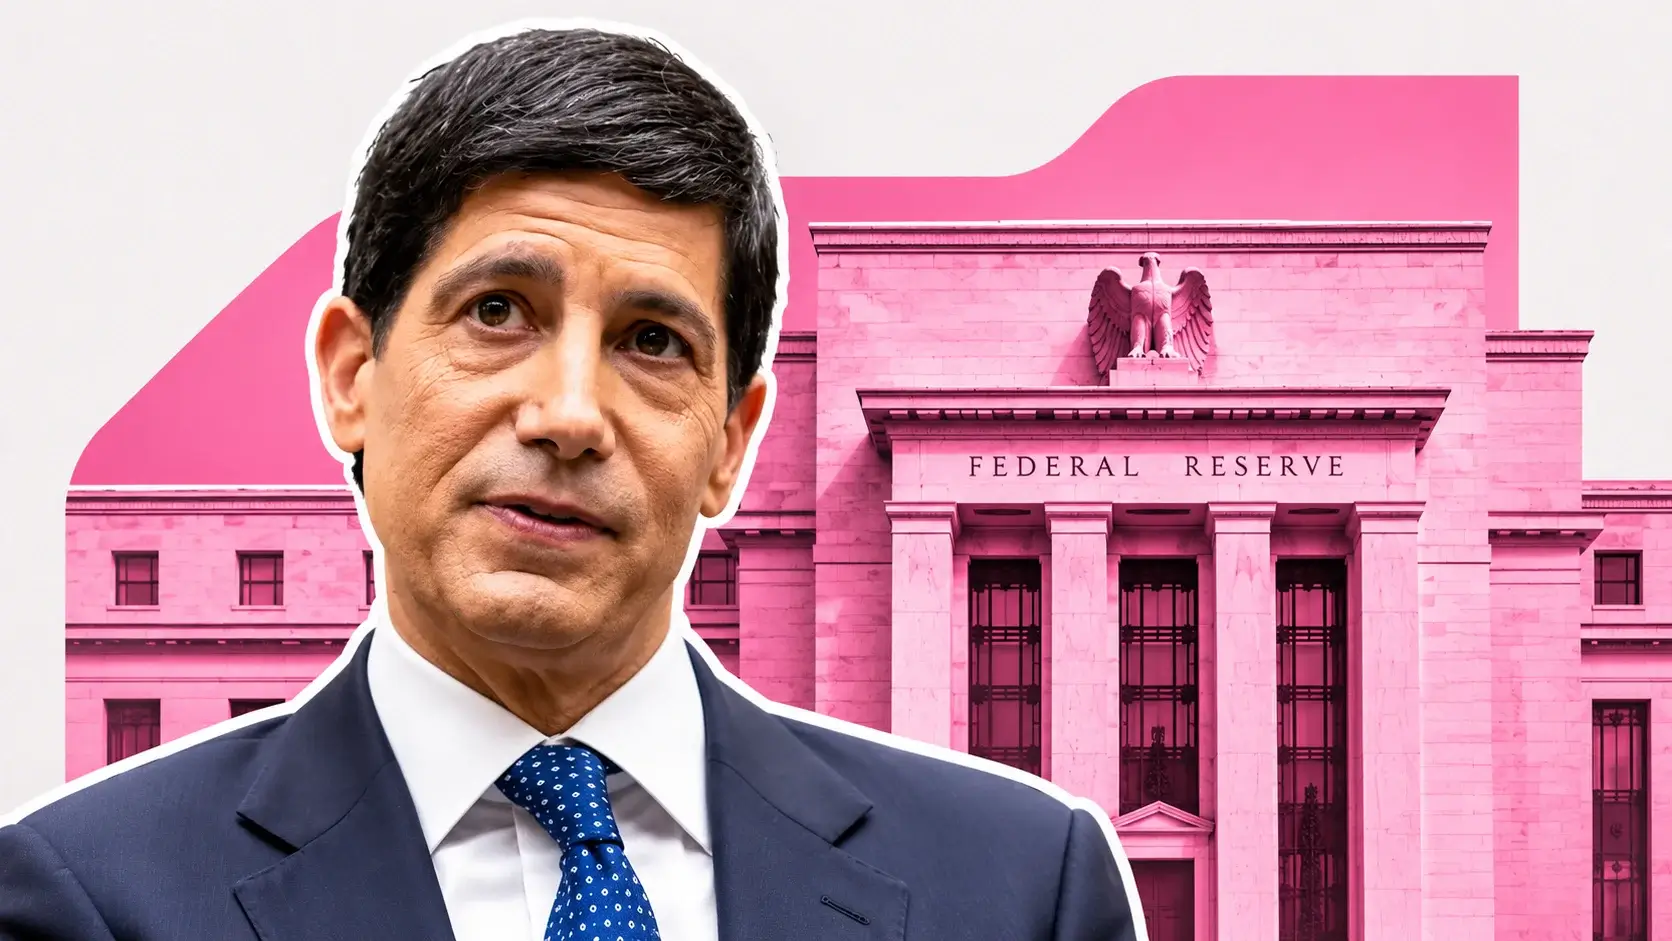
The single biggest weight on gold remains the Federal Reserve. The Fed raised rates to a 3.75% to 4.00% range in September, its first increase since July 2023, and the minutes of that September 15 to 16 meeting showed most officials saw another hike as likely appropriate by year-end. Policymakers under Chair Kevin Warsh held rates steady at the October 27 to 28 meeting but made clear the tightening cycle isn’t over, citing inflation risk from surging energy costs. Futures now price a 78% chance of a 25 basis-point hike at the December 8 to 9 meeting.
The inflation data justifies the hawkish lean. September PCE, the Fed’s preferred gauge, rose 0.5% month-over-month and 3.6% year-over-year. Third-quarter GDP growth came in above the 3.2% consensus. Three Fed officials argued for further increases in the days before the election. That combination of hot inflation and strong growth is the worst possible mix for a non-yielding asset, and it explains why gold fell 30% from its January peak even with geopolitical risk at multi-decade highs.
The labor data keeps adding to the case. Wednesday’s ADP report showed private payrolls up 86,000 in October, beating the 69,000 forecast, with pay growth for job-changers at its fastest pace since March 2024. Friday’s official report is expected to show nonfarm payrolls up 65,000 after September’s 29,000, with unemployment holding at 4.2%. A print well above consensus would lock in the December hike.
Some forecasters expect the tightening to extend into 2027, with hikes in December and again early next year pushing the 10-year to a peak of 5.25% to 5.50%. Under that path, gold finds its durable bottom only when rates peak, and the October low at $3,870 would be retested before the cycle turns.
The Fed’s own reaction function offers gold a way out. Fed officials have tied their hike bias to energy-driven inflation, and crude has been sliding: WTI traded at $94.62 on Wednesday, down 1.53%, after settling Tuesday at $96.09 near a two-week low. Cheaper energy cools inflation expectations, which softens the case for more hikes. On Monday, oil fell more than 3% on reports of Iran talks, yet gold reacted more to Fed speakers than to crude. That ordering has to flip for gold to break out.
The calendar decides it. Friday’s payrolls, the November 10 CPI and the December 8 to 9 meeting form a five-week window in which the Fed narrative either hardens or cracks. Gold above $4,000 heading into that window is a stronger position than gold at $3,870, and every soft data print from here gets amplified by the dollar’s new weakness.
Oil and Gold: The Inverse Correlation That Ran the October Selloff
The defining feature of gold’s 2026 correction is a relationship most investors didn’t expect. In past cycles, conflict in the Middle East supported gold as a safe haven. This time the main channel runs through inflation: higher energy prices raise expected inflation, higher expected inflation raises expected Fed rates, and higher expected rates push gold down. The inverse correlation between oil and gold last seen four years ago has returned, and October showed it at full strength.
Brent crude hit its highest level since April in the final days of October on the prospect of renewed U.S.-Iran fighting, and gold sank to its one-year low in the same sessions. Earlier in the month, Brent spiked to $111.99, a five-month high, before settling at $108.79. Fears over Middle East supply kept real yields elevated, raising the cost of holding a non-yielding asset at precisely the moment geopolitics should have helped bullion.
The trend has since reversed. Brent settled Tuesday at $103.60, down 1.12%, and traded near $104 on Wednesday. WTI December traded at $94.62, down $1.47 or 1.53%. The diplomatic track is active but unresolved: the U.S. carried out what it described as defensive strikes on Iran’s Qeshm Island after Iran fired on U.S. aircraft, Qatar stepped up mediation, and a regional report said Washington approved a Qatar-presented draft memorandum of understanding, even as a senior Iranian official said the sides remain far from a deal. The Strait of Hormuz remains the swing variable.
For gold, falling oil is now the bullish scenario. Every $5 drop in crude chips away at the inflation impulse that keeps the Fed hawkish, and that path lowers real yields. A durable U.S.-Iran agreement that reopens Hormuz traffic would push Brent toward the $90s and likely shave December hike odds below 50%, which would give gold its strongest tailwind since the summer.
The reverse risk is clear. A breakdown in talks that sends Brent back toward $110 would revive the October pattern and drag gold back to the $3,900s, regardless of what the dollar does. Geopolitical escalation has hurt gold this year, not helped it, because the market reads every oil spike as another Fed hike.
That correlation sets the trading rule for the next month. Watch Brent alongside gold. If crude holds below $105 and drifts lower on mediation headlines, gold’s rally above $4,000 has room to extend. If crude rips back above $108, treat gold’s rally as vulnerable even with the dollar weak. The midterms changed the dollar; they didn’t change the oil-to-Fed transmission that has driven gold since the Iran war began.
Central Banks: 321 Tonnes in the Third Quarter, 675 Tonnes Year-to-Date and China’s 63-Tonne Bid
The official sector is the floor under gold, and Tuesday’s quarterly demand report showed it getting stronger as prices fell. Central banks bought 321 tonnes of gold in the third quarter of 2026, the fastest pace since late 2024. Year-to-date purchases reached 675 tonnes, slightly ahead of the same period last year. The industry body behind the data raised its 2026 outlook for central bank buying and now expects purchases to at least match 2025’s 863 tonnes after the surprise strength in the third quarter.
Two buyers dominated disclosed purchases. The People’s Bank of China added 63 tonnes in the quarter and the National Bank of Poland added 40 to 41 tonnes, for a combined 104 tonnes. China’s September purchase of 23 tonnes was its largest monthly addition since October 2023, after an August purchase of 20.2 tonnes that lifted official holdings to 2,387 tonnes and extended a buying streak to 22 consecutive months. China took explicit advantage of the price drop to accelerate.
The second quarter told the same story. Central banks bought a record 289 tonnes from April to June, up from a revised 57 tonnes in the first quarter, even as Western gold ETFs sold 45 tonnes. Gold averaged $4,506 an ounce in that quarter, 8% below the first-quarter record average but still 37% above a year earlier. Official buyers didn’t wait for a bottom; they bought into the decline.
The structural shift is large. Gold now accounts for 27% of global central bank reserve holdings, compared with 22% for U.S. Treasuries. A survey of reserve managers published in June found 89% expect global central bank gold holdings to rise over the next 12 months, and a record 45% of the 76 institutions surveyed plan to add to their own reserves. That intent survived a 30% price decline, which tells you it isn’t momentum-driven.
There’s one notable seller. Kazakhstan’s central bank plans to lower gold’s share of its international reserves from 78% to 75% by year-end after holdings climbed to 386 tonnes. That’s a portfolio rebalancing by a bank that became heavily overweight, not evidence of a broader reversal in official demand.
The implication for price is asymmetric. Central bank buying doesn’t drive daily moves, but it absorbs supply when speculative and ETF money leaves. That’s why gold’s October washout stopped at $3,870 instead of extending to the $3,500s. With official buyers running at a 321-tonne quarterly pace, every dip toward $3,900 meets sovereign demand. That gives the $3,870 low real credibility as a floor and turns the downside case into a slow grind rather than a collapse.
ETFs: Record 4,256 Tonnes, $31 Billion in Q3 Inflows and the Price Divergence That Followed
The ETF picture flipped from the biggest drag to a pillar of support in a single quarter. Global physically backed gold ETFs took in 211 tonnes in the third quarter of 2026, lifting total holdings to a record 4,256 tonnes. The dollar value of those inflows hit a record $31 billion. August alone brought $18 billion, the second-largest monthly inflow on record, as gold posted a 13% gain that month, its strongest since January.
That recovery followed a brutal first half. ETFs shed 200 tonnes in the first quarter of 2026 as the rate-cut thesis that carried gold to its January record reversed, and Western funds sold another 45 tonnes in the second quarter. Those outflows tracked the price correction from the January high. When gold rebounded through August, the money came back.
The divergence started in late September. Holdings have stayed above 101 million ounces even as gold struggled at $4,100 to $4,200 and then broke below $4,000. For much of 2026, ETF holdings moved with the price; since late September, they’ve held steady while the price fell. Investors who bought in the third quarter haven’t capitulated, which means the October selloff was driven by futures positioning and forced liquidation rather than by long-term holders exiting.
Chinese funds have been the most aggressive buyers. Chinese gold ETFs took in $3.9 billion in the third quarter, raising assets under management by 13% and adding 27 tonnes, and holdings reached a month-end record of 304 tonnes. Local investors kept diversifying into gold amid sustained equity weakness, and that demand carried into early October.
The overhang is real, though. A large block of ETF gold bought during the August and September rally sits underwater at current prices, and holders who bought above $4,100 have an incentive to sell into rallies toward breakeven. That creates supply in the $4,100 to $4,200 band, the same zone where gold traded in mid-October, when it settled at $4,112 on October 14.
The industry body cut its 2026 investment demand growth forecast to 200 tonnes from 400 tonnes, reflecting slower physical bar and coin buying, even as ETF demand surprised to the upside. Total gold demand slipped 1% to 1,369 tonnes in the third quarter as higher rates and bond yields pressured prices below $4,000.
The ETF signal for Wednesday is simple. Record holdings that didn’t break during a 30% drawdown are a sign of conviction. If Wednesday’s dollar breakdown pulls fresh inflows into the complex, the $4,100 overhang gets absorbed faster than the market expects.
Read More
-
Yen Stalls at 160 Despite a 3% JGB and Tokyo Core CPI at 2.0% — Intervention Sits at 164, Friday's Payrolls Decide
02.09.2026 · TradingNEWS ArchiveEnergy
-
SMCI Trades at 4.2 Times Run-Rate Earnings After a 298% Revenue Surge — Close Above $32.66 Opens $38
04.11.2026 · TradingNEWS ArchiveStocks
-
XRP-USD ($1.32) Breaks Its Range as Binance Whale Flow Dominance Hits 98.4% — Close Above $1.34 Opens $1.50
04.11.2026 · TradingNEWS ArchiveCrypto
-
Brent ($100.71) Gives Back 13% in 8 Sessions as the Iran War Premium Unwinds — Physical Draws Hold the Floor Near $95
04.11.2026 · TradingNEWS ArchiveCommodities
-
S&P 500 Eyes 7,650, Dow Leads and Nasdaq Trails as AMD’s 7% Pop Fades on Data-Center Fears
04.11.2026 · TradingNEWS ArchiveMarkets
-
GBPUSD Breaks 1.35 as a BoE Hike to 4.00% Would Lift UK Rates Above the Fed’s 3.875% Midpoint — Path to 1.3600 Opens
04.11.2026 · TradingNEWS ArchiveForex
Physical Demand: The Weakest Jewellery Quarter Since 2000, Dhanteras Buying and China’s Split Market
Physical demand is the weakest link in gold’s support structure. Third-quarter jewellery demand was the weakest since 2000, a direct consequence of prices that remain more than double their early-2024 levels even after the correction. Bar and coin buying slowed as well, which is why the quarterly demand report trimmed its investment forecast. Over-the-counter and other demand rose to 143 tonnes from 101 tonnes a year earlier, but that category reflects institutional flows rather than consumer buying.
Asia’s physical markets were subdued through late October. Indian buyers delayed purchases in anticipation of further price declines, and demand in China, the world’s top consumer, stayed muted. Discounts in both markets widened as dealers struggled to move metal at prices that remain historically elevated.
The calendar is about to test that weakness. Dhanteras, the most auspicious gold-buying day in India’s festival season, falls two days from now. Jewellers at major chains raised 22-carat prices for a third consecutive day on Wednesday, with the 10-gram rate at ₹1,28,250 to ₹1,28,750 and the 24-carat rate at ₹1,40,450 per 10 grams. Domestic spot prices traded at ₹1,39,790 per 10 grams early in the session before the international rally lifted MCX futures 2.04% to ₹1,42,295. The festival historically pulls forward a burst of buying that clears inventory, and Indian buyers who held off in October now face prices 4.7% above last week’s low.
China’s market is split. Institutional and official demand is strong: the central bank is buying at its fastest pace in two years, and local ETFs hit record holdings. Retail jewellery demand remains weak. During the Mid-Autumn Festival and the seven-day National Day holiday in early October, price pullbacks did encourage dip buying of jewellery, bars and coins, which shows Chinese consumers respond to lower prices even if they don’t chase rallies.
The physical market sets a soft floor rather than a hard one. Retail buyers in India and China step in on dips, which helped stabilize gold in the high $3,800s, but they don’t push prices higher on their own. A sustained move toward $4,200 needs institutional and ETF money, not jewellery demand.
That limits the upside but strengthens the floor. Every move back toward $3,900 meets both central bank orders and price-sensitive Asian retail buyers, and the combination makes a break below $3,870 more difficult than October’s speed suggested.
Silver, Platinum and Palladium: Silver Rips 4.6% to $52.49 as the Gold-Silver Ratio Eases to 77
The rest of the precious metals complex outran gold on Wednesday. Silver spot traded at $52.49 an ounce at 8:21 a.m. ET, up $2.30 or 4.6%, reclaiming $50 after breaking below that level last Friday for the first time since November 2025. Silver futures had dropped 1.99% to $49.71 on Tuesday, so Wednesday’s move is a sharp reversal off the bottom of the range.
Silver carries a higher beta to gold in both directions, and the 2026 correction shows it. The metal set an all-time high of $121.62 on January 29, one day after gold’s record, and at $52.49 it sits 56.8% below that peak, against gold’s 27.5% drawdown. The gold-silver ratio stands at 77.2 at current prices, meaning one ounce of gold buys 77.2 ounces of silver. A falling ratio on a risk-on, weak-dollar day is a constructive signal for the whole complex, because it shows speculative money returning to the higher-beta metal.
Platinum and palladium joined the rally. Platinum spot rose $44.95, or 3.15%, to $1,470.90, and palladium jumped $56.93, or 5.95%, to $1,013.98. Platinum set a record near $2,920 on January 26, 2026, breaking its 2008 peak, and now trades roughly half that level. Palladium never set a new record in this cycle, peaking near $2,200 in January.
Industrial metals sent a mixed signal on Tuesday. Copper fell 2.52% to $6.38 a pound as miners led European stocks lower, and materials were among the worst-performing S&P 500 sectors with a 2.01% loss. Silver’s industrial exposure, which accounts for more than half of its demand through solar panels, electronics and electrification, ties it partly to that cycle. The Democratic sweep added a tailwind on that front: solar stocks jumped 8% premarket on expectations that a Democratic Congress will shield clean-energy tax credits, and solar is one of silver’s fastest-growing end markets.
The cross-metal message is that Wednesday’s rally isn’t gold-specific. The entire precious metals complex is repricing the dollar and rates at once. That breadth matters. October’s selloff hit every metal simultaneously as forced liquidation spread, and Wednesday’s recovery is equally broad.
For gold traders, silver works as the leading indicator. If silver holds above $50 and the ratio keeps compressing below 77, the speculative bid behind gold’s rally has staying power. A silver reversal back below $50 would warn that the move is fading.
The Technical Map: $4,000 Support, $4,060 Channel Resistance and the $4,074 20-Day Average
Gold’s chart sets up a clean decision zone directly overhead. The first barrier sits at $4,060, the top of the descending channel that has guided prices lower since the mid-October breakdown. December futures touched exactly $4,060 on Wednesday morning. Above it, the 20-day simple moving average comes in at $4,074, and resistance at $4,080 caps the next leg. A close above $4,080 would break the channel and open the path to $4,100 to $4,112, where gold settled on October 14.
The support structure is equally defined. The $4,000 psychological level is the first and most important line: gold left behind two consecutive daily declines to reclaim it on Wednesday. Below $4,000, support sits at $3,970, then the $3,971 to $3,982 band that capped the Asian session and now flips to support. The lower Bollinger Band sits at $3,894, the key $3,885 to $3,904 base comes next, and the $3,886 level was flagged as a must-hold line during last week’s slide. The yearly low at $3,870.25 is the floor.
Momentum is repairing. The relative strength index is recovering toward the neutral 50 level after gold traded below the lower Bollinger Band last week, two standard deviations under the 20-day average, a reading that historically marks short-term exhaustion. The one-hour RSI held a steady 48 to 52 range during the overnight consolidation before the breakout.
The pattern from here comes down to whether Wednesday’s move is a breakout or a bull trap. A rally that stalls at $4,060 to $4,074 and closes back below $4,000 would mark a failed recovery and send gold back to retest $3,870. A daily close above $4,080 would confirm a short-term trend change and target $4,112, then $4,200.
The risk-reward favors the upside. From $4,053.68, the distance to $4,200 is $146.32, a 3.6% move. The distance to $3,870.25 is $183.43, a 4.5% drop. That’s close to symmetric on paper, but the support side is reinforced by record central bank buying and record ETF holdings, while the resistance side sits in an ETF overhang that could absorb inflows quickly if the dollar keeps falling.
Volatility is elevated. Gold’s daily ranges ran past $100 on Friday and again on Wednesday, so stops placed inside $40 of the current price will get hit on noise. The levels that matter are $4,000 on a closing basis for bulls and $4,080 on a closing basis for confirmation.
Miners and Gold ETFs: GLD, IAU, Newmont’s $1,680 Cost Line and GDX’s Leverage to the Rebound
Gold miners amplify every move in the metal, and the 2026 correction punished them harder than bullion. The VanEck Gold Miners ETF (GDX) peaked with a February monthly close of $115.84 and fell to $76.73 by the end of July, a 34% decline on a monthly-close basis, while gold dropped less over the same stretch. That leverage cuts both ways. A 3% day for gold usually translates into a 5% to 8% day for the miners.
The margin math still favors producers by a wide margin. Newmont, the world’s largest gold miner, guided 2026 all-in sustaining costs of $1,680 an ounce on a by-product basis and total costs applicable to sales of $1,055 an ounce, on expected production of 5.26 million to 5.3 million ounces. At $4,053.68 spot, Newmont’s AISC margin is $2,374 an ounce, or 59% of the gold price. Even at last week’s $3,870 low, the margin stood at $2,190. That kind of cash generation explains why Newmont returned $1.9 billion to shareholders through dividends and buybacks in the second quarter, when sales rose 15.1% year over year to $6.1 billion.
Barrick runs on a similar structure. The Toronto-based miner sold 3.3 million attributable ounces of gold and 220,000 metric tons of copper in 2025, with two decades of reserves, and it plans an IPO of its joint-venture stakes in Nevada Gold Mines and Pueblo Viejo along with its Fourmile deposit. Its copper exposure gives it a partial hedge against gold’s correction.
The physical gold ETFs give direct exposure without operating risk. The SPDR Gold Shares (GLD) and iShares Gold Trust (IAU), the two largest U.S.-listed physically backed funds, track the spot price after fees and form a large part of the 4,256 tonnes of record global ETF holdings. Their daily flows are the clearest real-time read on whether Western investors are buying the rebound, and that’s the data point to watch after Wednesday’s close.
The miners also carry a policy tailwind from the election. A Democratic Congress is unlikely to change mining tax regimes in a way that hits producers, and a weaker dollar lowers costs for miners operating abroad when expressed in dollars. The bigger risk for the miners remains the Fed: if gold retests $3,870 on a hawkish payrolls print, miners would drop faster than bullion.
For positioning, the miners offer the high-beta expression of the recovery and the ETFs the lower-volatility one. With gold just back above $4,000 and the Fed still leaning hawkish, the cleaner trade is the metal itself, with the miners as the follow-on once a close above $4,080 confirms the trend.
The Catalyst Calendar: ISM Today, Payrolls Friday, CPI November 10 and the December 8 to 9 Fed Meeting
Gold has five weeks of high-impact data ahead, and every release maps directly onto the Fed’s December decision. Wednesday’s schedule includes the S&P Global services PMI at 9:45 a.m. ET and the ISM services index at 10:00 a.m. ET, with a 54.7 consensus against a 54.9 prior. A hot ISM reading would push yields back up and test gold’s hold on $4,000 within hours of the breakout.
Friday’s October jobs report is the biggest single catalyst of the week. Consensus calls for nonfarm payrolls of 65,000 after September’s 29,000, private payrolls of 64,000 and unemployment steady at 4.2%. Strong hiring would reinforce expectations of further tightening, while weaker data would push investors to reconsider the Fed’s trajectory. Gold’s reaction function is clear: a print above 100,000 likely sends the metal back to $3,970 to $3,980, while a print below 30,000 could fuel a run through $4,080.
October CPI lands on November 10. The September PCE reading of 3.6% year-over-year set a high bar, and with crude down from its October peak, the energy component should ease. A softer CPI would be the first data point in months to argue against the December hike, and gold would react more strongly to it than to any single geopolitical headline.
The Fed meets December 8 to 9 with 78% odds of a 25 basis-point hike priced in. Gold has absorbed much of that expectation already, falling 30% from its January peak as hike odds climbed from near zero to above 70%. If the Fed hikes and signals a pause, gold could rally on a sell-the-rumor, buy-the-fact pattern. If the Fed hikes and signals more, the $3,870 low comes back into play.
Two days later, the December 11 government funding deadline hits a Congress about to change hands. The outgoing Republican majority controls the lame-duck session, but the incoming Democratic majority has every incentive to resist a long-term deal that locks in the administration’s spending priorities. A shutdown scare in the second week of December would land on top of the Fed decision, adding a fiscal safe-haven bid at the same moment the rate outlook clarifies.
The Iran mediation track runs in parallel. A signed U.S.-Iran memorandum that reopens Hormuz traffic would push oil lower and cut inflation expectations, which would help gold more through the rate channel than any safe-haven flow. A collapse of talks would do the opposite.
Gold Price Forecast: Bullish Above $4,000, $4,200 Target, $3,870 the Line That Must Hold
Gold took the Democratic sweep and turned it into the cleanest macro setup it has had since August. The dollar fell 0.59% to a one-month low, the 10-year Treasury yield dipped to 4.92%, the VIX collapsed 12.1% to 18.31, and spot gold ripped $116.29, or 2.95%, to $4,053.68, reclaiming $4,000 three sessions after a one-year low at $3,870.25. Silver led the complex with a 4.6% jump to $52.49, and platinum and palladium joined the rally, confirming the move is a broad repricing of the dollar and rates rather than a one-asset spike.
The fundamental floor is stronger than the price action of October suggested. Central banks bought 321 tonnes in the third quarter and 675 tonnes year-to-date, with China adding 63 tonnes and Poland 40 tonnes. Global ETF holdings hit a record 4,256 tonnes on $31 billion of third-quarter inflows, and those holdings didn’t break during the drop below $4,000. Gold now makes up 27% of global central bank reserves, ahead of Treasuries at 22%. Sovereign buyers have been absorbing every dip.
The ceiling is the Fed. A 78% chance of a December hike, 3.6% PCE inflation and a labor market adding 86,000 private jobs in October keep the real-rate headwind in place. Oil is the swing variable: Brent near $104 and WTI at $94.62 are falling, and every leg lower in crude weakens the case for further hikes.
The forecast sets clear levels. The near-term bias is bullish above $4,000 on a closing basis. The first resistance band runs from $4,060 to $4,080, where the descending channel top and the 20-day average at $4,074 converge. A daily close above $4,080 confirms the trend change and targets $4,112, then $4,200, a 3.6% gain from $4,053.68. Support sits at $4,000, $3,970, $3,894 and $3,886, with the $3,870.25 yearly low as the line that must hold for the recovery thesis to stand. A close below $3,870 would reopen the correction toward the $3,700s as forced selling resumes.
The verdict: bullish with conditions. The Democratic sweep weakened the dollar, lowered long-end yields and added shutdown and political risk premiums, all of which favor gold, while record central bank and ETF demand anchors the downside. Hold $4,000 through Friday’s payrolls and the November 10 CPI, and XAU/USD has a clear path to $4,200 before the December 8 to 9 Fed meeting, with a break above that level putting the October 14 breakdown zone and the $4,300s back in play into year-end.