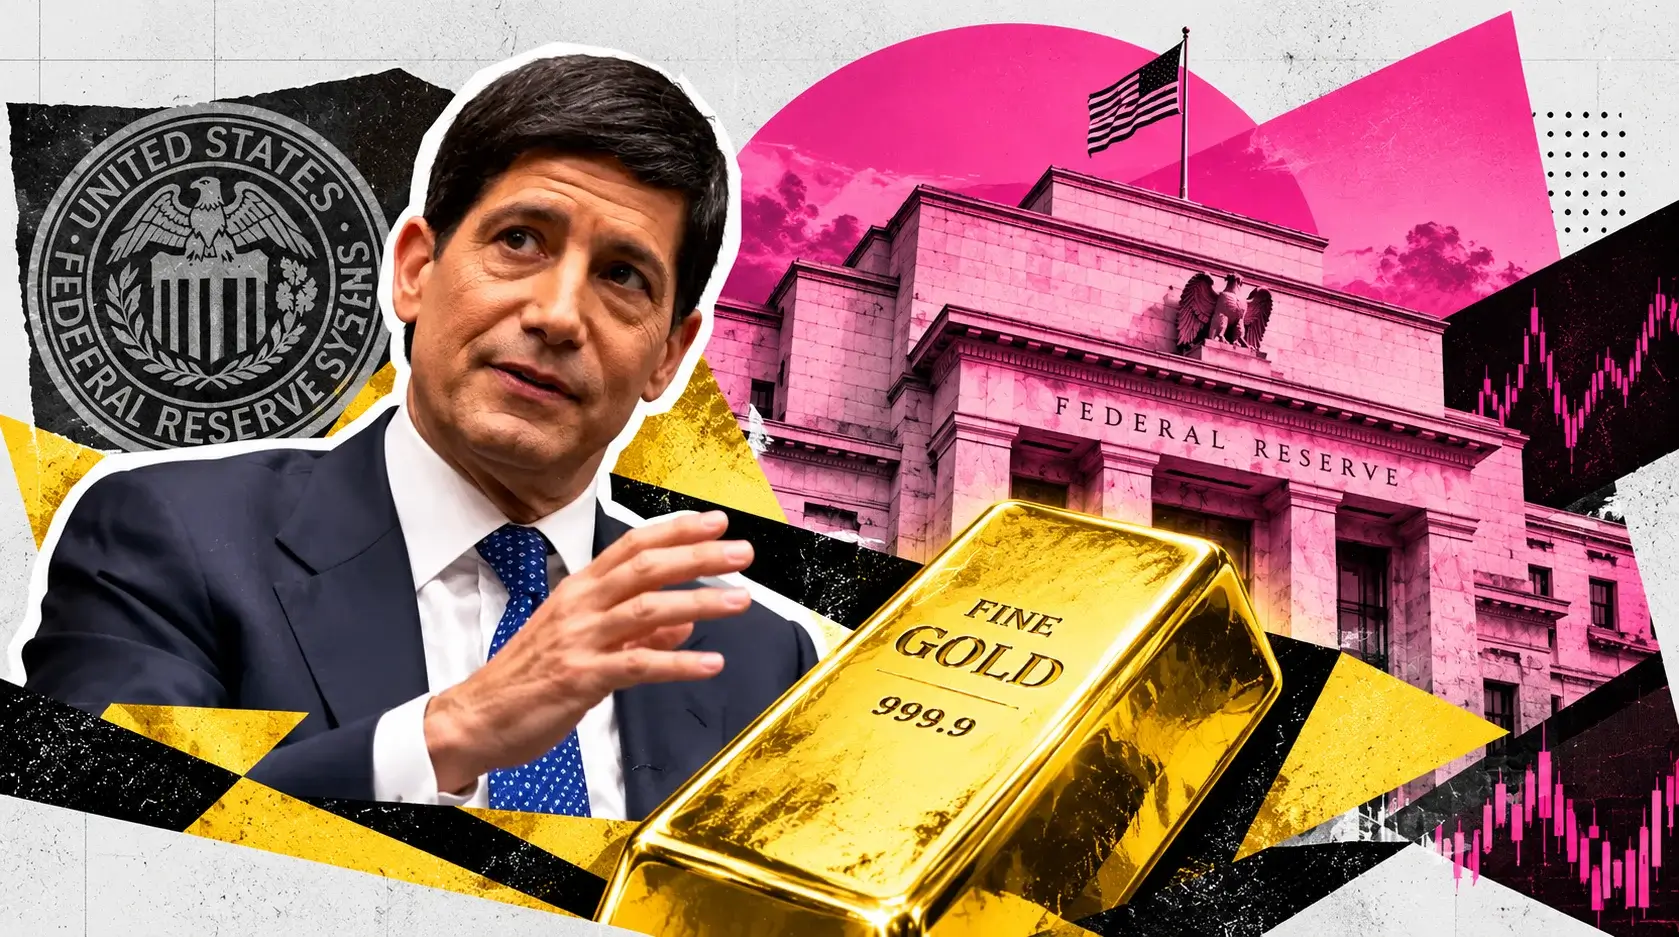
Gold ($4,055) Defends $4K as Oil Stokes Rate Fears Ahead of the Fed — Breakout Above $4,125 Opens $4,220
Gold slipped to $4,030.20 after Brent rose 1.3% on a Ras Tanura strike claim, reversing Tuesday’s 1.15% bounce | That's TradingNEWS
Key Points
- Spot gold trades at $4,055, 27.5% below its $5,589.38 record set on January 28, 2026.
- Futures price an 84.4% chance of a December Fed hike with the 10-year Treasury yield at 5.01%.
- GLD holdings fell 1.64% to 1,041.65 tonnes, the largest weekly outflow since the week ending March 6.
Spot gold traded at $4,055 an ounce at 9:11 a.m. ET on Wednesday, up $31 or 0.77% from the same hour Tuesday, after a session that swung between $4,030.20 and $4,065. December gold futures (GC) stood at $4,064.90, down $9.70 or 0.24%, after opening at $4,073.60. The metal is holding above $4,000, but it has spent four straight sessions opening below $4,100, and the bounce off last Friday’s $3,975.23 low has already stalled once at the $4,065 to $4,070 shelf.
The most important fact about gold this week is that oil has stopped helping it. In a normal geopolitical shock, a refinery attack in Saudi Arabia and warnings of a renewed war with Iran would send bullion higher. This week the relationship runs the other way. Higher crude lifts inflation expectations, which lifts the odds of another Federal Reserve hike, which lifts Treasury yields and the dollar, which hits gold. On Monday and Tuesday, oil fell and gold climbed back from $3,975.23 to $4,065. On Wednesday, front-month Brent jumped 1.3% to $115.59 on a Houthi claim of a strike on the Ras Tanura refinery, and spot gold dropped as much as 0.7% to $4,030.20.
That makes the Fed decision at 2:00 p.m. ET, and Chair Kevin Warsh’s press conference at 2:30 p.m., the event that sets gold’s direction. A hold at 3.75% to 4.00% is priced at 92.8%. What is not settled is December: futures price an 84.4% probability of another hike at the final meeting of the year. Every point of that probability is a headwind for a metal that pays no yield while the 10-year Treasury pays 5.01%.
The longer picture explains why the market is so sensitive. Gold set its all-time high of $5,589.38 on January 28, 2026. At $4,055 it trades 27.5% below that peak, and it is down 2.29% from $4,150 a month ago. It remains up 3.10% from $3,933 a year ago, a small gain for an asset that nearly doubled between early 2024 and January 2026.
The forecast hinges on whether gold can hold the $4,000 handle through two tests in 24 hours: Warsh on Wednesday afternoon and the September PCE inflation report plus third-quarter GDP at 8:30 a.m. ET Thursday. A dovish tilt and a soft PCE print open $4,125, the 20-day moving average, and then $4,220, the 100-day. A hawkish Warsh and a hot PCE break $3,975.23 and send gold toward $3,940. The base case is a $4,000 to $4,075 range into Friday.
From Tuesday’s $4,065 Bounce to Wednesday’s $4,030 Dip
The 48 hours before the Fed tell the whole story of gold’s dependency on oil. On Tuesday, gold climbed 1.15% to $4,065 in the early Asian session as crude fell for a second straight day on renewed diplomatic efforts with Tehran. It was the strongest single-day move since the selloff began, and it pulled the metal away from the three-month low.
That move faded within hours. By 03:47 GMT Wednesday, spot gold was down 0.3% at $4,045.29 and December futures were down 0.4% at $4,059.00. By 04:57 GMT, spot had slipped to $4,037.98, down 0.6%, with futures at $4,051.32, also down 0.6%. The low of the session came later in the European morning at $4,030.20, a 0.7% decline, with December futures down 0.8% at $4,043.
US hours brought a partial recovery. December futures opened at $4,073.60, flat from Tuesday’s open and the highest opening level since Thursday. They slid to $4,060.70 by 6:57 a.m. ET, recovered to $4,070.30 at 8:20 a.m. ET, down $4.30 or 0.11%, and traded at $4,064.90 shortly before the US equity open. Spot gold printed $4,055 at 9:11 a.m. ET.
The pattern inside the session is consistent: buyers defend the $4,030 to $4,045 zone, sellers cap the $4,065 to $4,075 zone. The 100-hour exponential moving average at $4,044.21 sits in the middle of the lower band and has acted as intraday support all morning. Above, the $4,070 level, which acted as support during the $4,100 to $4,200 range that held through early October, has flipped into resistance and stopped the two-day recovery cold.
That leaves gold trading in a $45 band, roughly 1.1% wide, ahead of an event that has historically moved it far more. The compression reflects positioning. Traders who sold the October 22 to 23 breakdown are not adding shorts at $4,030 with the $4,000 floor this close, and buyers who caught the $3,975.23 low are taking profits at $4,065 rather than betting on a dovish Warsh.
The four straight opens below $4,100 matter for sentiment. The $4,100 to $4,200 range was gold’s base through most of October, and losing it on October 22 marked the first breakdown of that structure. Until gold opens and closes above $4,100, the market will treat every rally as a retest of broken support rather than a resumption of the uptrend.
Oil Has Turned From Gold’s Hedge Into Gold’s Headwind
The relationship between crude and gold this week is the clearest it has been all year. Lower oil means less inflation pressure, fewer rate hike bets and a better day for gold. Higher oil means the reverse. Monday and Tuesday showed the first half of that equation; Wednesday showed the second.
The trigger on Wednesday was a Houthi claim of a strike on Saudi Arabia’s Ras Tanura refinery. Front-month Brent rose 1.3% to $115.59 and December West Texas Intermediate traded at $102.11, up 2.21%, before the US open. A separate report said the US had warned Gulf states of a possible short, intense renewal of the war with Iran after the November 3 midterms. In earlier phases of this conflict, those headlines would have sent gold higher on safe-haven demand. This week they sent it lower.
The mechanism runs through the Fed. September consumer prices rose 3.7% from a year earlier, above forecast, and energy is the main driver of the overshoot. Every $5 rise in crude adds to headline inflation within a month or two, which raises the probability that the Fed hikes again in December. Futures already price an 84.4% chance of that hike. Higher hike odds push up Treasury yields and the dollar, and both are direct negatives for a non-yielding asset priced in dollars.
The October 22 breakdown followed the same script. When Brent jumped to a five-month high above $112 that day, gold fell below $4,100 for the first time in the cycle and hit a low of $4,066.56 in Asian trading. It then broke $4,050 and fell to a ten-week low of $4,034 before the end of the session, losing more than 2% even as Treasury yields eased. By Friday, October 23, gold had dropped below $4,000 for the first time since mid-July and touched $3,975.23, ending its steepest weekly decline since June.
Geopolitical demand has not disappeared. It is being outweighed. The same conflict that pushes oil higher also supports physical buying, particularly from Chinese households, and that buying has set a floor near $4,000. The problem for bulls is that the floor is a floor, not a lift. As long as oil trades above $100 WTI and $110 Brent, the inflation and rates channel will dominate the safe-haven channel. Gold needs crude to fall back below $110 Brent, or the Fed to signal it will look through energy-driven inflation, before it can rally on war headlines again.
92.8% Hold, 84.4% December Hike: The Odds Gold Has to Fight
The Federal Open Market Committee ends its two-day meeting at 2:00 p.m. ET. Futures price a 92.8% chance that the committee holds the target range at 3.75% to 4.00% and a 6.6% chance of a hike today. The rate decision itself is not the risk for gold. The risk is the December language.
The Fed raised rates by 25 basis points in September, its first increase in three years, after the summer’s inflation readings showed no meaningful improvement in underlying trends. On the day of that decision, the 10-year Treasury yield pushed back above 5%. Since then, September consumer and producer inflation both ran hot, and futures moved December hike odds as high as 90% before easing to 84.4% this week.
Warsh has deliberately moved away from forward guidance. That makes his press conference harder to forecast and more powerful when it lands. If he leaves the door open to December without committing, the market keeps its 84.4% pricing, the dollar holds its gains and gold stays pinned in the $4,000 to $4,075 band. If he leans on the weak labor data, including September payrolls of just 29,000 and a July revision to a loss of 10,000, and suggests the committee can wait on energy-driven inflation, December odds fall, yields ease and gold has room to retest $4,065 and then the 20-day line at $4,125.
The hawkish risk is real. Warsh’s Jackson Hole debut in August emphasized that the Fed may have more work to do on inflation, and his first meeting as chair in June dropped the easing bias entirely. A repeat of that tone, especially a statement that names oil as a source of persistent price pressure, would push December odds toward 90% and the 10-year above 5.05%. That combination has broken gold’s support twice this month.
Politics adds a layer. The decision lands six days before the midterm elections, which makes an outright hike today unlikely and raises the bar for overtly hawkish language. That asymmetry slightly favors gold: the committee is more likely to hold quietly than to escalate. Even so, the market will not reward gold for a neutral outcome. With December priced at 84.4%, neutral means the status quo, and the status quo has kept gold below $4,100 for four sessions. Gold needs a dovish surprise to break higher; it only needs confirmation of the current path to stay pinned.
A 5.01% 10-Year and a Two-Week Dollar High Cap the Upside
The two macro variables that set gold’s opportunity cost are both working against it. The 10-year Treasury yield rose more than 2 basis points to 5.0134% in early trading, and it has held near that level into the Fed. The 30-year yield sits at 5.30% and the 2-year at 4.733%. A holder of gold gives up a 5.01% risk-free return to own a metal that pays nothing. When that yield sat near 4.3% in April, the trade-off was easier to justify.
Long-term yields are doing part of the Fed’s work. The September hike pushed the 10-year back above 5%, and higher crude prices have helped keep it there despite softer labor data. A hold at 3.75% to 4.00% with a December hike priced at 84.4% means the curve still expects tighter policy, and gold is trading that expectation.
The dollar is firm. The US Dollar Index rose 0.1% to 102.42 early Wednesday and touched a two-week high before the decision. USD/JPY held above 157.50 for a third straight day of gains as traders bet the Bank of Japan will hold off on aggressive hikes at its meeting on Friday. A stronger dollar raises the cost of gold for buyers outside the US, which reduces demand from the largest physical markets in Asia and the Middle East.
The correlation is visible in the tape. Tuesday’s gold rally to $4,065 came alongside easing oil and a pause in the dollar. Wednesday’s decline to $4,030.20 came as the dollar index rose and Treasury yields moved back above 5%. The October 22 selloff came as the dollar strengthened and yields held near 5%, even though falling equities should have helped gold.
The safe-haven bid is also being redirected. During the October 22 equity selloff, which hit the Nasdaq 2.6%, investors fled to Treasuries rather than gold. That is unusual and important. When a 10-year yield of 5% offers both safety and income, gold loses its monopoly on the crisis trade. The AI equity unwind added pressure: investors sold gold to cover losses elsewhere, which is the opposite of the 2024 to 2025 pattern when gold rallied through equity drawdowns.
A dovish Warsh would hit both variables at once, pulling the 10-year below 5% and the dollar index back under 102. That is the scenario gold needs, and it is not the scenario the market prices.
The $3,975 Low Defines the Floor, $4,000 Defines the Mood
Friday’s low at $3,975.23 is the most important price on the chart. It marked gold’s first trade below $4,000 since mid-July, it ended the steepest weekly decline since June, and it has held through two sessions of rebound. As long as gold stays above it, the October selloff remains a correction inside a bull market that is still up 3.10% year over year. A daily close below it would confirm a breakdown with the June low as the next target.
The $4,000 level carries more psychological weight than technical. Gold crossed $4,000 for the first time in October 2025, and every test of the round number since has drawn buyers. Over the past week, gold dipped below $4,000 more than once and recovered above $4,050 each time, helped by easing oil and reduced liquidation pressure. That recovery came despite a firmer dollar and rising Treasury yields, which suggests the buyers at $4,000 are price-sensitive physical holders rather than macro traders.
Chinese household demand is the most visible part of that floor. Retail buying in China has absorbed supply every time gold has approached $4,000, and that demand is relatively indifferent to US yields. It is the reason gold has not followed the September Fed hike with a deeper decline toward the June low. It is also the reason the downside since October 22 has been measured at roughly 4% from the $4,150 level of a month ago rather than the 10% to 15% drop that a 5% 10-year might otherwise justify.
The weekend data showed how fragile that floor is. The LBMA PM price fixed at $4,013.30 on October 23, barely above $4,000. Spot gold was quoted at $3,996 on Sunday and $4,004 on Tuesday morning before oil eased. Each of those prints was a test, and each held. Gold reclaimed $4,000 on Monday and pushed through $4,050 on Tuesday.
A fourth test after a hawkish Fed would carry more risk. Buyers who defended $4,000 three times would be defending it with the 10-year above 5%, December hike odds near 90% and oil rising. If $3,975.23 fails, the next support sits at the June lows between $3,960 and $3,940, with a deeper projection near $3,830. Those levels represent a further 2.3% to 5.5% decline from $4,055. The floor has held so far because the macro shock that would break it has not arrived. The Fed is the most likely candidate to deliver it.
The Technical Map: Below Both Moving Averages, RSI at 41
Gold’s chart reads as a downtrend that is losing momentum rather than one that has reversed. On the daily timeframe, spot trades below both the 20-day and 100-day moving averages. The 14-day relative strength index sits at 41, below the neutral 50 line but well above the oversold 30 level, which describes a market that has corrected without capitulating. Price is consolidating inside a downward-sloping parallel channel, with momentum indicators flattening.
The near-term levels are tightly clustered. Immediate support is the 100-hour exponential moving average at $4,044.21, followed by the $4,034 level where gold broke out of its overnight range, and then the lower Bollinger band near $4,015. Below that sits the $4,000 handle and Friday’s $3,975.23 low.
Resistance starts at $4,056 to $4,070. That band is where the two-day recovery stalled, and it was support during the $4,100 to $4,200 range that held through early October. A close above $4,075 would clear Tuesday’s high and the opening level of December futures. Above that, $4,095 marks the first upside target set during Tuesday’s bounce off $4,000, and $4,100 marks the bottom of the broken range.
The level that would change the trend is the 20-day moving average at $4,125, 1.7% above $4,055. A daily close above it would end the near-term bearish bias, reclaim the lower half of the October range and put the 100-day moving average near $4,220 in play. The 100-day line is 4.1% above the current price, and it marks the dividing line between a correction and a resumed bull market.
The structure since October 22 favors range trading. Gold has made a lower high at $4,065 after the breakdown, but it has also made a higher low after $3,975.23. That narrowing pattern usually resolves on a catalyst, and gold has two in the next 24 hours.
The asymmetry in the levels is worth noting. The distance from $4,055 to the bear target at $3,940 is $115, or 2.8%. The distance to the 20-day line at $4,125 is $70, or 1.7%, and to the 100-day at $4,220 is $165, or 4.1%. The market is closer to its upside trigger than its downside target, but the trend still points down until $4,125 is reclaimed.
Speculators Have Cut Longs for Eight Straight Weeks
Positioning data shows a market that has been de-risking steadily without capitulating. Hedge funds and other leveraged speculators, classified as managed money by the US regulator, cut their net long positions in Comex gold futures and options for an eighth consecutive week, to 338.05 tonnes as of October 20.
Eight weeks of selling is a long streak, but the size of the retreat is modest relative to gold’s price decline by historical standards. Speculators have trimmed exposure rather than flipped to outright bearish bets. That matters for the forecast in two ways. First, positioning is lighter than it was at the January peak, so there is less forced selling left to come. Second, speculators still hold a large net long, so a hawkish surprise could trigger another round of liquidation.
The October 20 data does not capture the sharp falls on October 22 and 23, when gold broke below $4,100 and then $4,000. The next report, covering the week through October 27, is likely to show a ninth weekly cut, and possibly a larger one, as stop-loss selling through the breakdown hit leveraged accounts. That would bring the managed money net long closer to levels that have historically marked short-term bottoms.
The positioning picture explains the price action at $4,000. With speculators already lighter, the marginal seller below $4,000 has been the macro fund reacting to yields and oil, while the marginal buyer has been the physical holder. Physical buyers have won every test so far, because the speculative supply that could overwhelm them has already been partly drained.
The risk is that a hawkish Fed restarts the liquidation. If Warsh confirms December and the 10-year rises above 5.05%, speculators who held through the October 22 breakdown may finally exit, and the selling would arrive at exactly the $4,000 level where physical demand has been concentrated. That would test the floor harder than at any point this month.
The reverse is also true. A dovish surprise would hit a market where speculative longs have been cut for two months, leaving room to rebuild positions. Re-leveraging from 338.05 tonnes toward the levels held in August would add meaningful buying pressure and could carry gold through $4,125 quickly. Light positioning makes gold more sensitive to good news than it was at the January peak.
GLD Posted Its Biggest Weekly Outflow Since March
The exchange-traded fund data confirms that Western institutional demand has softened. Holdings in SPDR Gold Shares (GLD), the largest gold-backed ETF, fell 1.64% last week to 1,041.65 tonnes. That was the fund’s largest weekly outflow since the week ending March 6, and it coincided with the October 22 to 23 breakdown below $4,100 and then $4,000.
The flows were not uniform. Holdings in the iShares Gold Trust (IAU), the second-largest gold ETF, were broadly unchanged, edging up 0.03% to 463.05 tonnes. The divergence suggests that the selling came from large institutional accounts that use GLD for tactical exposure, while longer-horizon investors in IAU held their positions.
GLD’s numbers frame the scale. The fund reported $134.37 billion in assets under management as of October 23, with a closing price of $366.61 that day and exchange volume of 1,747,798 shares. The LBMA PM gold price used to value the fund’s holdings that day was $4,013.30. At Wednesday’s $4,055 spot price, GLD’s holdings are worth more than on Friday, but the tonnage has shrunk, which means the asset growth is coming from price rather than new money.
ETF flows are the clearest channel through which US interest rates reach gold demand. Institutional allocators compare GLD’s zero yield with a 5.01% 10-year Treasury and a 3.75% to 4.00% fed funds rate. When December hike odds rise, the cost of holding gold rises, and the marginal allocation shifts to bonds. The October 22 equity selloff made that explicit, when safe-haven money flowed into Treasuries rather than gold.
A reversal in ETF flows would be one of the strongest confirmations that gold has bottomed. Two weeks of stable or rising GLD holdings after a dovish Fed would tell you Western institutions are returning, and that demand would add to the physical buying from Asia that has held the $4,000 floor. Further outflows after a hawkish Warsh would remove the last major source of support outside physical markets and put $3,975.23 under real pressure.
The GLD outflow also signals where the money is not going. Gold is no longer the default hedge for the AI equity risk or the geopolitical risk in the Middle East. Until yields fall, Western institutions are choosing Treasuries for safety and income, and gold is left with central bank and retail physical demand as its core support.
Silver at $53.91 Shows the Metals Complex Under Pressure
Silver is weaker than gold and tells you the pressure on precious metals is broad. Spot silver traded at $53.91 an ounce early Wednesday, down 0.9%, near an 11-month low. Silver set its record of $121.62 on January 29, 2026, the day after gold’s peak, and it now trades 55.7% below that high, a drawdown more than twice gold’s 27.5%.
The gold-to-silver ratio captures the divergence. At $4,055 gold and $53.91 silver, the ratio stands at 75.2, meaning it takes 75.2 ounces of silver to buy one ounce of gold. A rising ratio signals that investors prefer gold’s monetary role over silver’s industrial exposure, which is typical when growth concerns rise alongside tight monetary policy.
Silver’s industrial demand makes it more sensitive to the same forces weighing on gold. Higher oil raises input costs for manufacturers. A hawkish Fed slows the economy and reduces industrial activity. A stronger dollar raises the cost of the metal for overseas buyers. All three are in play this week, and silver is absorbing them more heavily than gold.
The metals complex has given back much of the January surge. Platinum set a record near $2,920 on January 26, 2026, and palladium reached a cycle high near $2,200 the same month without setting a new record. The broad run in precious metals peaked in the last week of January, and the nine months since have been a steady unwind, interrupted by brief rallies on geopolitical headlines.
Silver’s weakness also matters as a signal for gold’s next move. Historically, durable gold rallies have been accompanied or led by silver strength, because silver’s higher beta attracts speculative capital when the macro backdrop turns supportive. A silver rally back above $56, or a gold-to-silver ratio falling below 72, would be an early sign that the market sees an easing in Fed pressure. Silver continuing to make new lows while gold holds $4,000 would suggest the gold floor is being held by physical buyers alone, without the speculative support needed for a sustained recovery.
For Wednesday, silver’s 0.9% decline against gold’s 0.6% to 0.7% pullback in early trading confirms that the selling is macro-driven. Investors are pricing tighter policy across the metals, not rotating from one to another.
Read More
-
Yen Stalls at 160 Despite a 3% JGB and Tokyo Core CPI at 2.0% — Intervention Sits at 164, Friday's Payrolls Decide
02.09.2026 · TradingNEWS ArchiveEnergy
-
GOOGL ($323.61) Faces Its Capex Reckoning as Cloud Nears 92% Growth — Earnings Path to $341
28.10.2026 · TradingNEWS ArchiveStocks
-
XRP-USD ($1.317) Stuck Below Its $1.3346 Midpoint as RLUSD Shifts to Ethereum — Range Holds Above $1.25
28.10.2026 · TradingNEWS ArchiveCrypto
-
Brent ($115.30) Retakes $115 as US Crude Stocks Drop to 410.6M Barrels Before the Midterms — Path to $120
28.10.2026 · TradingNEWS ArchiveCommodities
-
Dow +82 to 52,459, S&P 500 +0.11%, Nasdaq Flat Ahead of Warsh; Enphase ENPH −15%
28.10.2026 · TradingNEWS ArchiveMarkets
-
GBP/USD (1.3283) Tests Range Floor After a Shock-Free Budget, BoE Hike Priced Above 90% — Rebound Path to 1.3409
28.10.2026 · TradingNEWS ArchiveForex
Newmont’s $2,535 Per Ounce Margin Shows Miners Are Fine at $4,055
While bullion corrects, the producers are printing record profits at prices well above their costs. Newmont (NEM), the world’s largest gold producer, reported third-quarter 2026 results with record third-quarter adjusted net income of $2,309 million, or $2.20 per diluted share, up $0.49 from a year earlier. Reported net income rose $643 million to $2,475 million. Adjusted EBITDA increased 19% to $3,951 million.
Production improved and costs fell. Newmont produced 1.30 million attributable gold ounces in the quarter, up 7% from the second quarter, and generated $1.9 billion of free cash flow. The company held its full-year production guidance at 5.9 million attributable ounces and lowered its all-in sustaining cost guidance to $1,520 per ounce from $1,590.
The margin math is striking. Newmont’s average realized gold price in the third quarter was $4,317 per ounce, against $3,539 a year earlier. At Wednesday’s $4,055 spot price, the margin over the new $1,520 all-in sustaining cost is $2,535 per ounce. Even if gold fell to the $3,940 bear target, the margin would be $2,420 per ounce, still among the highest in the industry’s history.
That cash is going back to shareholders. Newmont ended the quarter with $8,827 million in cash and $12,827 million of total liquidity, and it repurchased $5,241 million of stock in the first nine months of 2026. It declared a quarterly dividend of $0.26 per share and has cut its share count by roughly 10% since February 2024. The company also agreed to pay $1.95 billion to Barrick Mining as part of a deal to contribute development properties to the Nevada Gold Mines joint venture.
The quarter’s average gold price of $4,204.59 per ounce, up 17.6% from a year earlier, shows how much of the 2026 gain miners have already locked in, even with spot now 3.6% lower at $4,055. Barrick reports its third-quarter results on November 9.
For the gold forecast, the miners provide a cushion rather than a catalyst. Producers with costs near $1,520 have no incentive to cut output at $4,055, so supply will not tighten to support price. But their cash generation and buybacks make the gold equities a more attractive way to hold the metal than GLD when yields are 5%, which partly explains the ETF outflows. The VanEck Gold Miners ETF (GDX) and the senior producers become the vehicle of choice when bullion stalls but stays far above production costs.
Thursday’s PCE and GDP Are the Second Test Inside 24 Hours
The Fed is the first catalyst, not the last. At 8:30 a.m. ET Thursday, October 29, the US releases September personal consumption expenditures inflation, the Fed’s preferred gauge, alongside the advance estimate of third-quarter GDP. Those reports land 18 hours after Warsh’s press conference and can either confirm or reverse whatever move the Fed triggers.
The PCE report is the more important for gold. September consumer prices rose 3.7%, and core prices rose 2.6%, both above forecast. If PCE confirms that pace, the December hike priced at 84.4% becomes close to certain, and gold faces a second leg of pressure toward $4,000 and the $3,975.23 low. If PCE comes in softer, particularly in the core measure, it would undercut the hawkish case even if Warsh sounds firm on Wednesday, and gold could retest $4,065 to $4,075 on Thursday.
GDP matters through the growth channel. A strong third-quarter print would support the case that the economy can absorb another hike, adding to yield pressure. A weak print, consistent with September payrolls of just 29,000, would raise the odds that the Fed holds in December, which would favor gold.
Friday adds another layer. The Bank of Japan announces its policy decision, and markets expect it to hold off on aggressive tightening. A dovish BoJ would keep USD/JPY above 157.50 and the dollar firm, which weighs on gold. A surprise hike would strengthen the yen, weaken the dollar index from 102.42 and provide a lift to bullion. The European Central Bank also meets this week.
The sequence creates a three-step test. Wednesday’s Fed sets the tone. Thursday’s PCE and GDP confirm or challenge it. Friday’s BoJ shapes the dollar into the weekend. Gold needs at least two of the three to break dovish to clear $4,125. It needs only one hawkish surprise to retest $4,000.
The calendar also explains why gold has compressed into a $45 range. No one wants to commit capital at $4,055 with three central bank and data events inside 72 hours. The range will likely break on Thursday morning rather than Wednesday afternoon, because the PCE print will either validate or contradict whatever Warsh says.
Gold Price Forecast: $4,000 to $4,075 Base Case, $4,125 on a Dovish Turn
The forecast for XAU/USD this week comes down to whether the oil-to-rates channel tightens or loosens over the next 72 hours. Gold at $4,055 is trading 27.5% below its $5,589.38 January record, 2.29% below its level a month ago and 3.10% above a year ago, and it is pinned by a 5.01% 10-year Treasury yield, a dollar index at 102.42 and an 84.4% probability of a December Fed hike.
The base case is a $4,000 to $4,075 range into Friday. The Fed holds at 3.75% to 4.00%, as priced at 92.8%, and Warsh leaves December open without committing. Gold chops around the $4,000 handle into Thursday’s PCE, with physical buying defending the low end and the $4,065 to $4,070 resistance band capping rallies.
The bullish case targets $4,125, the 20-day moving average, with an extension to $4,220, the 100-day. It needs a less hawkish Warsh who leans on the 29,000 September payrolls and frames December as data-dependent, a soft PCE print on Thursday and Brent back below $110. That combination would push the 10-year below 5%, ease the dollar and trigger re-leveraging by speculators who have cut net longs for eight straight weeks to 338.05 tonnes.
The bearish case targets $3,940. It requires Warsh to signal December, PCE to run hot and confirmation of damage at Ras Tanura pushing Brent above $115.59. That would drive the 10-year above 5.05%, extend GLD’s outflows from its 1,041.65-tonne holdings and break the $3,975.23 low. Below $3,940, the projection near $3,830 comes into view.
The verdict is mixed with a bearish tilt in the near term and a constructive bias beyond it. The trend remains down while gold trades below $4,125, and the oil-driven inflation channel will keep pressure on bullion as long as Brent holds above $110. But the $4,000 floor has held three times, speculative positioning is lighter, Newmont is earning a $2,535 per ounce margin with costs at $1,520, and any Fed pivot toward patience would hit a market positioned for the opposite. Gold at $4,055 is a hold with $3,975.23 as the line in the sand: a daily close above $4,125 turns the forecast bullish toward $4,220, while a close below $3,975.23 opens $3,940.