





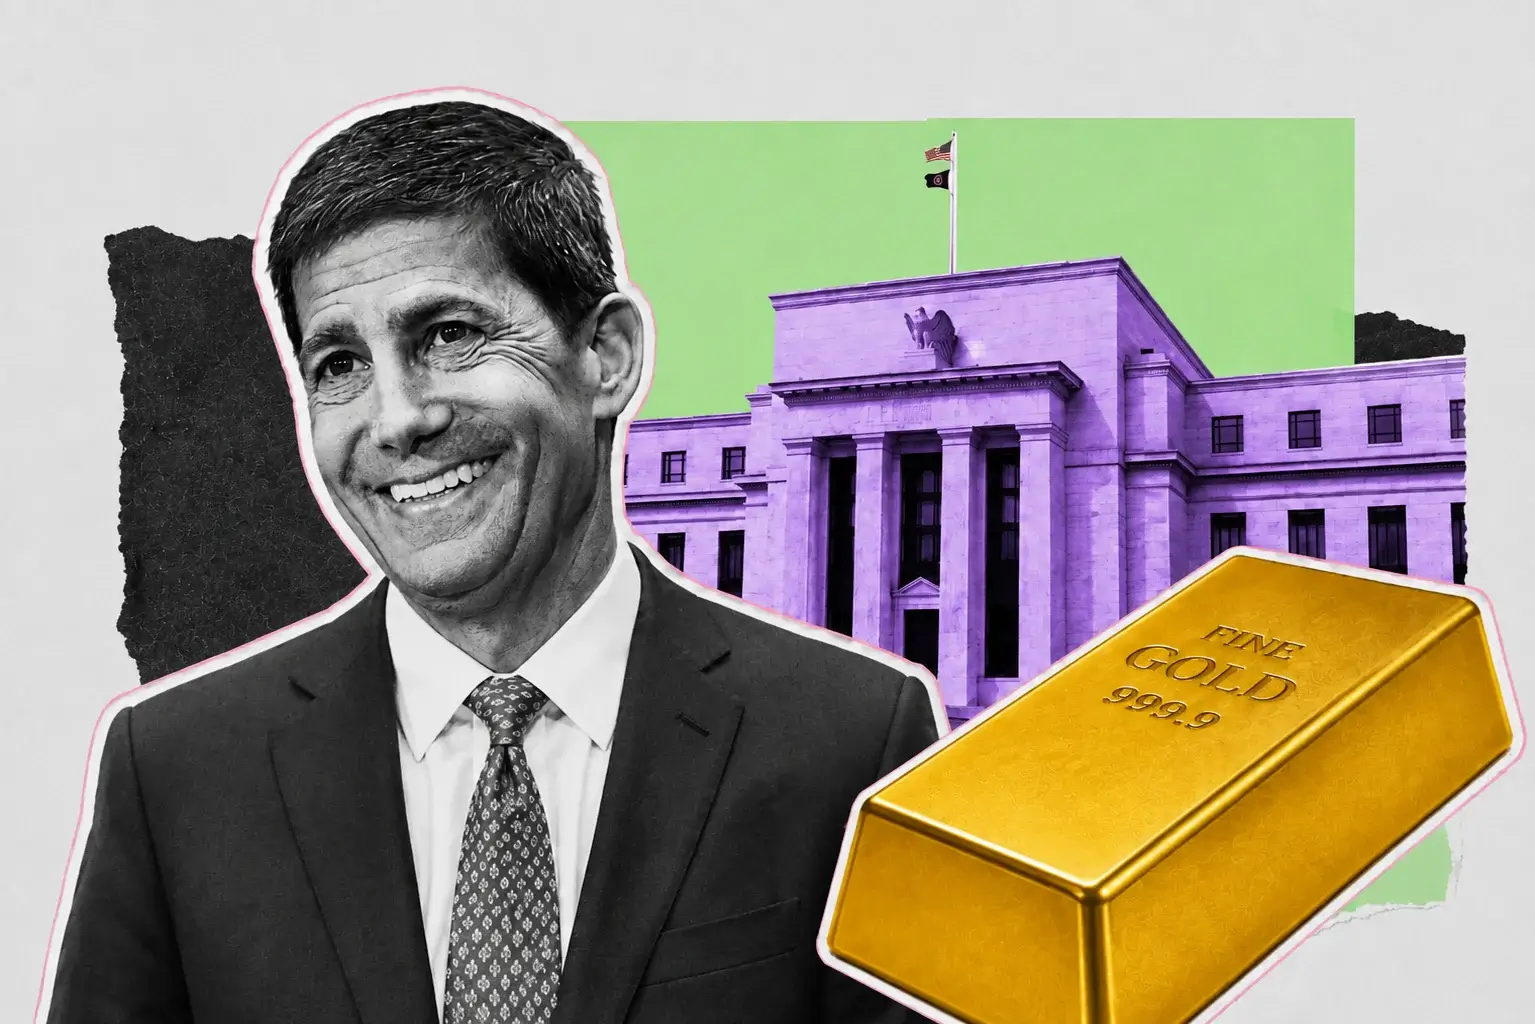
Gold Climbs to $4,399 on a 2-Week Advance While Silver Jumps to $65.83
Weak US retail sales and a softer dollar index at 99.49 lifted bullion toward a 2-month high near $4,400 | That's TradingNEWs
Key Points
- Spot gold gained 0.5% to $4,399.44 while gold futures advanced 0.4% to $4,455.90.
- Silver climbed 1.7% to $65.83 and platinum rose 1.8% to $1,749.15 as the dollar index slipped to 99.49.
- Central banks purchased 289 tonnes in Q2 2026, up 62% year over year and a record second quarter.
Gold extended a two-week advance on Monday, with spot XAU/USD gaining 0.5% to $4,399.44 an ounce by 01:04 ET. Gold futures added 0.4% to $4,455.90, while the December contract advanced 0.3% to $4,448.10. The metal traded within $4,367.37 to $4,416.49 through the session against an opening print of $4,376.59 and a prior close at the same level. The move places bullion at a two-month high and within touching distance of the $4,400 threshold that has capped every attempt since June.
The dollar supplied the entire impulse. The US Dollar Index declined 0.2% to 99.49 before printing 99.363, and the Bloomberg Dollar Spot Index slipped 0.1% toward a third consecutive decline and levels last seen in May. A weaker dollar makes dollar-denominated bullion cheaper for buyers using other currencies, which is the mechanical channel through which Friday's US consumer data reached the gold market. Global shares edged higher and European equities advanced led by basic resources stocks as gold rose.
Precious metals moved together and silver led. Silver climbed 1.7% to $65.83 an ounce after gaining close to 2% in the week ended August 16, with futures at $65.835. Platinum rose 1.8% to $1,749.15 and palladium advanced 1.6% to $1,333.35. Copper added 1.03% to $6.6813. Broad strength across both the monetary and industrial ends of the complex distinguishes this session from a pure safe-haven bid.
Domestic markets outside the dollar bloc amplified the move. On India's Multi Commodity Exchange, October gold futures rose ₹676, or 0.44%, to ₹1.55 lakh per 10 grams, while September silver futures gained ₹2,270, or 0.96%, to ₹2.38 lakh per kilogram. The rupee weakened to around ₹95.59 per dollar in early trade, lifting the landed cost of internationally priced commodities and adding a second layer of support to local prices. Currency depreciation against a falling dollar compounds rather than offsets the bullion bid in importing markets, which is why Asian physical demand tends to strengthen precisely when Western investors are least engaged.
Friday's Close and the Two-Week Advance in Context
Gold entered the new week after gaining close to 1% over the prior five sessions, and the path there was anything but linear. Spot advanced 0.7% to $4,379.39 on Friday with US futures up 0.4% to $4,437.30, recovering from a Thursday decline of 1.3% that followed a print at the highest level since June 5. Earlier Friday the metal had slipped below $4,350 as investors locked in profits while assessing the Fed's policy outlook and Middle East developments.
The inflation data drove the rebound. July core producer prices increased less than expected, providing further evidence that inflationary pressures are not broadly intensifying following a subdued CPI report the prior day. That pair of readings tipped the balance toward a Federal Reserve hold in September and knocked the dollar index 0.4% lower on Friday alone. Gold also drew support from an unexpected decline in US nonfarm payrolls in July, a print that removed the labour-market justification for further tightening.
The monthly arithmetic frames the recovery. Across the window from July 16 to August 16, gold traded between $3,959.69 and $4,450.23, averaging $4,158.25 for a gain of 7.74% and a peak-to-trough spread of $490.54. That $3,959 low is the reference point that matters: gold has added roughly 11% off it in a month. The metal posted its largest one-week gain since January during the first week of August, touched a two-month peak near $4,450, then corrected to finish that week virtually unchanged as the Middle East crisis remained unresolved.
Longer-horizon performance splits sharply by lookback. Gold is up 2.53% over one week, between 7.39% and 9.66% over one month, and between 30.92% and 31.90% over twelve months. Year to date, the metal has advanced only 1.10%. That divergence between a 31% annual gain and a 1.1% calendar-year gain is the single most important statistic in the gold market, and it means every 2026 buyer of the metal is roughly flat while every 2025 buyer holds a substantial profit.
The $4,400 Barrier and the 200-Day SMA at $4,504
The resistance structure above spot is tightly clustered and each level carries a distinct function. The immediate hurdle is $4,400 itself, and a confirmed break there exposes the psychological $4,450 that marked the August peak. Above that sits the 200-day simple moving average at $4,504, which is the level that determines whether gold's recovery constitutes a trend reversal or a countertrend rally inside a larger decline.
A break above $4,400 is required to confirm further momentum, and the qualifier matters because gold has approached the level three times since June without holding it. The August 6 attempt reached $4,450.23 intraday before failing. Analysts framing this session emphasise that acceptance rather than penetration determines the outcome, which mirrors the volume-profile logic that has governed the metal all summer.
Intraday structure supports the bulls for now. Gold rebounded from a support band at $4,347 to $4,336 and continues its short-term uptrend on lower timeframes, having established a series of higher lows off the early-August base. On the five-hour chart the constructive daily structure remains intact following the strong recovery from those lows, though the recovery has yet to produce the follow-through that would confirm a durable directional change.
The distance to the 200-day average quantifies what a genuine reversal requires. At $4,504, that average sits 2.4% above spot at $4,399.44. Clearing it would place gold above its long-term trend measure for the first time since the metal broke down in the second quarter, and it would open the path toward the Q2 average price of $4,506 that now functions as a structural pivot. Failure at $4,450 for a second time in two weeks establishes a double top and shifts the burden entirely to the downside levels.
Support Ladder Runs From $4,347 Down to the 50-Day at $4,146
The downside structure is layered and each rung has been tested within the past six weeks. The first support is the immediate band at $4,347 to $4,336 from which the metal rebounded. Beneath that sits the recent low of the day at $4,311, followed by the round $4,300 level. Clearing $4,300 exposes the July 6 high at $4,202, then the 50-day simple moving average at $4,146, and finally $4,100.
The gap between the 50-day at $4,146 and the 200-day at $4,504 measures 358 points, or 8.1% of price, and gold sits inside that band closer to the upper boundary. That positioning describes a market in the process of resolving a moving-average compression rather than one trending in either direction. Gold trading between its short and long-term averages with both still declining is the configuration that produces the failed breakouts August has delivered.
The $4,100 floor carries the most weight of the lower levels because it aligns with the July 31 spot print of $4,047 and the $3,959.69 monthly low. A break beneath $4,100 would surrender the entire August recovery and return gold to the base it built during the second-quarter breakdown. That base held on three separate tests, which is what makes it structurally significant rather than merely a round number.
Forward projections span an unusually wide band, reflecting genuine two-way risk. One framework places August trade between $3,580.75 and $4,645.91 with a month-end estimate of $4,084 to $4,120.78, citing the geopolitical situation and the potential for a Federal Reserve rate increase, against an estimated pivot at $4,170.80. A month-end projection below current spot while the near-term technical structure points higher captures the tension precisely: the tactical setup favours the upside while the policy risk favours the downside, and the resolution depends on which arrives first.
Gold Trades 21.5% Below Its January Record of $5,602
The number absent from most current gold commentary is the peak. Gold reached its all-time high of $5,602.23 on January 29, 2026. At $4,399.44, the metal trades 21.5% below that record. The 52-week range spans $3,311.46 to $5,595.46 on spot and $3,311.56 to $5,602.23 on the broader measure, which means gold has traversed a 69% range within twelve months.
That drawdown reframes every bullish datapoint. A 31% year-over-year gain sounds like a bull market until measured against a 21.5% decline from the high, and both statements are simultaneously accurate. Gold rallied violently through late 2025 and January 2026, peaked, then gave back roughly two-fifths of the advance across the second quarter. The Q2 average price of $4,506 sat above where the metal trades today, and spot reached $4,047 as of July 31.
The demand backdrop during the ascent explains the magnitude. Total gold demand including over-the-counter activity topped 5,000 tonnes in 2025, a year that produced 53 all-time highs in the price. Investment drove that market, with safe-haven and diversification motives generating substantial ETF inflows alongside exceptional bar and coin buying. A market that sets 53 records in a calendar year builds a correspondingly large cohort of positions at elevated entry prices.
The unwind was orderly rather than violent, which is why it has attracted less attention than the rally. July delivered a gain of approximately 0.5%, marking gold's first monthly increase since February, supported by weaker US inflation data and the Fed's decision to hold rates. Five consecutive monthly declines followed by two months of recovery is the shape of a completed correction or the pause inside a longer one, and the 200-day average at $4,504 is the line that distinguishes them.
September Hike Odds Collapse From 47% to 30%
The repricing of Federal Reserve expectations is the proximate driver of gold's two-week advance, and the magnitude of the shift is substantial. Markets now place the probability of a September rate increase at roughly 30%, down from 47% a month earlier. Other measures put it near one in three, down from close to 50% before last week's data, while swaps pricing implies approximately one in four. All three readings agree on direction.
The data sequence produced the move. July retail sales fell 0.6% month-on-month against consensus for a 0.1% gain, the steepest monthly contraction in more than a year. The University of Michigan preliminary August sentiment index fell to 51 against forecasts of 55, declining for the first time in three months. July nonfarm payrolls delivered an unexpected outright decline. July CPI came in subdued and core PPI increased less than expected.
Gold's sensitivity to this repricing is structural rather than sentimental. The metal generates no interest income, so it becomes relatively more attractive whenever expectations for borrowing costs decline. As a yield-less asset, gold rises with lower rates and struggles with higher ones, and most of the transmission runs through the dollar. Softer economic data reduces tightening pressure, which weakens the currency, which lifts dollar-priced bullion. Both channels operated in the same direction over the past ten sessions.
The policy setting keeps risk live in both directions. The federal funds target range remains 3.50% to 3.75%, held since December, with the July 28-29 meeting producing a 9-3 vote in which Cleveland's Beth Hammack, Minneapolis' Neel Kashkari and Dallas' Lorie Logan all dissented in favour of a 25-basis-point increase. Inflation has exceeded the 2% objective for more than five years. A 30% hike probability is not a zero probability, and three sitting regional presidents have already voted for tightening once.
Real Yields, the Steepening Curve, and Wednesday's FOMC Minutes
The bond market is delivering a message that complicates the simple lower-rates-lift-gold framework. The 10-year Treasury yield holds 4.695%, the 30-year sits at 5.267%, the five-year prints 4.362% and the three-month bill yields 3.79%. The 10-2 year spread widened to 31.32 basis points, up 4.15 basis points or 15.27% in a single session, implying a two-year near 4.382%. Treasuries rose across the curve on Monday.
Steepening rather than parallel rallying is what gold is actually trading against. The front end is repricing lower on soft consumer data while the long end refuses to follow, held up by higher oil prices, elevated fiscal deficits and capital demand from the artificial intelligence investment boom. A 5.267% thirty-year yield represents substantial opportunity cost for a non-yielding asset, and it is the reason gold's response to falling hike odds has been measured rather than explosive.
Term premium expansion cuts both ways for bullion. Rising long-end yields raise the cost of holding gold, but the drivers of that rise, meaning deficits and inflation risk premium, are precisely the conditions gold is meant to hedge. That is why the metal can advance alongside a 5.267% long bond when the front end is easing. The composition of the yield move matters more than its direction.
Wednesday's release of the July 28-29 FOMC minutes is the week's decisive event for the metal, with Chair Kevin Warsh scheduled to speak at the Jackson Hole symposium running August 27 to 29. Warsh became chair on May 13, removed forward guidance from the post-meeting statement and has stated there is no soft implicit target on this committee's watch. A chair who declines to signal forces the market to extract everything from the minutes. Flash August PMI data, housing starts, industrial production and the Philadelphia Fed Manufacturing Index fill out the calendar and each carries the potential to shift September pricing again.
Central Banks Bought More Than 530 Tonnes in the First Half
Official-sector demand is running at a record pace and it is the strongest structural argument for gold at these levels. Net central bank gold demand reached 289 tonnes in the second quarter of 2026, a 62% increase over the second quarter of 2025 and the fastest pace ever recorded for any second quarter in the World Gold Council's historical series. That followed 244 tonnes in the first quarter, the strongest quarterly buying since the fourth quarter of 2024 and above both the previous quarter and the five-year average.
Combined first-half sovereign accumulation exceeded 530 tonnes. Sustained through year-end, that pace would set a full-year record, surpassing the 1,045 tonnes purchased in 2024 that accounted for roughly a fifth of overall demand. Central banks continued buying through a quarter in which the price fell, which is the behaviour that distinguishes them from every other category of gold buyer.
The mechanics of that behaviour deserve emphasis because they invert normal market logic. Reserve managers are not rate-sensitive. They do not run stop-losses. A central bank targeting a specific tonnage allocation has a mathematical incentive to buy more when prices fall, because each ounce costs less and moves the institution closer to its strategic target. Falling prices increase official-sector demand rather than reducing it, which places a bid beneath the market that strengthens as the market weakens.
Forward intentions confirm the trend. The World Gold Council's 2026 Central Bank Gold Reserves Survey, published June 16, found that 89% of reserve managers expect global central bank gold holdings to increase over the next twelve months. A record 45% of the 76 central banks surveyed plan to add to their own reserves, up from 43% in 2025 and representing the broadest participation in the survey's nine-year history. A small number of institutions under acute fiscal or currency pressure have sold in 2026, with Poland's central bank chief weighing sales to fund defence spending, but the overwhelming majority remain net buyers.
Poland Adds 51 Tonnes and China Posts Its Largest Quarter Since 2023
The composition of official demand in the second quarter was broad rather than concentrated, which strengthens the durability of the trend. The National Bank of Poland led with purchases of 51 tonnes, lifting its first-half total to 82 tonnes and its stockpile to 632 tonnes against a stated 700-tonne target. That remaining 68-tonne gap represents committed forward demand from a single institution.
The People's Bank of China added 33 tonnes, its largest quarterly increase since the fourth quarter of 2023, raising first-half purchases to 40 tonnes and reported holdings to 2,346 tonnes. China had accelerated earlier in the year with 8 tonnes in April, its largest monthly addition since December 2024. Reported buying extended well beyond the two largest participants, with Uzbekistan adding 16 tonnes, Kazakhstan 15 tonnes, and both Jordan and the Czech Republic 6 tonnes each.
The selling side moderated significantly, which is why net figures improved so sharply. Notable sales that weighed on first-quarter net purchases, particularly from Turkey as the largest seller in that period, fell back to only modest bullion disposals in the second quarter. Russia and SOFAZ had also contributed to first-quarter reported sales. A quarter in which buying accelerated 62% while selling contracted produces the record net figure regardless of any single institution's behaviour.
The strategic character of this demand is what makes it price-insensitive. Central banks accumulated through a quarter that saw the average price at $4,506 and spot fall to $4,047 by July 31, contending with heightened uncertainty across multiple fronts including the conflict involving Iran, the United States and Israel. Continued accumulation against that backdrop underscores the strategic rather than tactical nature of the purchases. Holding periods are longer, sensitivity to Fed policy cycles is lower, and the motivation for ownership is structurally different from that of any exchange-traded fund holder.
The 298-Tonne ETF Overhang Sits Above the Market at $4,000
The counterweight to sovereign demand is the exchange-traded fund complex, and it carries a measurable supply overhang. Standard Chartered analyst Suki Cooper flagged in a June 24 research note that approximately 298 tonnes of gold inside ETFs is held at a loss at prices around $4,000, up from 270 tonnes when gold traded above $4,250. That underwater cohort expands as price falls and creates sell pressure as price recovers toward those entry levels.
Flow history through 2026 documents the rotation. Physically backed US gold ETFs recorded sizeable monthly outflows in March, erasing inflows accumulated earlier in the quarter amid risk-off conditions, elevated positioning and higher opportunity costs. Gold-backed funds globally recorded net outflows of 16 metric tonnes in May and continued bleeding into the first half of June before a $1.1 billion inflow snapped four consecutive weeks of redemptions.
The behavioural split between the two buyer cohorts explains 2026's price action entirely. ETF holders bought gold on a rate-cut thesis. That thesis evaporated when the Federal Reserve pivoted toward potential tightening, and those holders moved toward the exit. Central banks never held the rate-cut thesis in the first place. The resulting price action reflects a tug-of-war between short-duration rate traders and long-duration monetary strategists, and the second-quarter decline represents the paper market winning that contest.
Physical demand outside the fund complex partially offsets the drag. First-quarter total gold demand rose modestly year over year to 1,231 tonnes with value surging to a record $193 billion, driven by bar and coin investment while ETF buying slowed. Jewellery demand volumes fell to a record quarterly low on affordability pressures at high prices. Bar and coin demand is expected to feature more prominently through 2026 as elevated prices, a lack of viable alternatives in some markets, inflation concerns and heightened uncertainty attract both savers and speculators. Industrial applications account for only about 10% of annual gold demand, which means the metal's price is set almost entirely by the monetary contest rather than by end-use consumption.
Silver Breaks Out to $65.83 and the Gold-Silver Ratio Compresses to 66.8
Silver delivered the standout performance across the complex and the outperformance carries analytical weight. Silver climbed 1.7% to $65.83 an ounce, with futures at $65.835 and Indian benchmark contracts up 0.96%. That follows a gain of close to 2% in the week ended August 16. Against gold's 0.5% advance, silver outperformed by more than a full percentage point in a single session.
The gold-to-silver ratio compressed to approximately 66.8 on spot pricing and 67.6 on futures, sitting at the lower end of its multi-year range. A falling ratio historically marks periods when industrial demand rather than monetary demand sets the marginal bid for precious metals, because silver's industrial share of consumption runs far higher than gold's roughly 10%. Silver's dual role as a monetary metal and an industrial input to solar panels and electronics means it captures both the rate-repricing flow and the manufacturing cycle.
Copper's simultaneous 1.03% advance to $6.6813 confirms the industrial reading. Precious and base metals rising together while the dollar falls describes a reflationary bid rather than a defensive one. That distinction matters for forward positioning, because a defensive bid in gold typically coincides with equity weakness, and Monday delivered the opposite with Nasdaq 100 futures up 0.5% and European basic resources leading the STOXX 600 higher by 0.2% to 659.30.
The platinum group metals extended the pattern. Platinum rose 1.8% to $1,749.15 on one measure and 0.3% to $1,752.36 on another, while palladium gained 1.6% to $1,333.35. Broad participation across gold, silver, platinum, palladium and copper on the same session, with the industrial-weighted metals leading, is the signature of dollar-driven repricing across the entire commodity complex rather than a gold-specific safe-haven event. That has implications for durability: dollar-driven moves persist as long as the currency trend does, and the dollar index sitting below the 99.40 floor of its recent range keeps that trend intact.
Israel Strikes Lebanon as Hormuz Traffic Falls and Sanctions Loom
Geopolitical risk provides the second pillar beneath gold and it intensified over the weekend. Israel launched fresh strikes on Lebanon, with fighting against Iran-backed Hezbollah delivering the latest setback to efforts to end parallel Middle East wars. President Donald Trump is preparing new economic sanctions aimed at forcing Iran to surrender. US-Iran peace talks have stalled.
Shipping data documents the disruption. Tanker traffic through the Strait of Hormuz has declined, and yet Middle Eastern producers are covertly moving millions of barrels of crude through the waterway, which has kept oil prices contained and eased the inflationary channel that would otherwise argue for Federal Reserve tightening. Brent traded near $89 at $88.77, up 0.28%, while WTI sat at $81.61 with some venues quoting $82.83. Brent closing on $90 without breaching it captures the balance between physical disruption and covert supply.
That oil dynamic creates an unusual configuration for gold. Rising crude normally supports bullion through the inflation channel while simultaneously undermining it through the tightening channel, and the net effect depends on which dominates. With contained oil prices easing inflation concerns and soft consumer data reducing hike odds, gold currently captures the geopolitical premium without absorbing the rate penalty. That is the most favourable combination available to the metal.
The escalation timeline carries defined risk. Jefferies warned the uneasy truce may hold only through the US mid-term elections, after which escalation risk rises, and identified the critical variable as how high oil prices climb before Washington offers concessions. Asia and Europe carry greater exposure than the United States to a prolonged Hormuz disruption given heavier reliance on imported energy. Gasoline prices already sit roughly $1 per gallon above pre-Iran war levels, which is the mechanism connecting the conflict to July's 0.6% retail sales contraction and to the 51 sentiment reading that lifted gold last week.
Read More
-
Yen Stalls at 160 Despite a 3% JGB and Tokyo Core CPI at 2.0% — Intervention Sits at 164, Friday's Payrolls Decide
02.09.2026 · TradingNEWS ArchiveEnergy
-
QQQ ETF ($706.22) Slides 7.4% Below Its High as the Market Reprices the AI Capex Bill — $686.57 Target if $700 Breaks
22.10.2026 · TradingNEWS ArchiveStocks
-
XRPI ($7.00) and XRPR ($10.74) Slide Toward 52-Week Lows as Spot XRP ETF Flows Stall at $708,510
22.10.2026 · TradingNEWS ArchiveCrypto
-
NG ($2.775) Decoupled From Europe’s €88 Gas Crisis as LNG Feedgas Hits 18.9 Bcf/d — $3.30 Upside on Cold Weather
22.10.2026 · TradingNEWS ArchiveCommodities
-
Dollar-Yen (157.35) Loses 157.65 as the Yen Rallies on Haven Demand — 155 Target if 156 Breaks
22.10.2026 · TradingNEWS ArchiveForex
Gold Versus Bitcoin: A 31.4% Gain Against a 45.7% Decline
The safe-haven contest has produced an unambiguous verdict over the past twelve months and it is reshaping allocation flows. Gold has advanced 31.4% across the trailing year while Bitcoin has fallen 45.7% over the same span, a relative performance gap exceeding 77 percentage points. Both assets carry substantially identical nominal theses around currency debasement, above-target inflation and sovereign fiscal deterioration. Only one has delivered.
The divergence extends to the current session. Gold rose 0.5% toward a two-month high on Monday while Bitcoin failed to hold $64,000 and settled near $63,260, down close to 3% on the week. Gold at $4,399.44 carries a market value that dwarfs Bitcoin's $1.27 trillion capitalisation, and the flow data explains the gap: central banks bought 530 tonnes of gold in the first half while spot Bitcoin ETFs recorded roughly $4.5 billion of net outflows and the largest corporate holder began selling.
Structural buyer composition is the whole story. Gold's marginal buyer is a sovereign reserve manager with a multi-decade horizon, no stop-loss and an incentive to buy more when prices fall. Bitcoin's marginal buyer through the 2024-2025 cycle was a rate-sensitive ETF allocator with a cost basis near $83,080 and a redemption option available intraday. When the rate-cut thesis evaporated, one cohort accelerated purchases and the other liquidated.
That contrast has consequences for how each asset responds to the current macro setup. Falling hike odds lifted gold 2.53% over the past week and left Bitcoin 3% lower. An asset that declines when its stated thesis strengthens has a demand problem rather than a narrative problem. Gold's 21.5% drawdown from January's $5,602 record is real and unresolved, but the metal is recovering into improving macro conditions while its principal competitor for haven allocation is not. Senator Cynthia Lummis has proposed the United States sell a portion of its gold reserves to buy Bitcoin, a trade the past twelve months has priced decisively.
The Forecast: $4,504 Decides the Trend, $4,146 Decides the Cycle
The bullish path requires three sequential confirmations. First, a daily close above $4,400, which converts the barrier that has capped three attempts since June into support. Second, acceptance above $4,450, the August peak and the level where the prior breakout failed, demonstrated through consolidation rather than a single wick. Third, a close above the 200-day simple moving average at $4,504, which would place gold above its long-term trend measure for the first time since the second-quarter breakdown and open the Q2 average of $4,506 as a launching point rather than a ceiling.
The bearish path requires two. A loss of the $4,347 to $4,336 support band from which Monday's rebound originated, followed by a break beneath $4,311 and the round $4,300 level. That sequence exposes the July 6 high at $4,202 and then the 50-day average at $4,146. Below $4,100 the metal surrenders the entire August recovery and returns to the $3,959.69 base, with month-end projections clustering at $4,084 to $4,120.78 against a pivot at $4,170.80.
The base case for the coming sessions is continued grinding advance within $4,347 to $4,450, with Wednesday's FOMC minutes as the catalyst most likely to break the range. Silver's outperformance and the compressed 66.8 gold-silver ratio argue for the upside resolution, as does a dollar index trading below the 99.40 floor of its stated range. Against that, the 298-tonne underwater ETF cohort supplies mechanical selling into any rally toward $4,500, and a 30% September hike probability remains a live tail rather than a dismissed one.
The asymmetry favours gold on structure and disfavours it on positioning. Central bank demand at 530 tonnes across the first half establishes a price-insensitive bid that strengthens as prices fall, which caps downside severity. ETF overhang above $4,000 and a 5.267% thirty-year Treasury yield cap upside velocity. That combination produces exactly what the past six weeks delivered: a durable floor, repeated rejections at resistance, and a market that requires either a dovish surprise from the minutes or a Jackson Hole signal from Warsh to resolve. The metal's 1.10% year-to-date gain against a 30.92% annual gain remains the cleanest summary of where gold sits, and reclaiming $4,504 is the single event that would change it.





