





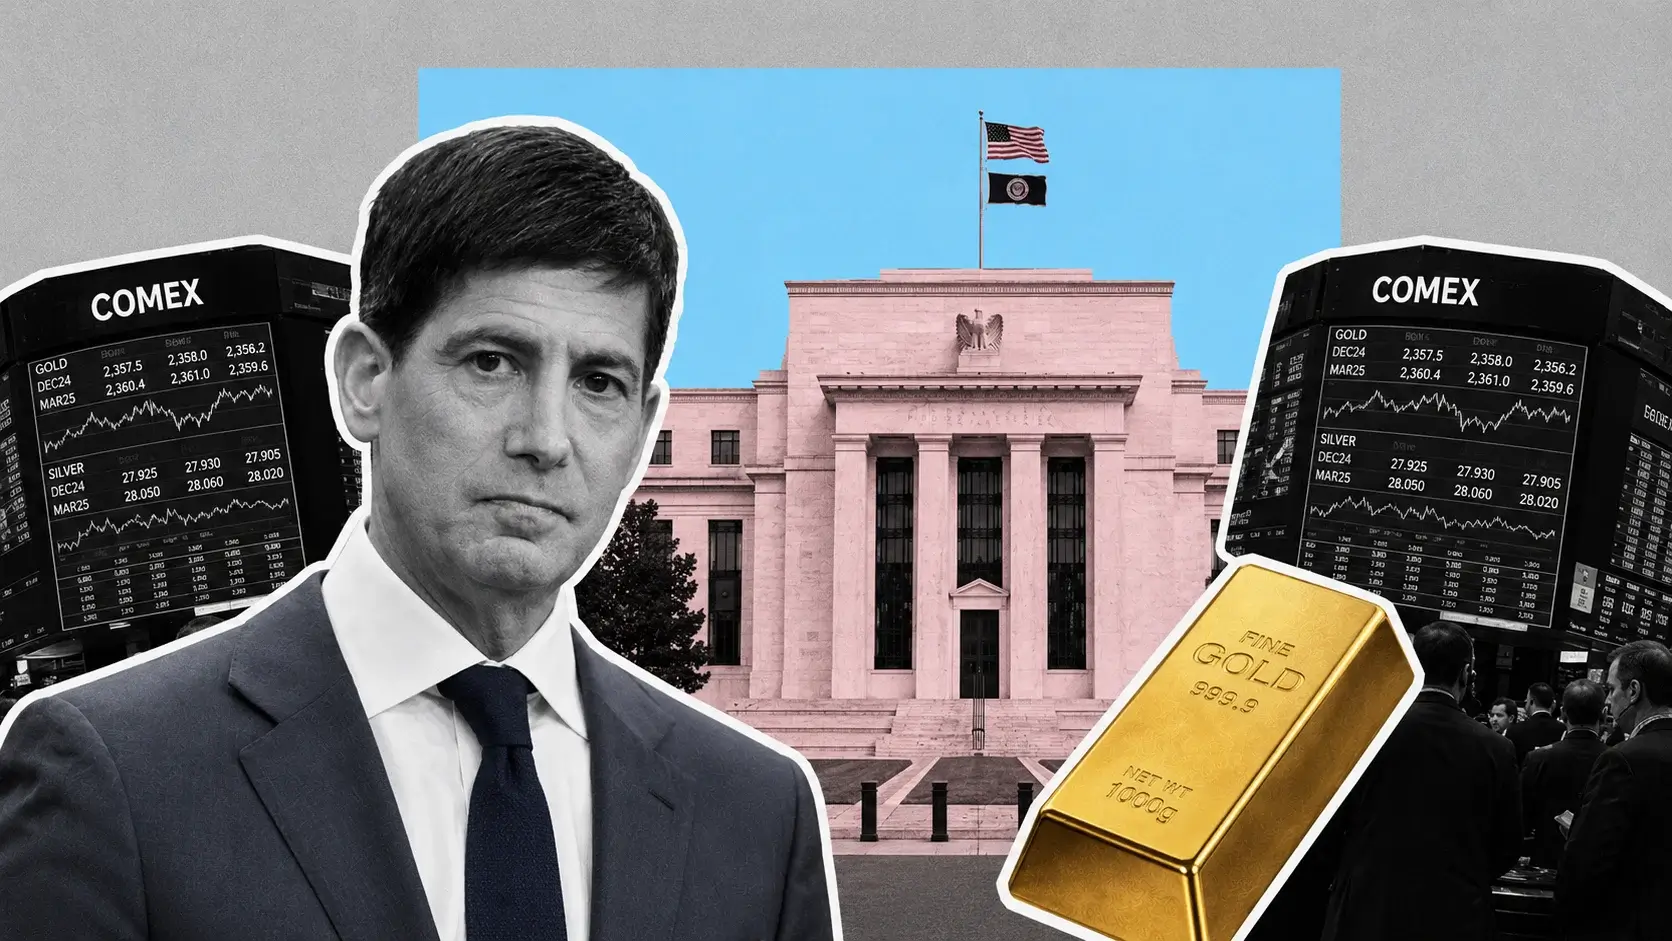
Gold Defends $4,396.70 as Iran Strike Fails to Bid Bullion — Path to $4,696 Runs Through Friday's Payrolls
August delivered gold's best month since January at roughly 10% | That's TradingNEWS
Key Points
- XAU/USD trades at $4,451 after ranging $4,396.70 to $4,472.00, still 20.4% below January's $5,595 record.
- Central banks purchased a record 288.9 tonnes in Q2 while gold fell more than 20%.
- September hike odds jumped to 58% from 35.4%, lifting the 30-year Treasury yield to 5.21%.
Gold spent the final session of August doing something more informative than trending: it broke, then it held. XAU/USD opened at $4,455.02, sank to $4,396.70 in the Asian session — the lowest print since August 19 — spiked to $4,472.00, and settled back near $4,451.48. That is a $75.30 intraday range and a net move of nothing.
The low is the number that matters. Spot slid 0.8% to $4,417.04 by 04:06 GMT with U.S. gold futures down 1.4% to $4,466.80, and the metal traded beneath $4,400 for the first time in nearly two weeks. It did not stay there. By the European session gold had recovered to hold near $4,450, moving clear of sub-$4,400 levels as the dollar eased from Friday's spike.
The damage was done Friday. Spot gold fell 3.19% to $4,454.52 after Federal Reserve Chair Kevin Warsh's Jackson Hole address. Intraday, gold was down only 0.8% at $4,563.05 by 14:52 GMT after touching a one-week low of $4,528.94, then accelerated into the close. December COMEX futures fell 1% to $4,615.10 mid-session and settled at $4,529.90, down $134.10 or 2.88%. Silver got hit harder, dropping 4.3% to $66.28.
Monday's cross-metal tape confirms the rate story rather than a commodity story. Silver slipped 0.4% to $66.10, platinum fell 1.3% to $1,797.03, and palladium dropped 2.5% to $1,386.96 — the industrial-weighted metals losing more than bullion. Indian-listed gold ETFs shed as much as 3.59% and silver ETFs up to 4.06%, sharper declines than the underlying spot moves.
Gold absorbed a live geopolitical escalation on the same session and did not bid. U.S. forces struck Iranian rocket launchers on Larak Island in the Strait of Hormuz on Sunday, Iran fired on U.S. air bases in Jordan, and Brent ripped 3.5% to $91.20. Gold went down.
The thesis for this forecast: gold's 10% August was a rate-path trade dressed up as a debasement trade, and Warsh detonated the rate-path leg on Friday. What held $4,396.70 was the structural bid — central banks buying at a record quarterly pace — which never depended on the Fed. The metal is now caught between a broken tactical case and an intact structural one, and that resolves as a range, not a trend, until Friday's payrolls print.
Warsh Erased Ninety Days of Positioning in Ninety Minutes
The mechanics of Friday's break are worth spelling out because they define the September setup.
Warsh told Jackson Hole that inflation data are more concerning than labor-market trends, that inflation is unlikely to return to target on its own, and that the Fed will have work to do if policymakers are not confident underlying inflation is heading to 2% clearly and at sufficient speed. He cited PCE at 3.7% against the 2% objective. He noted that more than half the goods and services tracked by the government saw price increases of 3% or higher over the past year, against roughly one-third in the two decades before the pandemic. He described financial conditions as not restrictive.
The rate market repriced immediately. September hike odds jumped to 59.7% by late Friday morning from 35.4% Thursday and 39.9% a week earlier, per CME FedWatch. December hike odds moved to 80%. The two-year Treasury yield ripped 11.97 basis points in a single session to 4.352%, its highest since July 24. The dollar index rose 0.4% to 99.57, its largest one-day gain in about two months, and every major currency fell against it.
Gold's reaction function to that combination is arithmetic, not sentiment. A non-yielding asset carries an opportunity cost equal to the real rate available on the alternative. When the front end prices 25 basis points of tightening and the dollar strengthens simultaneously, both legs of that cost rise at once. Independent analyst Tai Wong framed it as the market pricing September as a coin flip.
What Warsh interrupted was specific. Gold had rallied nearly 14% over three weeks to a three-month high of $4,696.18 on August 25, its highest level since May 14, on the back of the Treasury's announcement of support measures for long-duration bonds. That announcement — doubling the maximum size of long-dated buyback operations, with the first at $4 billion or larger scheduled for September 9 — compressed long-end yields and was read as financial repression. Gold is the cleanest expression of financial repression there is.
Warsh did not destroy that thesis. He reminded the market of its other side. Higher expected policy rates lift gold's opportunity cost, strengthen the dollar, and remove the liquidity assumption underneath the trade. Both things can be true, which is exactly why gold is ranging rather than collapsing.
August Still Books Roughly 10%, the Best Month Since January
Strip out the last two sessions and August was gold's strongest month of 2026.
The metal entered the month near $4,000 and closes it near $4,451, a gain of roughly 10% and the largest monthly advance since January. One trailing measure had the 30-day change at 11.79% as of August 28. Gold outperformed the Nasdaq's 4% and trailed only Bitcoin's 23% among major assets.
The catalyst sequence was macro, not metal-specific. Three data prints in one week flipped the September rate calculus in gold's favor: jobs, CPI, and PPI all came in soft, and hike odds fell from 50% to 31%. July nonfarm payrolls fell 23,000 against an +83,000 consensus. July CPI printed 3.4% year over year. July PPI came in flat. Gold cracked $4,400 on August 11 and posted its best week since January, while gold mining stocks logged their hottest five-day run since 2008.
Then the Treasury buyback expansion landed on August 19 and gold extended to $4,696.18 by the 25th. Five consecutive up weeks.
The sixth week broke the streak. Last week closed lower, with the December contract settling at $4,504 before Friday's slide took the spot price back under $4,460. Gold gave back roughly 5% from the August 25 high in four sessions.
The year-to-date picture explains why a 10% month feels underwhelming. XAU/USD is up 5.48% in 2026 and 34.97% over twelve months. Those two numbers describe the shape of the year: an enormous run into January, a violent unwind, and a partial recovery that has not restored the January level. Gold has been one of the most volatile major assets of 2026, and the direction of that volatility has flipped three times.
For the forecast, the relevant read is that August's gain came from rate-path repricing rather than from any change in physical demand, central bank behavior, or geopolitical premium. Rate-path gains are the least durable kind, because a single speech can reverse them — which is precisely what happened on Friday.
Gold Is Still 20.5% Below Its January Record of $5,595
The most important context for any bullish gold call right now: this is a recovery inside a drawdown, not a breakout.
Spot gold set its all-time high at $5,595.46 on January 29, 2026, with intraday prints reaching $5,602.23. At $4,451.48 the metal sits $1,143.98 and 20.4% below that peak. The 52-week range runs $3,436.80 to $5,595.46 — a band of more than 62% from low to high in twelve months.
The collapse was fast. Gold fell more than 20% in the second quarter, its worst quarter since 2013, and by late July was trading near $4,020, down 28% from the January record. Roughly 298 tonnes of ETF gold sat underwater near the $4,000 level. That is the base August rallied from.
The mechanism behind both the spike and the crash was the same variable running in reverse. January's record was driven by war premium as the Iran conflict escalated, with gold functioning as the pure fear asset while Brent pushed above $114 in March. As the conflict shifted from a physical-supply crisis toward a sanctions confrontation, that premium bled out. What replaced it was a rate story — first hike fear, which crushed gold in Q2, then hike relief, which lifted it in August.
The technical implication is that gold has no established support structure between here and the low $4,000s, because the entire descent from $5,595 to $4,020 happened in a single directional move without meaningful consolidation. Levels built on the way down are weak levels.
What that means for a $5,000 target: gold needs to travel 12.3% from current spot to reach $5,000 and 25.7% to reclaim the January high. State Street assigns a 30% probability to $5,000 in 2026 with a base case of consolidation in the $4,000–$4,500 band. Morgan Stanley pushes $5,000-plus out to 2027. Neither view has gold reclaiming its record this year.
The Real-Yield Math at a 4.70% Ten-Year and a 5.21% Long Bond
Gold competes with Treasuries, and the Treasury curve is currently offering the best nominal compensation in years.
Friday's closing yields: 3-month bills at 3.83%, one-year at 4.13%, two-year at 4.36%, five-year at 4.49%, ten-year at 4.72%, thirty-year at 5.21%. Monday brought marginal relief with the two-year easing two basis points to 4.32% and the ten-year near 4.70%. The 10s2s spread stands at +44 basis points, 10s3m at +88 basis points.
Against PCE at 3.7%, the real ten-year yield sits near 1.0% and the real thirty-year near 1.5%. Both are positive and both have been rising. That is the single cleanest bearish argument against gold, and it is the argument Warsh strengthened.
The counterargument is where this gets interesting, and it comes from the curve's shape rather than its level. Friday produced a textbook bear flattener: the two-year ripped nearly twelve basis points while the thirty-year held flat at 5.19% and the ten-year rose less than four. Traders are pricing near-term tightening and betting it works — that a hike anchors long-end inflation compensation rather than signaling a prolonged tightening cycle.
Robin Brooks, senior fellow at the Brookings Institution and former IIF chief economist, argued explicitly that a September hike would be aimed at calming Treasury-market jitters and avoiding a repeat of the bond selloff after July 29, reducing the term premium on long-dated debt rather than delivering genuine tightening. Under that framing the hike is performative, keeps financial conditions loose, and the debasement trade continues working.
ANZ took a similar line, expecting downside in gold to remain limited because the debasement trade continues to attract buyers even as rate-hike expectations rise.
The distinction determines the September range. If the market treats a hike as real tightening, gold trades toward $4,200. If it treats the hike as term-premium management inside a fiscal environment where the national debt just crossed $40 trillion and Treasury is actively suppressing long yields, gold holds $4,400 and works back toward $4,696.
The thirty-year at 5.21% is the scoreboard. Gold is trading that number, not the fed funds print.
Silver at $66.10 Underperformed, and That Is the Signature
The relative move between the two metals identifies exactly what kind of selloff this is.
Silver fell 4.3% on Friday against gold's 3.19%, closing near $66.28. Monday extended the decline by another 0.4% to $66.10. Platinum dropped 1.3% to $1,797.03 and palladium 2.5% to $1,386.96 — the most industrially exposed metal taking the largest hit.
Silver underperforming gold on a rate shock is the standard pattern and it happens for a structural reason. Silver carries dual identity: monetary metal and industrial input. When the driver is a rate repricing rather than a growth scare, silver gets sold on both legs — the monetary leg because higher real rates raise carry cost, and the industrial leg because tighter policy implies weaker manufacturing demand. Gold only gets sold on one.
The Chicago Business Barometer collapsing 10.5 points to 47.1 in August — the first contraction reading in four months and the biggest monthly drop since the COVID period, with prices paid accelerating — gives the industrial leg real teeth. A contracting manufacturing print alongside a hawkish central bank is the worst combination silver can face.
The gold-silver ratio at these levels sits near 67, which is historically compressed rather than stretched. Silver's enormous 2026 run has already closed most of the gap that existed at the start of the year, which removes the mean-reversion argument that normally supports silver during precious-metals drawdowns. India's earlier restrictions on silver imports added a demand-side complication that has not fully cleared.
For gold specifically, silver's larger decline is mildly constructive. It says the selling is concentrated in the leveraged, higher-beta expression of the trade rather than in core bullion holdings. Positioning washing out of silver faster than gold is what a tactical unwind looks like, not what a structural exit looks like.
Watch the ratio into the payrolls print. Silver outperforming on a weak jobs number would confirm the market reading it as rate relief. Silver underperforming again on a weak number would signal growth fear, which is a different and more bearish regime for both metals.
Central Banks Bought a Record 288.9 Tonnes in Q2 While Retail Sold
The structural bid underneath gold has nothing to do with the Fed, and it accelerated during the exact period retail investors were dumping.
Central banks purchased a quarterly record 288.9 tonnes in the second quarter of 2026 — while gold was falling more than 20% and posting its worst quarter since 2013. Total first-half official-sector purchases reached 345 tonnes, lower than the prior year's first-half pace because of Q1 weakness, but the Q2 acceleration was sharp and it happened at prices between $4,000 and $4,500.
That asymmetry is the floor argument. Sovereign accumulation at lower prices while individual investors exit describes a transfer of ownership from weak hands to hands that do not mark to market and do not sell on a Jackson Hole speech.
The forward intention data supports continuation. The World Gold Council's 2026 reserve manager survey covered 76 institutions. Eighty-nine percent expected global central bank gold holdings to increase over the next twelve months. Forty-five percent expected their own institution to add — a record share.
Those are stated intentions rather than executed purchases, and that distinction matters. Survey intent has historically overstated realized buying, particularly during periods of high price volatility when reserve managers become price-sensitive. But the direction of intent has not wavered across three consecutive annual surveys.
The driver is not tactical. Central banks buy gold for reserve diversification, sanctions exposure management, and the ability to mobilize assets under stress. None of those calculations changes because the September FOMC hikes 25 basis points. The variables that would change them are dollar reserve concentration, sanctions precedent, and fiscal credibility — and the U.S. national debt crossing $40 trillion pushes all three the same direction.
What official-sector demand cannot do is drive price higher on its own. It absorbs supply and sets a floor. The 288.9 tonnes in Q2 did not stop gold falling 20% that quarter. It is the reason gold bottomed near $4,000 instead of $3,500.
ETF Flows Reversed 93 Tonnes of Outflows and Then Stalled
The investment-demand recovery that powered August is real, recent, and thin.
Morgan Stanley data shows gold ETFs recorded approximately 70 metric tonnes of net inflows across July and August, reversing 93 tonnes of outflows registered in May and June. Globally, gold ETFs attracted $3 billion in July, lifting holdings 23 tonnes to 4,068 tonnes and ending two consecutive months of withdrawals. SPDR Gold Trust alone took in roughly $637 million on August 7.
The recovery followed genuine carnage. June saw about $8.9 billion in outflows and a 74-tonne holdings decline. The second quarter registered 45 tonnes of net outflows, concentrated almost entirely in North American funds. U.S.-listed gold funds recorded roughly $5.3 billion in monthly redemptions at the worst of it, and rolling 90-day flows swung from nearly $30 billion in February to negative territory. First-half net inflows still totaled about $8 billion globally with holdings 18 tonnes above the start of the year at 4,047 tonnes — the regional split hid the damage.
North America remains the problem. Even during July's $3 billion global inflow, North American funds drew just $71 million. The region that sets the marginal price is the region that has not come back.
Monday's tape suggests the July–August reversal has stalled rather than compounded. Gold ETFs shed as much as 3.59% in value and silver ETFs up to 4.06% as rate-hike bets firmed, with the selling in precious-metals vehicles running sharper than the broader equity decline.
The flow sensitivity is the whole story. Gold ETF holdings respond to changes in the opportunity cost of holding a non-yielding asset with almost no lag. The July–August inflows coincided precisely with market-implied probabilities of additional Fed hikes falling. Those probabilities have now gone the other way, from 35.4% to 58% in two sessions.
Expect the September flow data to turn negative unless Friday's payrolls print pushes hike odds back below 40%. That is the cleanest leading indicator available for the next $200 of gold's range.
Read More
-
Yen Stalls at 160 Despite a 3% JGB and Tokyo Core CPI at 2.0% — Intervention Sits at 164, Friday's Payrolls Decide
02.09.2026 · TradingNEWS ArchiveEnergy
-
QQQ ETF ($706.22) Slides 7.4% Below Its High as the Market Reprices the AI Capex Bill — $686.57 Target if $700 Breaks
22.10.2026 · TradingNEWS ArchiveStocks
-
XRPI ($7.00) and XRPR ($10.74) Slide Toward 52-Week Lows as Spot XRP ETF Flows Stall at $708,510
22.10.2026 · TradingNEWS ArchiveCrypto
-
NG ($2.775) Decoupled From Europe’s €88 Gas Crisis as LNG Feedgas Hits 18.9 Bcf/d — $3.30 Upside on Cold Weather
22.10.2026 · TradingNEWS ArchiveCommodities
-
Dollar-Yen (157.35) Loses 157.65 as the Yen Rallies on Haven Demand — 155 Target if 156 Breaks
22.10.2026 · TradingNEWS ArchiveForex
Miners Ran 40% in a Month and GDX Is Still 22% Below Its Peak
The equity expression of the gold trade delivered the operational leverage investors expect, and it is still nowhere near recovered.
The VanEck Gold Miners ETF gained 40.26% over the month through late August and 18.63% in a single week during the run. It rose 21.09% over one five-day stretch to $89.73, with the Junior Gold Miners ETF climbing 22.42% to $116.78. Agnico Eagle advanced 22.92% to C$250.17 in Toronto, Newmont 20.55% to $112.97 in New York, and Barrick Mining 19.22% to C$61.34. That week was the sector's hottest five-day run since 2008.
GDX closed Friday at $100.48 after trading a $100.31 to $104.74 range, finishing 4.1% below the session peak on volume of 15.07 million against a 25.57 million average. It fell 2.7% on the day. The 52-week range runs $60.70 to $117.18, leaving the fund 14.2% below its high even after the August surge and roughly 22% off its peak at the point measured in late August.
The composition explains both the leverage and its limits. Newmont carries 10.37% of the fund, Agnico Eagle 10.12%, Barrick 6.01%, and the top ten positions account for 56.30% of assets. Fees run 0.51% and the fund carries a beta of 0.67 against the broad market.
The leverage disappointment is structural. Miners are supposed to amplify bullion moves roughly two-to-one because incremental ounces flow straight to margin. GDX is up 23.03% year to date against gold's 5.48% — that ratio works. But the major producers carry mature production profiles, dividend commitments, and hedging programs that dilute pass-through, which is why the fund trades at a P/E near 16 rather than compressing as earnings catch up.
The risk case is specific and it arrived Monday. A pullback to $4,000 gold alongside WTI above $95 would erase the margin expansion story entirely, because diesel and energy inputs are a direct AISC line item. Brent at $91.20 and WTI at $86.30 after the Larak Island strike moves that scenario from hypothetical toward live.
Newmont's $4,414 Realized Price Against $1,621 All-In Costs
The producer economics are the most durable bullish datapoint in the entire gold complex, and they are not being priced.
Newmont's second quarter delivered a realized gold price of $4,414 per ounce against byproduct all-in sustaining costs of $1,621 — a gross margin of $2,793 per ounce. That produced a 33% year-over-year increase in realized price and a record $2.2 billion in quarterly free cash flow, with AISC comfortably inside full-year guidance.
Agnico Eagle generated $1.3 billion in second-quarter free cash flow at $1,459 AISC, also within full-year guidance. Two of the three largest GDX components printed record or near-record cash generation in the same quarter gold fell more than 20%.
That last point deserves weight. The margin structure is so wide that a 20% drawdown in the metal does not threaten profitability — it compresses an enormous spread into a merely large one. At $4,451 spot, Newmont's implied margin is roughly $2,830 per ounce. At $4,000 gold it would be $2,379. At $3,500 it would be $1,879, still more than the entire cost base.
The industry has not seen margins like this in any prior cycle, and the reason it has not translated into proportional equity performance is capital allocation. Major producers are reinvesting, repurchasing shares, and paying dividends rather than aggressively compounding reserves, which caps the earnings-multiple expansion that normally accompanies a bullion run.
For a gold price forecast, producer economics matter through supply. Margins this wide incentivize maximum production and discourage the mine closures that historically tighten supply into bear markets. Mine supply stays elevated, which caps the upside from any physical squeeze.
They also identify where the pain threshold sits. Sector-wide AISC in the $1,500 to $1,700 range means no meaningful production comes offline until gold approaches $2,500 — roughly 44% below current spot. There is no supply-side floor anywhere near current prices. The floor is entirely demand-side, and it is central banks.
The Level Map: $4,396.70, $4,472, $4,696.18
The technical picture broke on Friday and has spent Monday testing whether the break holds.
Two structural failures occurred simultaneously. Gold closed below the 100-period simple moving average on the four-hour chart for the first time since early August, and it dropped beneath the 38.2% Fibonacci retracement of the entire rally from the late-July lows. Either alone is a caution flag. Together they validate a near-term negative bias.
Immediate support is Monday's $4,396.70 low, which coincides with the psychological $4,400 handle and the August 19 low. That level was tested and rejected within one session, which makes it the first real reference point built since the August advance began. Below it, the next structural zone sits at $4,312, then $4,250. A break of $4,250 opens the late-July base near $4,020.
Resistance stacks tightly overhead. Monday's high at $4,472.00 is the immediate ceiling. Above that, $4,504 marks last week's December-contract settlement and $4,528.94 was Friday's intraday low — a level that flips to resistance on the way back up. The August 25 high of $4,696.18, the strongest print since May 14, defines the level that would confirm the August uptrend survived Warsh. Above $4,700, the next reference is $4,777 and then $4,830.
The critical observation for the session: gold traded $4,396.70 to $4,472.00 and closed near the midpoint at $4,451.48. A full round trip with no directional resolution on a day carrying both a hawkish Fed repricing and an active Middle East escalation is the market telling you it has no conviction below $4,400 and no conviction above $4,500.
The 38.2% retracement break is the level to watch reclaim. Recovering it converts the current move from a failed breakout back into a consolidation inside an uptrend, and it sits close enough to $4,500 that Friday's payrolls print could do it in a single session.
Range call into September 4: $4,396 to $4,504, with a breakout in either direction dependent on the labor data rather than on anything technical.
Why the Iran Strike Did Not Bid Gold
Gold failed to catch a safe-haven bid on a day U.S. forces struck Iranian territory and Iran fired ballistic missiles at U.S. air bases in Jordan. That failure is the most diagnostically useful event of the session.
The escalation was real. U.S. forces hit two rocket launchers on Larak Island in the Strait of Hormuz on Sunday, the first publicly confirmed strike on Iran since late July, with Central Command stating the launchers were preparing to lay mines in the strait. Brent gained 3.5% to $91.20 and WTI 3.5% to $86.30. Treasury Secretary Scott Bessent said new secondary sanctions on Iran would roll out weekly. S&P 500 futures fell 0.2%.
Gold went to a two-week low anyway.
Two explanations, and both are bearish for the geopolitical-premium argument. First, the market has been trading this conflict for six months and has repriced it from existential supply threat to sanctions confrontation. Persian Gulf exports had recovered to 15–16 million barrels per day against pre-conflict volumes of 22–24 million and a March trough near 5–6 million. Roughly 6 to 8 million barrels transit Hormuz daily. Incremental strikes inside an ongoing conflict do not generate new premium.
Second, and more important, higher oil is now inflationary rather than risk-off for gold's purposes. Brent at $91.20 feeds directly into headline CPI, which strengthens Warsh's case for a September hike, which raises gold's opportunity cost. The University of Michigan survey explicitly cited the Iran conflict as fueling expectations of further gasoline price increases, with year-ahead inflation expectations at 4.0% and five-to-ten-year expectations pinned at 3.3% for a third consecutive month.
That inverts gold's traditional relationship with Middle East conflict. In January, war escalation drove gold to $5,595 because the Fed was expected to ease into the shock. In August 2026, war escalation drives oil, oil drives inflation expectations, inflation expectations drive hike odds, and hike odds drive gold down.
Until the Fed's reaction function changes, geopolitical escalation is a gold negative. That is a genuine regime shift and most positioning has not adjusted to it.
Bank Targets Run From $4,300 to $6,300 and the Spread Is the Signal
Sell-side dispersion on gold is currently the widest of any major asset, which tells you the institutional community has no consensus on the regime.
Goldman Sachs cut its year-end target to $4,900 in June from $5,400 and pushed its first-rate-cut expectation from 2026 into 2027. JPMorgan moved to a third-quarter average of $4,300 and a fourth-quarter target of $4,500, down from a prior path that had targeted $6,000. Deutsche Bank reiterated $4,600 for year-end on August 3. HSBC cut its 2026 annual average to $4,560 on July 9 while maintaining $4,750 for year-end. Morgan Stanley sees gold above $5,000 in 2027, citing measurable ETF inflows, central bank accumulation, and a decoupling from long-term real yields.
State Street frames it as probability rather than point estimate: base case consolidation at $4,000–$4,500 for 2026, with a 30% chance of $5,000. That scenario requires central bank and Chinese retail demand steady versus 2025 and ETF flows running at 75%–100% of the 2025 pace. Current ETF flows are tracking 25%–75% of that pace.
The published range across major desks spans roughly $4,000 to $6,300 for year-end, with the most bullish cluster at $6,000–$6,300. At $4,451, the bullish cluster implies 35% to 42% upside and would require gold to exceed its January record by 7% to 13%. The bearish end implies a 10% decline.
Most of the summer's cuts were about magnitude rather than direction — institutions trimming average-price forecasts while keeping year-end targets above spot. That pattern usually means desks are unwilling to abandon a structural call they cannot currently justify with the rate path.
The honest read: the median target sits near $4,600 to $4,750, roughly 3% to 7% above current spot. That is a forecast community expecting gold to grind, not to run. Nobody with a $6,000 target has published a mechanism for getting there that does not require the Fed to cut.
The Week That Sets September: ISM, JOLTS, ADP, and Payrolls
Four labor and manufacturing prints decide whether gold holds $4,400.
ISM Manufacturing PMI and July JOLTS job openings land Tuesday, September 1. ADP private payrolls and July factory orders print Wednesday, September 2, alongside Bank of Canada and Reserve Bank of New Zealand decisions. Challenger layoffs, weekly jobless claims and ISM Services arrive Thursday, September 3, with Fed Governor Waller speaking. The August employment report closes the week Friday, September 4. CPI does not print until September 11. The FOMC decides September 16.
The labor backdrop is deteriorating and that is gold's best hope. July nonfarm payrolls fell 23,000 against an +83,000 consensus, with government down 53,000 and private up 30,000. May and June were revised down by a combined 103,000. The unemployment rate ticked to 4.1% only because the labor force contracted 264,000, and participation fell to 61.4%, the lowest outside the COVID era since the mid-1970s. Average hourly earnings grew 3.2% year over year, the slowest since May 2021. The preliminary benchmark revision came in at -79,000, with retail trade cut 154,600.
Capital Economics forecasts +90,000 for August with unemployment unchanged at 4.2%.
The manufacturing side already broke. Chicago's barometer at 47.1 with prices paid accelerating is the stagflation print, and ISM Manufacturing on Tuesday will either confirm or contradict it. Consumer sentiment fell to 51.7, down 6.3% from July and roughly 11% below year-ago levels.
Scenario map for gold. A payrolls print below 40,000, or another outright decline, pushes September hike odds below 40% and sends gold back through $4,504 toward $4,696. A print between 60,000 and 110,000 with wages contained leaves odds near 55% and keeps gold ranging $4,400–$4,550. A print above 130,000 with hourly earnings accelerating pushes odds past 70% and breaks $4,396.70, opening $4,312.
Then September 9: Treasury's first doubled long-dated buyback operation at $4 billion or larger. That is the mechanism that produced August's rally.
Gold Price Forecast: $4,312 Downside, $4,696 Upside, Range-Bound Above $4,396
Gold at $4,451.48 sits in the least resolvable position on its chart. The tactical thesis that drove a 10% August is broken. The structural thesis that stopped the metal at $4,396.70 is intact. Neither is winning.
The bear case is four points. September hike odds moved from 35.4% to 58% in two sessions and December sits at 80%. The thirty-year at 5.21% and ten-year near 4.70% put real yields near 1.0% against PCE at 3.7% — the highest opportunity cost gold has faced this cycle. Friday broke the 100-period four-hour SMA for the first time since early August and took out the 38.2% retracement of the entire late-July rally. And the regime has inverted: Brent at $91.20 on an Iran escalation is now a gold negative because it feeds hike odds rather than fear premium.
The bull case is five. Central banks bought a record 288.9 tonnes in Q2 while price fell 20%, with 345 tonnes in the first half and 89% of 76 surveyed reserve managers expecting global official holdings to rise. ETFs reversed 93 tonnes of May–June outflows with roughly 70 tonnes across July and August. A September hike framed as term-premium management — anchoring the ten-year, keeping conditions loose — leaves the debasement trade working, which is the explicit view from Brookings and from ANZ. The labor market is deteriorating fast enough that Friday could reprice the whole thing. And Treasury's $4 billion-plus buyback lands September 9.
The verdict is range-bound with a mild downside skew while gold trades under $4,504. Base case for September: $4,312 to $4,696 with a midpoint near $4,480. Upside target on a daily close above $4,504 is $4,696.18, then $4,777. A close above $4,777 puts $4,830 and the $5,000 handle in scope, and that path requires hike odds under 30%. Downside target on a daily close below $4,396.70 is $4,312, then $4,250. Structural invalidation of the August recovery is a close below $4,020.
Trade the payrolls print, not the narrative. August's 10% came from three data releases. September's move comes from four more.





