


Gold Price Forecast - XAU/USD at $5,097 — 92K Jobs Lost, ICBC Bars and the $5,153 Resistance That Unlocks $5,426
Down 3% on the week as margin calls overwhelm safe-haven demand, Fed rate cut probability collapses to 35%, 10-year Treasury yields surge from 3.93% to 4.15% in four days | That's TradingNEWS
Gold (XAU/USD) at $5,097 — Down 3% on the Week Despite a Raging Iran War, $5,278 Surge Then Reversal, February NFP Loses 92,000 Jobs, and the $5,153 Level That Decides the Next Move
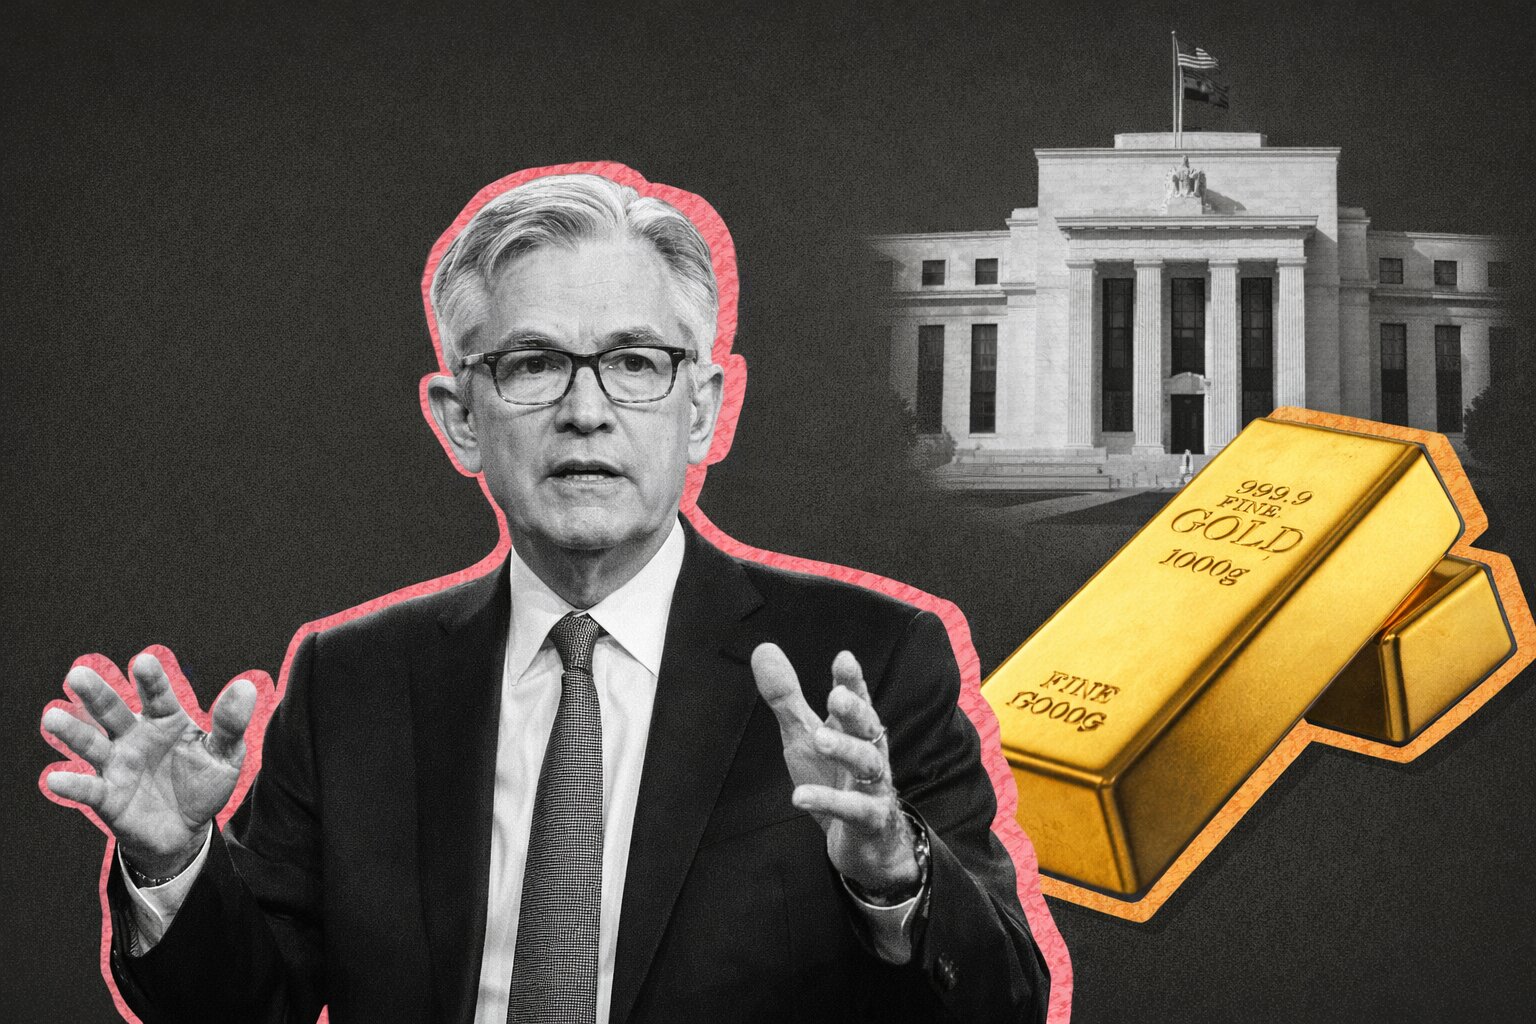
Gold (XAU/USD) is trading at $5,097 per ounce on March 6, 2026 — down $26 from yesterday's $5,123, down 3% for the week, and on pace to snap a four-week winning streak. That weekly decline against the backdrop of an active U.S.-Iran war, Brent crude above $91, and a labor market shedding 92,000 jobs is not a failure of the safe-haven thesis — it is a cash-raising dynamic that has nothing to do with gold's fundamental value. One year ago gold traded at $2,909. The 75.21% gain to $5,097 is the number that explains why institutional desks are selling it: it is one of the few assets they own at a meaningful profit during a week where margin calls are firing across equity and energy portfolios simultaneously. BullionVault researcher Adrian Ash made the mechanism explicit — this is "classic crisis trading: investors cutting risk, selling whatever they can for cash and covering margin calls elsewhere."
The $5,278 Spike and Why It Reversed — Geopolitical Surge, Rate Cut Probability Collapse
On February 27, spot gold hovered near $5,180 before surging late session to close above $5,278 — the day U.S. and Israeli airstrikes hit Iran. The following session opened 2.2% higher at $5,393. Chinese jewelry retailers immediately raised prices above CNY1,600 ($233) per gram, a CNY30 jump overnight. Laopu Gold changed its pricing for the first time in 2026, raising gold product prices between 20% and 30% in a single day. All "Ruyi" investment-grade gold bars produced by Industrial and Commercial Bank of China sold out. The safe-haven bid was real, immediate, and institutional.
What reversed it was equally mechanical. The CME FedWatch tool now shows 69% probability the Fed holds rates at June — up from 43% just one week ago before the conflict began. Rate cuts and gold prices move in the same direction. A Fed that cannot cut because oil-driven inflation is running simultaneously with job losses traps gold in a stagflationary crossfire: the macro environment that creates maximum safe-haven demand is simultaneously the one that eliminates the monetary easing that would otherwise send gold to new highs. 10-year Treasury yields climbed from 3.93% to 4.15% in four days. Higher real yields are gold's most direct structural headwind — every basis point increase raises the opportunity cost of holding a non-yielding asset.
Read More
-
FDVV Slips Near $60 as the "High Dividend" ETF's Hidden Tech Top — NVIDIA, Apple, Microsoft — Gets Caught in the AI Air Pocket
26.06.2026 · TradingNEWS ArchiveStocks
-
IBIT Drives Bitcoin ETF Flows Negative for 2026 as $7.2B Exits Across Two Record Streaks — But On-Chain Data Says Cyclical, Not Structural
26.06.2026 · TradingNEWS ArchiveCrypto
-
Natural Gas Holds $3.30 on Expiry Day as Next Week's Heat Wave Overpowers a Bearish Storage Print and Record Production
26.06.2026 · TradingNEWS ArchiveCommodities
-
Dollar-Yen Grinds to 40-Year Highs Near ¥161.70 as the Warsh Fed Keeps the Rate Gap Wide and Tokyo's Intervention Threat Loses Its Bite
26.06.2026 · TradingNEWS ArchiveForex
February NFP -92,000 — The Labor Data That Reopens the Rate Cut Debate
The Bureau of Labor Statistics confirmed February nonfarm payrolls fell 92,000 — dramatically worse than the 58,000 consensus. Unemployment rose to 4.4%. December was revised to show a loss of 17,000 jobs versus the previous estimate of a gain of 65,000. The three-month job creation average is now 6,000. The six-month average is negative for the fourth time in five months. Average hourly wages grew 0.4% to $37.32 — beating the 0.3% forecast — and are up 3.8% year-over-year. That wage growth figure is the inflation component that keeps the Fed cautious despite collapsing payrolls.
LPL Financial Chief Economist Jeffrey Roach stated the labor market has come to a standstill and said he does not expect Fed action before June — but flagged that faster-than-expected deterioration could push a cut to April 29. Gold jumped back above $5,100 immediately on the NFP release, with spot gold trading at $5,128.50 per ounce, up nearly 1% on the day. The labor weakness is the bullish gold catalyst the war could not provide on its own — it reopens the rate cut probability that the conflict temporarily closed.
China's Physical Demand Surge — ICBC Bars Sold Out, Banks Tighten Risk Controls
The physical gold demand response in China was immediate and structural. Investment-grade gold bars sold out across major state-owned lenders including ICBC. China Merchants Bank reclassified personal gold accounts to R3 medium-risk status, requiring individual clients to complete risk-tolerance assessments before opening accounts. China Zheshang Bank warned it may temporarily suspend its Wealth Gold Accumulation product if "sharp and abnormal price swings" and "severe liquidity shortages" continue. These are not precautionary bureaucratic notices — they are real-time risk management responses to a physical market where supply has tightened faster than institutions can manage client demand.
When Chinese state banks run out of investment-grade bullion and simultaneously warn clients about risk, the underlying demand signal is unambiguous. China's gold accumulation behavior — both retail and institutional — has been one of the primary structural drivers of the 75% year-over-year price appreciation, and the Iran conflict has compressed months of incremental demand into days.
Technical Structure — Morning Star at $5,052, $5,153 the Critical Line, $5,673 on Breakout
The 4-hour chart is forming a Morning Star candlestick pattern between $5,052.87 and $5,107.72 — a three-candle reversal formation indicating increased buying pressure from the $5,052 support level. MACD is rising in positive territory approaching the zero line. RSI holds near 44 with a bullish divergence forming — the indicator making higher lows while price made lower lows, a signal that selling momentum is exhausting. The Money Flow Index is moving sideways in the lower range, confirming low liquidity rather than active distribution.
The bearish case: VWAP and SMA20 both sit above current market price, confirming selling pressure remains dominant in the near term. The first resistance to clear is $5,153.72. A confirmed breakout above that level with volume opens $5,208.41, $5,266.41, $5,320.89, $5,370.11, $5,426.67, and ultimately $5,490.37 in sequence. The weekly forecast range is $4,881.57 to $5,426.67 with an average of $5,154.12 — the average price sits exactly at the first resistance level, which is not coincidence. The 30-day forecast extends the high end to $8,356 with a monthly average of $6,558 — projections that reflect the full escalation scenario where the Strait of Hormuz closes for weeks and oil reaches $150.
For the short trade: a confirmed break below $5,107.72 on volume targets $5,052.87, $4,996.26, and $4,937.88 in sequence. Stop for both long and short scenarios sits at $5,128.94 — the technical midpoint of the current consolidation range.
Key upcoming catalysts: March 11 U.S. CPI for February, March 13 GDP second estimate for Q4 and full year 2025 plus University of Michigan 5-year inflation expectations, March 18 PPI and Fed rate decision. The March 18 Fed meeting is the single most important date for Gold (XAU/USD) in the next three weeks — a hold with hawkish language caps the rally, a hold with dovish forward guidance is the breakout catalyst.
XAU/USD is a buy above $5,153.72 targeting $5,266 then $5,426, with a stop at $5,107. The combination of 75% year-over-year appreciation proving fundamental demand is real, physical supply in China already sold out, February NFP at -92,000 reopening the rate cut debate, and the Iran conflict showing zero signs of de-escalation with Defense Secretary Hegseth warning operations could last three to eight weeks creates a structural bull case that a single week of profit-taking does not invalidate. The weekly loss is a buying opportunity, not a trend reversal — but $5,153 needs to break clean before adding size.


