


Gold Price Forecast: XAU/USD Crashes to $5,050 as Dollar Surges and Rate-Cut Hopes Collapse — Is $5,000 the Floor?
Gold is down 4.7% in a week and 2.5% Monday alone — the dollar at a 3-month high, 10-year yields climbing to 4.17% | That's TradingNEWS
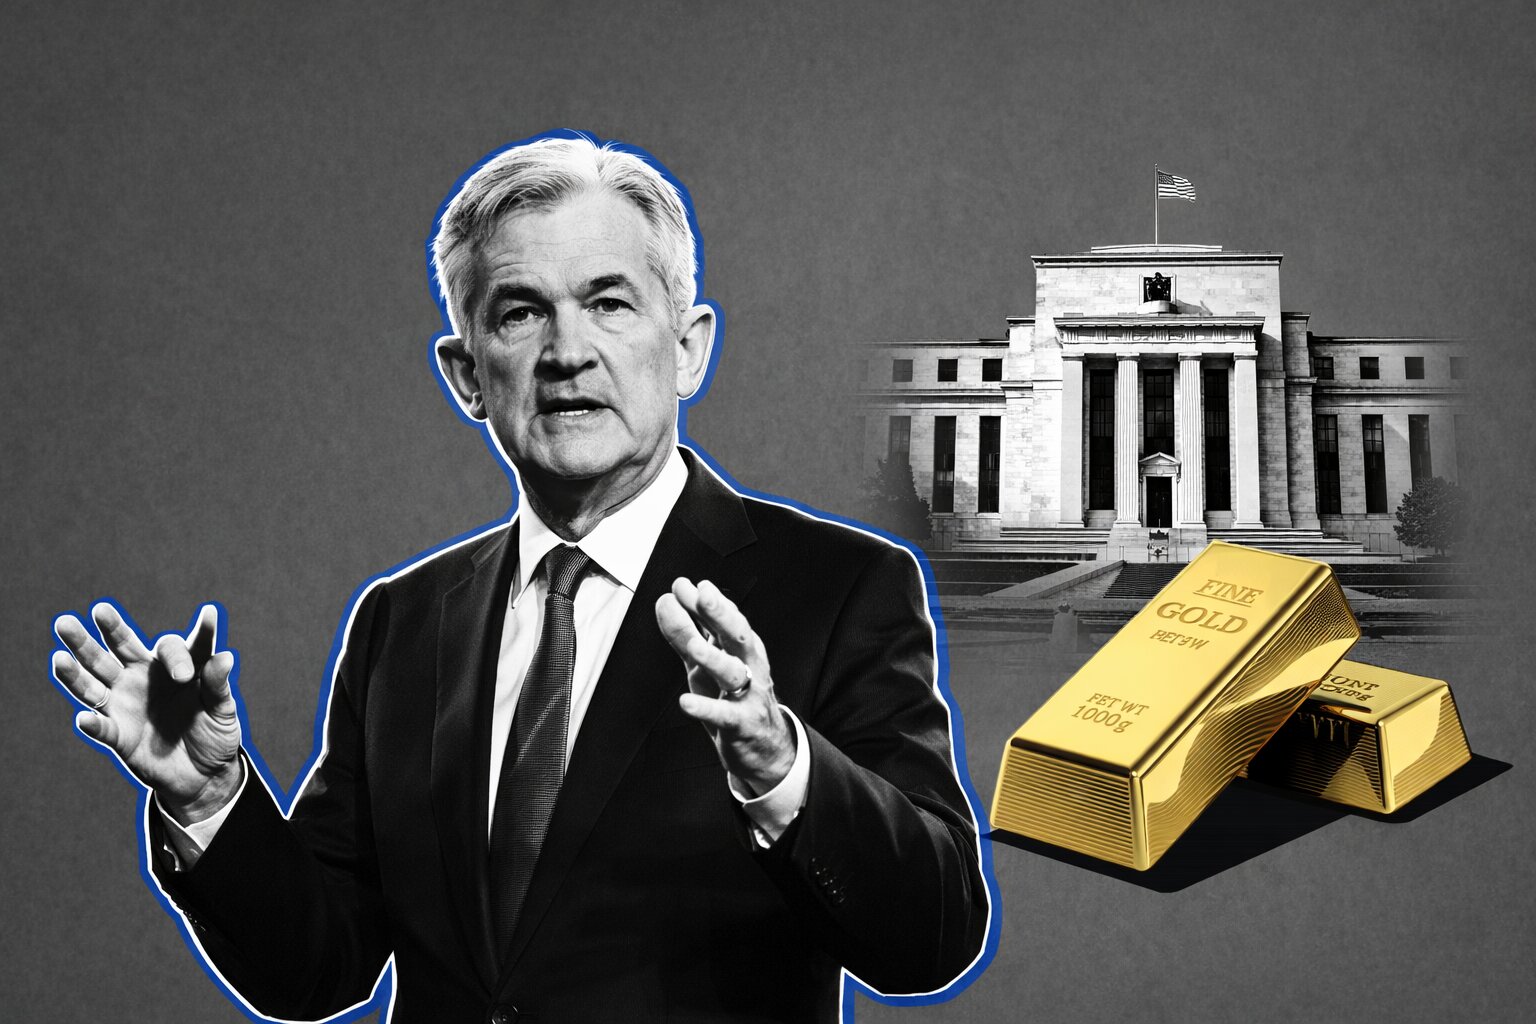
Gold (XAU/USD) Drops 2.5% to $5,050 — The Metal That Should Be Rallying Is Getting Liquidated
Gold is doing something that defies the surface-level explanation. A war is actively burning in the Middle East. Oil hit $119 a barrel. The VIX surged to 35.3. Global equities lost $6 trillion in ten days. Every textbook safe-haven trigger is firing simultaneously — and gold (GC=F) fell more than 2% Monday, with spot XAU/USD hitting as low as $5,050 per ounce before partially recovering to approximately $5,080 to $5,097. April gold futures opened at $5,095, down 1.2% from Friday's close of $5,158.70. The one-week loss stands at 4.7%. This is not a modest pullback. This is the metal getting sold in the middle of what should be its moment — and understanding exactly why that is happening is the most important analytical question in commodities right now.
XAU/USD Has Gained 75.6% in One Year — And Is Now Facing Its Sharpest Headwind
To understand Monday's selloff, you need the full context of where gold is coming from. Spot gold was trading just above $2,000 per ounce at the start of 2024. It has since surged to nearly $5,100 — a 2.5-fold increase in roughly two years, one of the most extraordinary rallies in modern precious metals history. One year ago, gold sat at approximately $2,900. That means even after Monday's decline, XAU/USD is still up approximately 75.6% year-over-year. On January 29, that one-year gain was as high as 95.6%. The metal's ascent over the past 24 months was built on three pillars: a reliably dovish Federal Reserve outlook, persistent central bank buying at an institutional scale, and geopolitical risk premiums tied to Trump's trade policy disruptions. Monday's session is an attack on the first and most structurally important of those pillars.
The Dollar Is the Weapon — DXY Hits Three-Month High, Making Gold Expensive for Every Non-Dollar Buyer
The U.S. Dollar Index climbed to a more than three-month high Monday, and that single dynamic explains the bulk of gold's decline more cleanly than anything else. Gold is priced in dollars. When the dollar strengthens, every buyer outside the United States pays more per ounce in their local currency. That mechanical relationship suppresses demand from European, Asian, and Middle Eastern buyers simultaneously. The dollar is strengthening because oil at $96 to $119 a barrel is reigniting inflation expectations in the United States — and higher expected inflation forces a repricing of the Fed's rate path. The 10-year Treasury yield (^TNX) climbed to a one-month high at 4.15% to 4.17% Monday. Higher yields raise the opportunity cost of holding a zero-yield asset like gold directly. The two forces — stronger dollar and higher real rates — are both compressing XAU/USD at the same time, and both are being driven by the same oil shock.
Tim Waterer, chief market analyst at KCM Trade, captured it precisely: much of gold's price appreciation over the past 12 months was predicated on a dovish Fed outlook, and that assumption has now been directly challenged by $100-plus oil introducing serious inflation risk. Rate cuts are no longer a given. The CME FedWatch tool shows the March 18 meeting producing no change. The odds of a June hold — which were below 43% just last week when the war began — climbed above 51% Monday. That repricing is a direct headwind for gold.
The Liquidity Paradox — Gold Is Being Sold to Cover Losses Everywhere Else
Here is the dynamic that explains the apparent paradox of gold falling during a geopolitical crisis. When a shock of this magnitude hits simultaneously across equities, bonds, and currencies, institutional portfolios face margin calls and forced deleveraging across the board. Gold, up 75.6% in a year and sitting near all-time highs, is one of the most liquid and profitable positions on most institutional balance sheets. It gets sold not because it has failed as an asset, but because it is one of the few assets where selling does not lock in a loss. In a broad crisis-driven liquidation, even the best-performing assets get sold to raise cash. That is exactly what is happening to XAU/USD right now, and it is a pattern that has repeated in every major market shock over the past decade — gold sells off in the first wave, then recovers once the dust settles and safe-haven demand reasserts.
Silver, Platinum, and Palladium All Take Hits — But With Different Magnitudes
The broader precious metals complex is not being spared. Spot silver fell 1.3% to $84.42 per ounce Monday, after at one point losing more than 5% during the session — a remarkable intraday range that signals the same forced liquidation dynamic hitting gold. Silver has more than tripled over the past year, making it an even more profitable long to sell into a margin call than gold. Platinum dropped 1.3% to $2,108.05. Palladium fell 2.4% to $1,586.75. Later in the session, some divergence emerged — platinum gained 0.6% to $2,148.25 and palladium rose 1.4% to $1,648 in certain readings — suggesting some dip-buying returning to the platinum group metals. Silver was last quoted at $84.06, down 0.3%, having recovered significantly from its early 5% plunge. The silver recovery is worth watching — silver's industrial demand profile gives it some insulation from the pure-rates-driven selling pressure hitting gold.
The 2.5-Fold Rally From $2,000 to $5,100 — How Unusual Is This and What Does History Say
The gold rally from just above $2,000 in early 2024 to nearly $5,100 now is genuinely historically extraordinary. Jesús Fernández-Villaverde examined the historical data and characterized the 2.5-fold increase as striking — not just in magnitude but in speed. To put it in context: it took gold roughly 11 years to go from $1,000 to $2,000 per ounce. It took approximately two years to go from $2,000 to $5,100. That acceleration reflects the structural shift in gold demand driven by central bank buying, de-dollarization pressures, and the persistent uncertainty around U.S. fiscal policy and geopolitical stability. The People's Bank of China extended its gold purchasing streak to 16 consecutive months through February — that kind of sustained institutional buying at the sovereign level does not reverse because oil spiked for two weeks. It is a multi-year structural position.
Central Bank Buying Is the Floor — PBOC 16 Consecutive Months, Structural Demand Intact
The most important support mechanism for gold — and the reason this pullback should be treated as a buying opportunity rather than a trend reversal — is the central bank buying dynamic. The PBOC bought gold in February, extending its streak to 16 straight months. This is not a trading position. This is a strategic reserve reallocation that reflects a long-term conviction about dollar risk, geopolitical uncertainty, and the need to diversify away from U.S. Treasury holdings. Elevated central bank buying at this scale has underpinned every dip in gold over the past two years. The sellers Monday are institutional funds covering losses and dollar-driven mechanical selling. The buyers at the sovereign level are not going anywhere.
Read More
-
FDVV Slips Near $60 as the "High Dividend" ETF's Hidden Tech Top — NVIDIA, Apple, Microsoft — Gets Caught in the AI Air Pocket
26.06.2026 · TradingNEWS ArchiveStocks
-
IBIT Drives Bitcoin ETF Flows Negative for 2026 as $7.2B Exits Across Two Record Streaks — But On-Chain Data Says Cyclical, Not Structural
26.06.2026 · TradingNEWS ArchiveCrypto
-
Natural Gas Holds $3.30 on Expiry Day as Next Week's Heat Wave Overpowers a Bearish Storage Print and Record Production
26.06.2026 · TradingNEWS ArchiveCommodities
-
Dollar-Yen Grinds to 40-Year Highs Near ¥161.70 as the Warsh Fed Keeps the Rate Gap Wide and Tokyo's Intervention Threat Loses Its Bite
26.06.2026 · TradingNEWS ArchiveForex
What Wednesday's CPI and Friday's PCE Mean for XAU/USD
The next major catalysts for gold are the February Consumer Price Index on Wednesday and the Personal Consumption Expenditures index on Friday — the Fed's preferred inflation gauge. Jim Wyckoff, senior analyst at Kitco Metals, was direct: if those numbers come in hot, the Fed faces a genuine quandary, and gold could see another leg lower. Here is the specific scenario to watch. A hot CPI reading — particularly if energy contributes more than expected — would force the market to price out any remaining 2026 rate cuts entirely. The June hold probability, already above 51%, could push toward 70% or higher. That scenario sends the dollar higher, yields higher, and gold lower in the near term. A softer-than-expected reading, on the other hand — which is possible given the data reflects February prices before oil's dramatic recent surge — would give gold room to recover and reassert its safe-haven bid.
The critical point: neither this week's CPI nor PCE will yet capture the full inflationary impact of oil going from approximately $60 to $119 per barrel. That data will not appear in the numbers until April and May readings. Which means the real inflation shock from this oil move is going to arrive in the data weeks after it has already been priced into markets. That creates a window where gold's current weakness — driven by anticipated inflation reducing rate cut expectations — may be pricing in a headwind that the actual data does not yet confirm.
The Geopolitical Floor — War Day 10, Hardliners in Charge, No Off-Ramp Visible
Iran named Mojtaba Khamenei — son of the late Supreme Leader Ali Khamenei — as the new supreme leader Monday, signaling that hardliners remain firmly in control of the Iranian government. This is not a signal of impending de-escalation. This is the opposite. A new hardline supreme leader with every incentive to demonstrate strength against U.S. and Israeli strikes is not a leader who moves toward a negotiated resolution in the near term. The war is entering its 10th day with no credible off-ramp visible. The Strait of Hormuz remains effectively closed. Saudi Arabia's Ras Tanura refinery is offline. Bahrain's Bapco Energies and Qatar's Ras Laffan have declared force majeure. The underlying geopolitical premium that drove gold from $2,000 to $5,100 has not disappeared — it has intensified. The current selloff is a rates and dollar story, not a geopolitical story. The geopolitical story supports gold, and that support is getting stronger with every day the conflict continues.
European Bond Market Rout Adds Another Dimension — ECB Hike Risk Returns
The European dimension of this crisis is creating an additional cross-current for gold. Poland canceled its bond swap tender for March 11 entirely. The Czech Republic nearly halved its Wednesday bond auction to 5 billion crowns from a planned 9 billion crowns. Polish 10-year bond yields hit 5.723% — one-year highs. Czech 10-year yields reached 4.993%, the highest in more than two years. Hungarian 10-year bonds were bid at 7.46%, up nearly 100 basis points from late-February levels. Swaps now imply a 60% probability that the European Central Bank hikes rates twice in 2026. The Bank of England faces nearly 50% odds of a rate increase by year end. UK 2-year yields surged as much as 30 basis points Monday — the biggest single-day move since October 2022. When European central banks are being pushed toward hiking rather than cutting, it means the global rate environment is tightening, which is fundamentally negative for gold across all currency pairs, not just XAU/USD. The ECB hiking scenario particularly matters because European buyers are among gold's most important marginal demand sources.
Sugar, Coffee, and the Commodity Contagion — Oil Is Repricing Everything
The oil shock is not staying contained to energy. Raw sugar futures on the ICE exchange rose 3.4% to 14.58 cents per pound Monday. White sugar futures gained 1.5% to $420.70 per metric ton. The mechanism is Brazil — the world's largest sugar producer — where most ethanol is made from sugarcane. As crude oil pushes above $100, Brazilian cane mills have a powerful economic incentive to redirect cane toward ethanol production rather than sugar, which reduces global sugar supply. Oil prices have more than doubled since the start of the year. Arabica coffee rose 1.1% to $2.9645 per pound, after gaining 4.5% the prior week. Robusta coffee dipped 0.3% to $3,763 per ton, having gained 4% the prior week. London cocoa was little changed at 2,315 pounds per ton. New York cocoa held near $3,229 per ton. The commodity complex is getting repriced broadly — and that broad commodity inflation is one of the structural arguments for gold's long-term value preservation thesis even if it creates near-term rate headwinds.
Spain's Push for EU Energy Market Integration — The Long-Term Policy Response
Spain's Finance Minister Carlos Cuerpo used Monday's Eurogroup meeting in Brussels to argue that the Iran crisis creates a specific opportunity to accelerate European energy market integration — interconnecting national grids and deepening cross-border energy infrastructure. The lesson from the Ukraine crisis, he argued, was that a coordinated European response is always more effective than fragmented national reactions. This policy direction matters for gold because deeper European energy integration reduces the vulnerability of European economies to future energy shocks — which reduces one of the structural risk premiums that has supported gold demand from European central banks and sovereign wealth funds. It is a long-term negative for the geopolitical fear premium in gold, but only over a multi-year horizon. In the current session, it is noise.
Verdict on XAU/USD — The Dip Is a Buy, But Timing Requires Patience
Gold at $5,080 to $5,097 is being sold for the wrong reasons. The dollar strength and rate repricing that are pressing XAU/USD lower are real headwinds in the near term — but they are driven by an oil shock whose inflationary impact has not yet appeared in the CPI or PCE data. When those numbers arrive in April and May, the inflation argument for holding gold will reassert itself with hard data behind it rather than just forward projections. The central bank buying floor — 16 consecutive months from the PBOC alone — has not changed. The geopolitical premium has intensified, not diminished, with a hardline new Iranian supreme leader and no resolution in sight. The one-year gain of 75.6% means gold has significant profits to give back in a forced liquidation scenario, which is exactly what is happening in the first wave of this shock.
The near-term range is $5,000 to $5,100, with $5,000 as the critical psychological floor. A close below $5,000 would signal a more serious structural breakdown and open the path toward $4,800. On the upside, a recovery above $5,160 — Friday's close — would confirm that the liquidation wave has exhausted itself and the safe-haven bid is reasserting. Wednesday's CPI is the nearest-term binary: a soft print is a buy signal for gold. A hot print extends the pain toward $5,000. The medium-term thesis — central bank buying, geopolitical escalation, eventual Fed easing once the data catches up to reality — remains intact. XAU/USD is a buy on any test of $5,000, with a stop below $4,900 and a target back toward $5,400 as the dust settles.


