





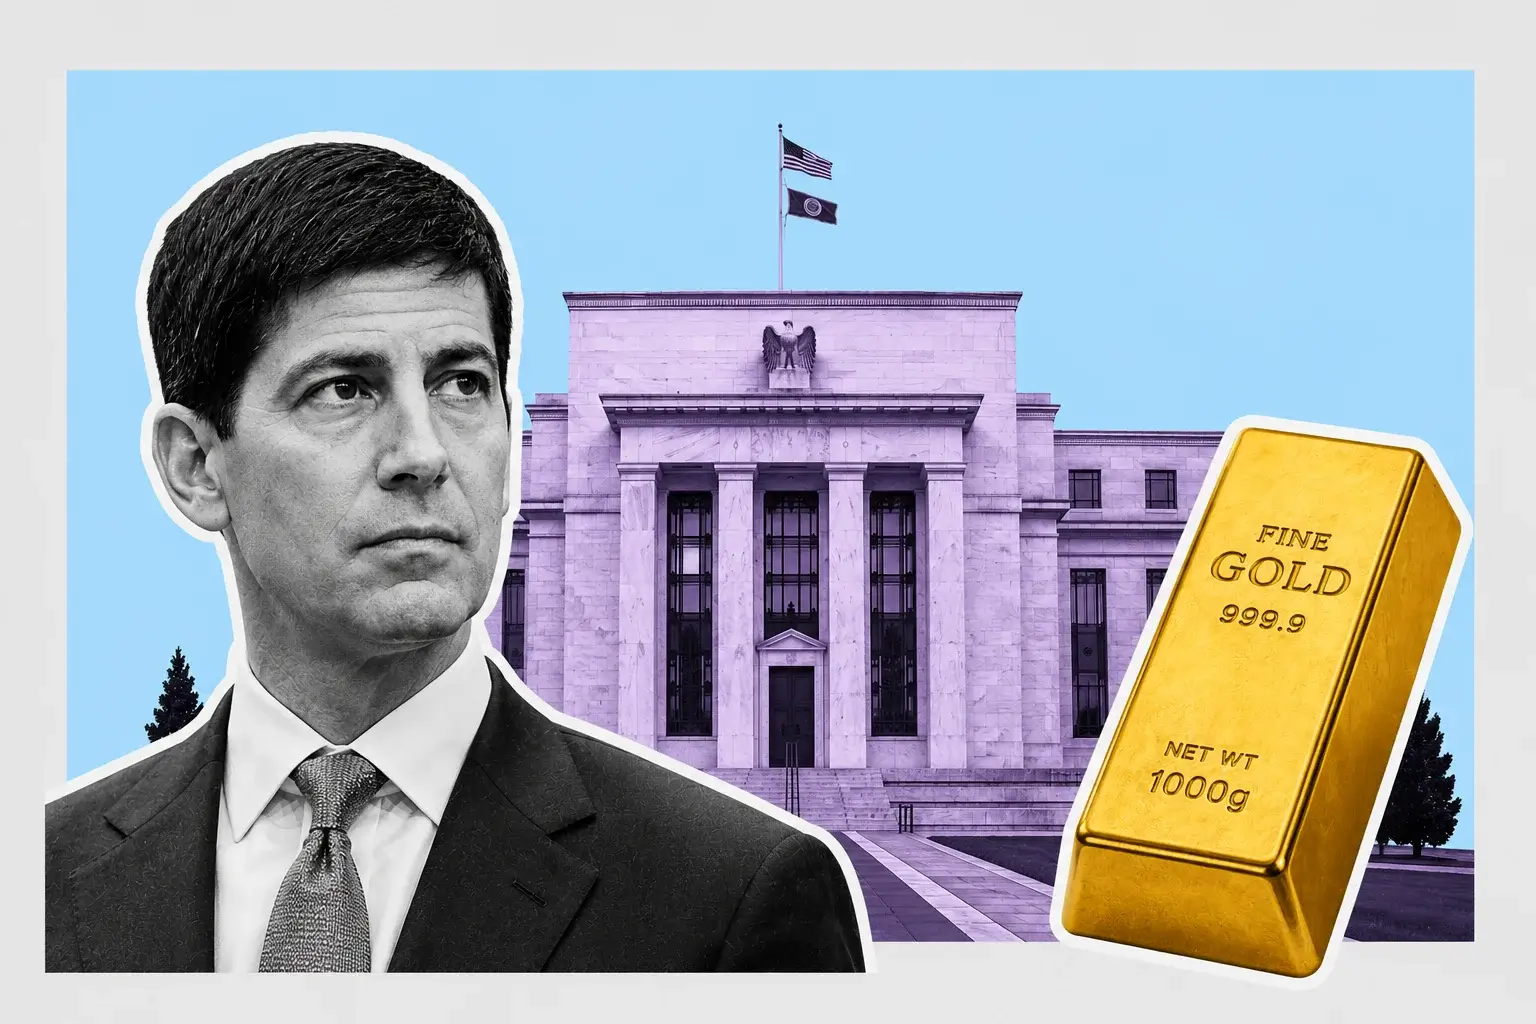
Gold Recovers to $4,436 as September Hike Odds Hold at 32% Ahead of FOMC Minutes
The metal is up 8.87% on the month but just 0.25% year to date | That's TradingNEWS
Key Points
- Gold bounced from $4,324 to $4,436.15 with December futures at $4,495.60, up 1.70%.
- The 200-day SMA at $4,503.24 and the $4,481.78 bear-market line sit $22 apart.
- Q2 global gold demand hit 942 tonnes, the lowest since Q3 2021, on halved investment flows.
Gold (XAU/USD) opened Wednesday at $4,416.75, sold down to a weekly low near $4,324 during the Asian session, and clawed back to $4,436.15 at the high before settling into the $4,390s. COMEX December futures traded $4,495.60, up $75.00 or 1.70% on the session, after closing $4,480.90 on Tuesday. The daily band on spot ran $4,386.10 to $4,436.15 — a $50 range that says nothing has been resolved.
The reversal off $4,324 is the only constructive thing on the chart today. Tuesday delivered a 1.86% flush that reversed two consecutive advancing sessions and dragged the metal below $4,400 for the first time in a week. Buyers stepped in near $4,300, the same shelf that has absorbed every downside test this month.
The performance table frames the problem. Gold is up 8.87% over the past month and 30.74% over twelve months, but the year-to-date change is +0.25%. Eight months of trading has produced a quarter of one percent. That is what happens when an asset prints an all-time high of $5,602.23 on January 29 and then loses roughly 40% into a yearly low of $3,351.33 before recovering more than 10% off that floor.
At $4,400 the metal sits roughly 21.5% below the January record. The specific number that matters is $4,481.78 — a 20% decline from the all-time high, the conventional line separating a bear market from a correction. Gold has not closed above it. Directly overhead sits the 200-day simple moving average at $4,503.24. Those two levels are stacked within $22 of each other, and clearing both is the entire bull case.
Silver went the other way hard, dropping 3.73% on the session after holding $65.45 earlier in the week. Platinum fell 3.53%. The gold/silver ratio near 67 to 1 has started widening again, which historically signals the precious complex is trading defensively rather than directionally.
The catalyst is scheduled: FOMC minutes at 2:00 p.m. ET, with Jackson Hole eight days out. Gold's advance rests entirely on one input, and both events can reprice it.
What Actually Defended $4,300 on Tuesday
Tuesday's 1.86% decline was not a gold-specific event. It was a metals-wide pullback triggered by the sovereign bond market, and the mechanics matter more than the magnitude.
Global bond yields surged to multi-year highs Tuesday on mounting fiscal concerns and persistent inflationary pressure. The 30-year U.S. Treasury reached 5.338%, a 19-year high and the steepest reading since June 2007. Sovereign yields across other major economies climbed to their highest levels in decades — Japan's 10-year to 2.95%, the highest since 1996, Germany's 30-year bund to its highest since 2011, France's 30-year to levels last seen in 2008. Every one of those moves raises the opportunity cost of holding an asset that pays nothing.
Gold eased below $4,400 into that, reversing earlier gains and completing a broad pullback across the metals. Silver and platinum took heavier damage than bullion, which is the standard pattern when the move is driven by rates rather than by a growth scare.
The floor held because the rate-hike repricing that drove August's advance has not been undone. Markets now expect the Fed to hold in September and are no longer fully pricing a rate increase by year-end — a position that did not exist a week earlier. That expectation is the load-bearing wall under $4,300.
Wednesday's recovery came from two sources. The 30-year retreated slightly from its multi-decade high, and the 10-year eased to 4.70%, down 0.21% on the session. Simultaneously, the dollar attracted sellers and lingered around multi-month lows against most major currencies, which makes dollar-priced metal cheaper for holders of other currencies.
The moving-average cluster between $4,371.32 and $4,384.55 is the zone where the reaction developed, with $4,308 to $4,310 flagged as the deeper reference if that cluster fails. Both held. Friday's low at $4,311 sits inside that same band, which now constitutes a triple-tested shelf.
Below $4,300 there is meaningful air. The next structural support sits far lower, near the $4,175 zone and then $4,002 to $4,017 as the key band. A break of $4,300 would represent a 3.9% air pocket before anything meaningful catches it — and would put the entire August advance in question rather than merely pausing it.
The Entire Rally Is One Trade, and It Is Not Safe Haven
The most misread aspect of gold's August performance is the driver. This is not a geopolitical bid. It is a rate-expectation trade, and stating the mechanism precisely also defines the downside.
Gold pays no income. Its opportunity cost is therefore the real yield — the inflation-adjusted return available on Treasuries. When the market prices a lower path for policy rates, real yields fall, and the cost of holding non-yielding bullion drops with them. That is the transmission channel, and it has been the only channel operating since early August.
The proof is in the timing. Gold rose 8.87% over the past month while the Middle East conflict deteriorated continuously — the 60-day ceasefire expired without replacement, Iran shifted from defensive to fully offensive posture, and shipping through the Strait of Hormuz remains a fraction of normal levels. If safe-haven demand were driving this, the metal would have made new highs on that sequence rather than trading 21.5% below January's record.
September hike odds tell the actual story. A week before the August data run, markets priced better than even odds of a quarter-point increase. By that Friday, pricing had collapsed to 31%. Current readings sit between 32% and 36%, with CME data placing the probability of a hold at 69.9% and rate futures showing 67.4% hold against 32.6% for a 25 basis point hike. Fed funds remain at 3.50%–3.75%.
That is a 20-plus point swing in a single week, and gold captured essentially all of it.
The fragility follows directly. If hike expectations reprice back toward 50%, the mechanism that produced this advance runs in reverse with the same force. There is no secondary support layer — physical demand is at a five-year low, ETF holders have been redeeming, and the dollar has already done most of the work it can do at multi-month lows.
Everything now depends on two scheduled events capable of moving those odds: the July minutes today and Warsh's Jackson Hole keynote on August 28.
The Data Run That Broke the Stalemate
Gold spent the first week of August stuck between a cooperative bond market and a firm dollar. Four data points broke the deadlock, and each deserves its number.
July CPI rose 0.1% on the month, with the annual rate easing to 3.4% from 3.5%. PPI came in flat against expectations for a 0.2% increase. The July employment report showed employers unexpectedly cut jobs. Then July retail sales fell 0.6% when consensus called for a 0.1% increase — the largest decline in more than a year.
The retail sales miss was the one that mattered. The bond market had been cooperating since the CPI print. The currency market had not. Friday it did: the U.S. Dollar Index fell 0.3% to 99.67, and gold finally got both legs of the rate trade lined up in a single session. Spot settled $4,376.82, up $25.55 or 0.59%.
That week produced gold's largest one-week gain since January, a roughly 5% advance. Gold mining shares had their hottest five-day run since 2008. The metal then extended to a fresh two-month peak near $4,450 as hike bets kept fading, before correcting to end the following week virtually unchanged.
Context on how rare that was: July delivered a gain of approximately 0.5%, gold's first monthly increase since February. Five consecutive months of decline preceded it. The August move is the first sustained advance in half a year, which is why the technical community treats $4,481.78 and $4,503.24 as regime-defining rather than as ordinary resistance.
The inflation picture is what keeps this precarious. CPI at 3.4% remains well above the 2% target and has been stuck above it for five years. The softening in the July prints came from goods and services categories, not from energy — and energy has been climbing hard since. That distinction is the reason the long end of the Treasury curve refused to fall despite the soft data, and it is why gold's rally has not been able to translate into a durable break of the 200-day.
Upcoming releases carry the same weight: the Philadelphia Fed Manufacturing Index for August lands Thursday, preliminary August manufacturing and services PMIs land Friday, and July PCE arrives August 26.
$4,481.78 Is the Bear Market Line and the 200-Day Sits Above It
The technical structure is unusually clean because two of the most-watched levels on the chart sit within $22 of each other.
The first is $4,481.78, which represents exactly a 20% decline from the January 29 all-time high of $5,602.23. Clearing it ends the bear market by the conventional definition. It does not begin a new bull market — that requires far more work — but it removes the label, and label removal generates flow from systematic accounts that trade drawdown thresholds.
The second is the 200-day simple moving average at $4,503.24, with a separate reading placing the longer-term SMA at $4,509. Gold remains well below it, which keeps the near-term bias tilted bearish despite the metal consolidating near recent highs. Some accounts will treat the 200-day as resistance and sell into it. Others will treat a clean break as an acceleration trigger. Both behaviors are visible in the order book on approach.
The sequence to get there is defined. The 50% retracement of the April-to-June decline sits at $4,406, and gold has been struggling to find acceptance above it — that is the first hurdle. An intermediate 50% level sits at $4,416.82. Last week's high at $4,449.83 is the next marker, and taking it out reaffirms the uptrend. Above that comes $4,481.78, then $4,503.24, then the 61.8% Fibonacci retracement at $4,519.36 reinforcing a broader ceiling.
Four levels inside 2.6%. A single strong session covers the entire ladder, which is exactly what makes the minutes release binary.
Downside structure is equally specific. The 50-day moving average sits at $4,386.29 — gold is trading right on it. The five-day moving average at $4,348.08 is the near-term pivot, and the Fibonacci pivot point performance value sits at $4,340.56. Beneath that, the moving-average cluster runs $4,371.32 to $4,384.55, and the deeper reference sits at $4,308 to $4,310.
Losing $4,300 targets $4,175 and then the key $4,002 to $4,017 band, roughly 9% below current levels.
Read More
-
Yen Stalls at 160 Despite a 3% JGB and Tokyo Core CPI at 2.0% — Intervention Sits at 164, Friday's Payrolls Decide
02.09.2026 · TradingNEWS ArchiveEnergy
-
QQQ ETF ($706.22) Slides 7.4% Below Its High as the Market Reprices the AI Capex Bill — $686.57 Target if $700 Breaks
22.10.2026 · TradingNEWS ArchiveStocks
-
XRPI ($7.00) and XRPR ($10.74) Slide Toward 52-Week Lows as Spot XRP ETF Flows Stall at $708,510
22.10.2026 · TradingNEWS ArchiveCrypto
-
NG ($2.775) Decoupled From Europe’s €88 Gas Crisis as LNG Feedgas Hits 18.9 Bcf/d — $3.30 Upside on Cold Weather
22.10.2026 · TradingNEWS ArchiveCommodities
-
Dollar-Yen (157.35) Loses 157.65 as the Yen Rallies on Haven Demand — 155 Target if 156 Breaks
22.10.2026 · TradingNEWS ArchiveForex
Momentum Is Split and That Is the Honest Read
The indicator picture depends entirely on which timeframe is queried, and the split is the most useful information available.
On the daily chart, the MACD remains above zero but has slipped back toward its signal line — momentum still positive, deteriorating at the margin. The RSI reads 59.24, in positive territory and comfortably below overbought. That combination says bullish momentum is present but vulnerable to further corrective pressure while price fails to reclaim the levels overhead.
A separate snapshot taken two sessions earlier reads considerably worse: 14-day RSI at 39.735 and MACD at -12.370, both generating sell signals, with the five-day moving average at $4,348.08 and the 50-day at $4,386.29 also flashing negative. The gap between the two readings is the volatility of the last 48 hours — a 1.86% flush followed by a bounce off $4,324 will produce exactly that kind of oscillator whipsaw.
The multi-timeframe signal grid captures the tension precisely. The hourly reads strong sell. The five-hour and 30-minute read neutral. The daily, weekly and monthly all read strong buy. Across moving averages from MA5 to MA200 the count runs seven buy signals against five sell signals.
Translated: the intraday tape is heavy, the medium-term trend is intact, and the long-term structure remains constructive. That is a market waiting on a catalyst rather than one making a decision.
Volatility compression supports the same conclusion. Gold has spent five sessions inside a $4,310 to $4,449 band, roughly 3.2% wide, after a month in which it moved 8.87%. Ranges that tight following moves that large do not persist. The projected consolidation band for today runs $4,313.67 to $4,441.34, and price has already tested both ends of it.
The forecast band for the full month is far wider at $3,580.75 to $4,645.91, which is an honest reflection of how much the outcome depends on one Fed communication.
Silver Cracked and the Ratio Is Warning
Silver's 3.73% single-session drop is a larger warning than gold's 1.86% flush, and the divergence between the two metals is the tell.
Silver held $65.45 on August 17 with the gold/silver ratio near 67 to 1, little changed as the metal consolidated ground reclaimed the prior week. By Wednesday silver had lost 4.25% on the tape and platinum was down 3.53%. Gold fell roughly a third as much.
That spread is diagnostic. Silver carries substantially more industrial demand exposure than gold, which makes it a leveraged play on both the monetary trade and the growth cycle. When silver underperforms bullion by this margin, the market is pricing industrial weakness rather than monetary debasement — and it aligns with what happened across the semiconductor complex overnight, with the KOSPI down 5.8%, the Nikkei down 3.16%, and Samsung Electronics falling 7.8%.
A widening ratio from 67 to 1 also signals defensive rotation inside the precious complex. Capital moving from silver into gold is capital reducing risk, not adding to a metals position. That is a materially different flow than the one that produced the first week of August, when both metals turned in their best performance in months simultaneously.
Silver's setup into the minutes is the higher-beta version of gold's. If the release reduces expectations of further hikes, silver benefits disproportionately. If oil keeps climbing and forces the Fed to stay tight, silver takes the larger hit — and it takes it faster.
Gold miners amplify all of this. The five-day run they posted in early August was their hottest since 2008, which is a measure of how much operating leverage sits in that group at these bullion prices. A move through $4,503.24 sends the mining complex substantially higher than the metal. A failure at $4,449.83 does the reverse with equal force, and miners have already given back part of the August surge.
Physical Demand Fell to 942 Tonnes — the Lowest Since 2021
The fundamental picture underneath the price is considerably weaker than the chart suggests, and the second-quarter numbers are the clearest evidence.
Global gold demand fell to 942 tonnes in Q2 2026, the lowest quarterly reading since Q3 2021. The decline came from two sources: weaker jewellery demand and outflows from gold ETFs. Investment demand fell by nearly half. Central banks were the offset, continuing to add to reserves across several countries.
That composition matters. A 942-tonne quarter is not a market being driven by physical scarcity or by retail accumulation. It is a market where the price is being set almost entirely by positioning in paper — futures, ETFs and the rate expectations that govern both. It explains why gold can rally 8.87% in a month while the underlying tonnage collapses, and it explains why the rally has no cushion if the rate story reverses.
Central bank buying is genuinely supportive, but the first-half picture is weaker than any single headline quarter suggests. Official-sector accumulation has slowed from the pace that underpinned the 2024 and 2025 advance, even as it remains positive.
The one structural argument in the bull column is not about gold at all. It concerns Commodity Trading Advisor positioning in Treasury futures, which remains deeply short. That is a more consequential data point than most Fed commentary, because when speculative accounts are crowded short a market, they become forced buyers the instant it turns. An unwind of those Treasury shorts drives yields lower and the dollar softer simultaneously — which is precisely the two-legged setup that produced gold's best week since January.
Physical buyers have been treating dips as entry points rather than exits throughout the August advance, which is the behavior that held $4,300 on Tuesday and $4,324 on Wednesday. That bid is real but it is price-sensitive, and it thins considerably above $4,450.
Forecast anchors from the sell side sit above spot. JPMorgan's fourth-quarter target is $4,500. UBS extended its horizon by a quarter and introduced an end-September 2027 target of $5,400.
Oil at $92 Brent Is Gold's Enemy, Not Its Ally
The intuitive read — Middle East conflict, energy shock, buy gold — has been wrong all year, and the mechanism explaining why is the most important thing on this page.
Brent reached $92 and WTI touched $85 on Wednesday, a nearly three-week high. The escalation is genuine: Trump asserted the U.S. is not engaged in talks with Iran and that the naval blockade of Iranian ports remains in full force, then posted a map on Truth Social depicting the Strait of Hormuz as U.S. territory. Iranian forces have intensified attacks on shipping through the waterway.
None of that helped gold. It hurt gold.
Higher energy prices feed directly into inflation expectations. Elevated inflation expectations keep the Fed tight and push long-end yields higher. Higher long yields raise the real return available on Treasuries, which raises gold's opportunity cost. The chain runs from crude to the 30-year to the metal, and every link has been active this month.
The evidence is in the reverse case. In the first week of August, falling energy prices helped drive the metals in their strongest direction in months — the first time in a long stretch that lower crude did the lifting. Gold rose 5% that week specifically because falling oil reduced the perceived need for the Fed to raise rates.
Independent analysis has framed the current constraint identically: gold's rebound has lost momentum as the renewed rise in oil prices added to pressure from higher long-end U.S. yields, with both markets curbing the metal's advance. For the rally to regain traction, oil and yields need to stabilize, or investment demand needs to pick up meaningfully from the halved second-quarter level.
Neither condition is currently met. Crude is at a three-week high. The 30-year printed 5.338% this week. Investment demand delivered its weakest quarter in five years.
That leaves gold dependent on a single variable — the market's read of September policy — with an active headwind on both flanks. It is the reason a metal 21.5% below its record cannot clear a 200-day moving average sitting 2.3% overhead.
The 2:00 PM Minutes and What Would Break the Range
The July 28–29 FOMC minutes land at 2:00 p.m. ET under the standard three-week publication schedule. The committee held at 3.50%–3.75% on a 9–3 vote, with three regional presidents dissenting in favor of a 25 basis point hike — the first time since September 2016 that three policymakers aligned on a single directional dissent.
The statement offered no forward guidance, consistent with Warsh's stated aversion to signalling the policy path. That absence is what gives the minutes unusual weight: with guidance withdrawn, this document is the primary window into how far hawkish sentiment extended beyond the three named dissenters.
The asymmetry favors the downside for gold. Hike expectations have already collapsed from better-than-even to roughly 32%, which means the dovish outcome is substantially priced. A minutes release confirming isolated dissent produces a modest move toward $4,449.83 and possibly $4,481.78. A release showing broader support for tightening — or language echoing Warsh's apparent comfort with the recent tightening in financial conditions — reprices September toward 45% and puts $4,300 under immediate pressure.
Jackson Hole is the larger event and it lands eight days out. The Kansas City Fed hosts the symposium from August 27 to 29, with Warsh delivering the keynote Friday morning, August 28 — his first since taking office on May 22. Three factors concentrate the risk: the information vacuum created by withdrawn guidance makes a set-piece speech unusually consequential; the timing places it 19 days before the September 16 decision; and gold's entire advance rests on faded hike expectations, making this the most plausible scheduled event capable of reversing them.
Between the two sits July PCE on August 26, the Fed's preferred inflation gauge, arriving one day before the symposium opens.
Positioning ahead of all three is why the five-day range has been $4,310 to $4,449. The market is not undecided. It is waiting.
The Forecast: Levels, Targets and the Verdict
The base case is that gold holds the $4,300 to $4,310 shelf and grinds toward the two-level cluster overhead before the minutes force resolution. The immediate ladder runs $4,406 as the 50% retracement of the April-to-June decline, then $4,416.82, then last week's high at $4,449.83.
The bull sequence requires all three plus the two that matter. Clearing $4,449.83 reaffirms the uptrend and opens $4,481.78 — the 20%-off-record line that formally ends the bear market classification. Immediately above sits the 200-day SMA at $4,503.24, and above that the 61.8% Fibonacci retracement at $4,519.36 caps the move. Clearing $4,519.36 puts JPMorgan's $4,500 fourth-quarter target in the rearview and opens the far larger $4,855 to $4,894 zone that has not been tested since the collapse from January's record.
Reaching $4,503.24 from current levels is a 2.5% move. That is one session on a dovish minutes surprise.
The bear sequence starts at $4,386.29, the 50-day moving average gold is currently sitting on. Losing it targets $4,348.08 and the $4,340.56 pivot. Below that the moving-average cluster at $4,371.32 to $4,384.55 has already failed, leaving $4,324 as the weekly low and $4,308 to $4,310 as the last defended shelf. A daily close under $4,300 opens $4,175 with genuine air beneath it, and the key structural band at $4,002 to $4,017 becomes the destination — roughly 9% lower.
The monthly forecast band spans $3,580.75 to $4,645.91, with end-of-month projections clustering between $4,084 and $4,120.78 in the event a hike returns to the table.
The verdict: this is a rate-expectation rally wearing a safe-haven costume. Gold is up 8.87% on the month and 0.25% on the year, with quarterly physical demand at a five-year low of 942 tonnes, investment demand halved, silver cracking 3.73%, Brent at $92 feeding the inflation that keeps the 30-year at 5.338%, and every gain attributable to a single 20-point swing in September hike pricing. That is a narrow foundation. Base case targets $4,503.24 on a minutes release that isolates the three dissenters, with $4,519.36 as the extension. Failure to hold $4,300 targets $4,175 first and $4,017 as the structural floor. Nothing about the metal's fundamentals resolves this — the Treasury curve does, and Warsh gets the final word on August 28.





