Brent Holds $91 With 8.3M Barrels a Day Still Shut In Behind Hormuz
Global observed stocks have fallen 410M barrels since the war began | That's TradingNEWS
Key Points
- WTI trades $84.92 and Brent $91.52, up 37.47% and 36.92% over twelve months.
- The IEA cut 2026 demand by 1.6 million barrels per day, 510,000 more than in July.
- US crude stocks built 17.4 million barrels to 424.4 million in the week to August 7.
Brent crude climbed toward $92 on Wednesday, printing $91.52 for a 0.55% gain and extending higher for a fourth consecutive session. West Texas Intermediate reached $85 after settling at $84.92 on Tuesday, up 0.49%. Front-month WTI futures traded between $83.92 and $84.78 across the overnight session before the U.S. bid developed.
The trailing math shows how far this market has traveled. Brent is up 2.57% over the past month and 36.92% over twelve months. WTI has gained 2.95% on the month and 37.47% on the year. The Brent-WTI spread sits at $6.60, well inside the $12 monthly average recorded in March and far below the $25 peak printed on March 31.
The annual path frames the volatility. Brent opened 2026 at $61 per barrel, finished the first quarter at $118 — the largest quarterly increase on an inflation-adjusted basis in the available data series — and touched nearly $128 on April 2. It then collapsed to $69 on July 2 following the June memorandum of understanding between Washington and Tehran. North Sea Dated rose $25.67 over July to close the month at $96.80 before easing back near $92.
That is a $59 round trip inside eight months on the same benchmark. Benchmark crude traded an exceptionally wide range of almost $40 per barrel in July alone.
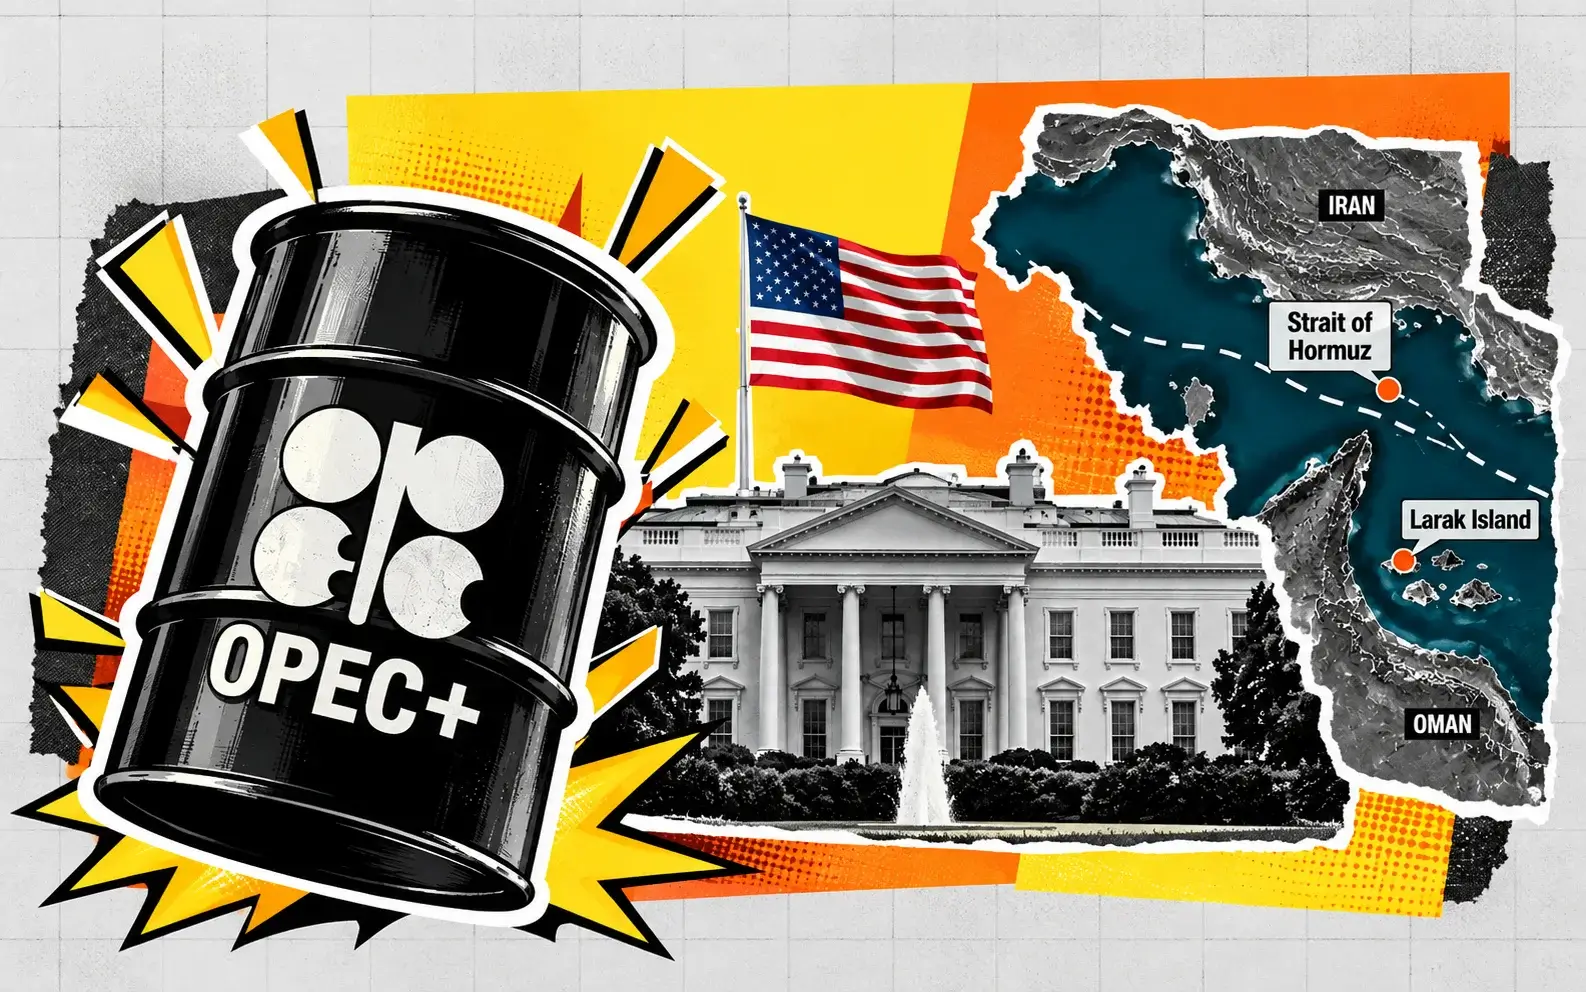
The immediate driver is a diplomatic vacuum. The 60-day memorandum signed in June expired Monday with nothing replacing it. Trump stated Washington is not holding or planning talks with Tehran while confirming the naval blockade remains in full force, then posted a map on Truth Social depicting the Strait of Hormuz as U.S. territory. Iran maintains Hormuz stays closed until the U.S. meets six sweeping demands.
The EIA weekly inventory report lands at 9:30 a.m. ET with consensus at a 0.2 million barrel figure against last week's 17.4 million barrel build. Industry data released Tuesday evening showed crude stocks fell 328,000 barrels.
Prompt differentials for both WTI and Brent futures have returned to backwardation — the structure that says physical tightness is real rather than positional.
Eight Attacks This Month and a Strait That Is Open Only on Paper
The disconnect between the official position and the shipping data is the single largest source of price risk in this market.
Trump contends Hormuz is open and that mines have been cleared. Eight attacks on vessels transiting the waterway have been reported so far this month, including ships linked to the UAE and Saudi Arabia. One vessel was attacked while leaving the strait, suffering engine-room damage and a crew casualty according to UK maritime authorities. Traffic through the route remains limited regardless of what the maps show.
Iranian forces have intensified hostilities over the past week. The strait carries nearly 20% of global oil supply, which makes any interruption a first-order supply event rather than a regional inconvenience.
The market's response has been adaptation rather than panic, and the adaptation is measurable. Iraq has developed new mechanisms for exports at alternative locations beginning in September. Saudi Arabia has begun offering crude cargoes sourced from outside the chokepoint, adopting an approach similar to the United Arab Emirates. Two large Chinese shipping companies have stopped sending tankers to Hormuz or Bab al-Mandeb entirely, loading cargoes outside the Gulf instead.
Middle Eastern producers have also become increasingly adept at covertly moving oil through Hormuz to global buyers while supplying cargoes from outside the chokepoint.
That workaround capacity is why Brent sits at $91.52 rather than the $128 it printed on April 2. The physical market has spent five months building routes around the constraint, and each incremental route reduces the risk premium a headline can generate.
Iran and Oman continue negotiating an arrangement for managing shipping through the strait, though the U.S. is not party to those talks. Washington is unlikely to back any deal that fails to ensure unrestricted passage, which caps how much a bilateral Iran-Oman arrangement can accomplish.
The insurance market remains the binding constraint. The strait is not physically blocked — the threat of attack and the cancellation of coverage are what keep most tankers away. Restoring flows requires underwriters to reprice risk, and underwriters move slower than diplomats.
Full restoration of flows will take months once it starts. It has not started.
The Supply Hole Is 8.3 Million Barrels Wide
The IEA's August Oil Market Report quantifies the disruption, and the numbers are larger than the price action implies.
Global oil supply rose 2.4 million barrels per day to 101.5 million in July but remained 6.3 million below year-ago levels, with 8.3 million barrels per day of Gulf output still shut in. Full-year 2026 supply is now forecast to fall by 4.3 million barrels per day to 102 million, as growth of 1.4 million from the Americas only partly offsets losses in the Middle East and Russia.
Inventories are draining. Global observed oil stocks plunged by 69 million barrels in July as renewed export disruptions from the Gulf and the Caspian sharply reduced volumes of oil on water. Onshore stocks fell a more modest 6 million barrels as the pace of IEA emergency releases slowed, and despite continued draws in Chinese crude stocks. Total observed inventories sit just below 7.9 billion barrels, down 410 million since the start of the war — an average draw of 2.7 million barrels per day.
The EIA's August Short-Term Energy Outlook, released August 11, raised its Middle East shut-in estimates versus July, assuming severe Hormuz transit constraints persist through August. The agency estimates disruptions accounted for 5.5 million barrels per day of shut-ins in July. Most regional production is expected to return near pre-conflict averages in early 2027, with ongoing disruptions of roughly 0.6 million barrels per day continuing through the end of next year.
On paper, an 8.3 million barrel per day supply hole against a 102 million barrel market should produce triple-digit crude. It has not, and the reason is on the other side of the ledger.
U.S. production is the partial offset. Output is forecast at 13.6 million barrels per day in 2026 rising to 13.8 million in 2027, half a million higher than earlier estimates as higher prices pull barrels forward.
OPEC+ output fell approximately 1.74 million barrels per day in April alone. The UAE announced its departure from OPEC effective May 1, 2026, removing a member from the coordination framework precisely when coordination mattered most.
Demand Destruction Is Doing the Balancing
The reason an 8.3 million barrel supply loss produces $91 crude rather than $128 is that demand collapsed alongside it.
The IEA now forecasts world oil demand to decline by 1.6 million barrels per day in 2026 — a downgrade of 510,000 barrels per day from the July report — as the ongoing Hormuz closure and elevated fuel prices weigh on consumption. That revision came after renewed hostilities at the end of July and the deadlock in U.S.-Iran talks forced the agency to project much larger demand destruction than the July assumptions allowed.
The quarterly shape matters more than the annual figure. Annual contractions ease from 4.9 million barrels per day in the second quarter to 2.8 million in the third, before returning to growth in the fourth quarter. Global demand is projected to expand by 2.4 million barrels per day in 2027.
That trajectory is the bear case for the back half of the year and the bull case for next year, simultaneously. Demand troughed in Q2. Supply recovers in early 2027. The gap between those two turning points is where the price gets decided.
OPEC also cut its outlook, reducing 2026 global demand growth to 1.17 million barrels per day from 1.38 million, citing the conflict's impact on trade flows.
High prices are self-correcting in a way that supply outages are not. Consumers respond to $3.70 retail gasoline by driving less, and industrial users respond to record diesel costs by substituting or deferring. Trump has explicitly called on Americans to tolerate higher fuel prices as the conflict continues — an acknowledgment that the demand adjustment is happening at the pump rather than at the policy level.
The EIA forecasts retail gasoline averaging $3.70 per gallon in 2026 before easing to $3.46 in 2027.
That demand response is why the risk premium has compressed even as the geopolitical situation deteriorated. The market has learned that every dollar of price does part of the rebalancing work that a supply recovery would otherwise have to do.
The 17.4 Million Barrel Build That Nobody Expected
The U.S. inventory picture contradicts the global tightening story, and the contradiction is the most important thing on the domestic tape.
For the week ending August 7, U.S. commercial crude inventories rose 17.4 million barrels — a massive build that lifted stockpiles to 424.4 million barrels, now just 2% below the five-year average for this time of year. That single print undid a large part of the deficit narrative.
The composition explains it. The build was predominantly driven by a 1.14 million barrel per day increase in crude imports week-on-week, while exports fell by 627,000 barrels per day. Barrels that could not clear to international buyers stayed home.
That build sits directly against the EIA's stated forecast that U.S. commercial crude inventories will remain below the five-year 2021–2025 low through the end of 2026. Increased exports, reduced imports and high refinery runs since mid-April had produced consistent weekly declines before that week broke the pattern.
The following week reversed again. Industry data showed crude inventories fell 328,000 barrels for the week ending August 14, following the 9.07 million barrel increase reported for the prior period. Government figures point to total commercial crude falling roughly 600,000 barrels over the same stretch.
Consensus for today's release sits at a 0.2 million barrel change against last week's 17.423 million. A second consecutive large build would confirm that the U.S. market is oversupplied domestically even as the global market draws, and would pressure WTI relative to Brent — reopening a spread that has compressed to $6.60.
The Strategic Petroleum Reserve has fallen to its lowest level since 1982, which removes the release mechanism that capped WTI gains during the March spike. That removal is structurally bullish for the U.S. benchmark and is not reflected in the current spread.
Weekly product data accompanying the crude figure carries equal weight given where the real tightness sits.
The Diesel Crack at $102.20 Is the Actual Trade
Crude is not where this market is tight. Distillate is.
The U.S. diesel crack spread hit a record $102.20 per barrel on August 17, with domestic inventories near 23-year lows. That is not a marginal move in a refining margin. It is a structural dislocation, and it has been building since Hormuz disruptions began squeezing refined product flows alongside crude.
U.S. diesel cleared $5 per gallon in July. The crack ran $93.84 as recently as August 17 before breaking above $100 — a move that occurred while crude itself was range-bound in the mid-$80s.
The equity market has already repriced it. Valero closed Tuesday at $350.05, just 0.27% below its 52-week high, against an average analyst target of $320.67. Second-quarter adjusted refining operating income rose to $4.44 billion from $1.27 billion a year earlier, with operating cash flow reaching $5.6 billion. Valero and Marathon both hit all-time highs earlier in August on a session when crude fell 2%.
Refiners diverging from the underlying commodity is the cleanest signal available that the bottleneck is downstream. When crude falls and refining equities make records, the market is telling you the shortage is in the barrel that has already been processed.
Gasoline, distillate and jet fuel spot prices all rose rapidly through the first quarter following supply disruptions to Middle East exports of both crude and petroleum products. Crude is typically the largest input cost for products, but the current spread reflects processing capacity constrained relative to demand for middle distillates specifically.
The vulnerability is that record cracks incentivize maximum refinery runs, and maximum runs eventually build product inventories while drawing crude. High refinery runs since mid-April are precisely what the EIA cited as driving consistent crude declines before the August 7 build.
That dynamic reverses when margins normalize. A diesel crack retreating from $102.20 toward historical ranges would simultaneously reduce crude demand from refiners and remove the strongest bid in the complex.
Watch the product build in today's release. It is the leading indicator for the crack.
Technical Structure: $86.87 Is the Gate on WTI
The chart is constructive and the levels are tight enough to trade against.
WTI remains technically bullish above $83.79, which functions as the trend line for the current advance. The next major resistance sits at $86.87, and above that $90.56 marks the objective. Price is currently pressed against the lower boundary of the target zone at $85.61 to $86.82, and piercing that band opens a run toward the $89.64 to $90.05 zone.
The downside reference on a failure at the target zone is support at $80.54 to $80.94 — a 5.2% air pocket from spot. That gap is the risk in holding length here.
Brent holds above $90.17 and all its key moving averages, with $93.78 and $97.30 in focus overhead. Those two levels bracket the July high of $96.80 on North Sea Dated, which makes the $93.78 to $97.30 corridor the zone that determines whether this is a fourth-session bounce or a genuine breakout.
The four-session advance has been orderly rather than explosive. Brent gained 0.55% Wednesday, WTI 0.49% Tuesday — daily moves under 1% in a market that traded a $40 range in July. That compression mirrors what happened in gold and Bitcoin this week and reflects the same cause: positioning ahead of the FOMC minutes at 2:00 p.m. ET.
Backwardation in prompt differentials for both benchmarks is the structural confirmation. When the front month trades above deferred contracts, holders of physical barrels are being paid to sell now rather than store, which only happens when spot supply is genuinely scarce.
The Brent-WTI spread at $6.60 is the variable to watch on the U.S. side. That spread widened to a $12 average in March and peaked at $25 on March 31 as Hormuz shipping costs and reduced inter-regional flows pushed Brent harder while strong U.S. inventories and SPR release plans capped WTI. With the SPR at 1982 lows and U.S. exports constrained, the mechanics that produced that widening have partially reversed.
A re-widening spread signals U.S. oversupply. A compressing spread signals the global tightness is reaching American shores.
Read More
-
Yen Stalls at 160 Despite a 3% JGB and Tokyo Core CPI at 2.0% — Intervention Sits at 164, Friday's Payrolls Decide
02.09.2026 · TradingNEWS ArchiveEnergy
-
LLY Reclaims $1,200 as Mounjaro and Zepbound Deliver $14.9B a Quarter — Buy Rating, $1,292 High in Sight
07.10.2026 · TradingNEWS ArchiveStocks
-
XRP-USD ($1.42) Underperforms Bitcoin as Weekly ETF Inflows Fade to $4.74M — Hold, Buy Zone at $1.37 to $1.40
07.10.2026 · TradingNEWS ArchiveCrypto
-
Brent $101 and WTI $89 Split on War Risk and Recovering Supply — EIA Sees $105, Support at $88
07.10.2026 · TradingNEWS ArchiveCommodities
-
Dow Sheds 539 Points, S&P 500 Back Under 7,800, Nasdaq Off 0.75% as Yields Reach 2002 Highs; PENG +17%
07.10.2026 · TradingNEWS ArchiveMarkets
-
Pound Retreats From 1.3284 Trendline as U.S. Yields Hit 2002 Highs — Sell Rallies to 1.3303, Downside to 1.3139
07.10.2026 · TradingNEWS ArchiveForex
What the Forecasters Are Actually Modeling
The institutional forecast set is unusually dispersed, and the dispersion is entirely a function of one assumption: how long Hormuz stays constrained.
The EIA's August STEO forecasts Brent averaging around $85 per barrel in the third quarter of 2026, with prices gradually falling as inventories rebuild and most production recovers by early 2027. For 2027 the agency projects Brent at $76.09 and WTI at $72.43. The next STEO lands September 9.
The revision history shows how violently these numbers have moved. In March the agency forecast Brent above $95 over two months, below $80 in the third quarter and around $70 by year-end, with $64 in 2027. The April STEO put 2026 Brent at $96 and 2027 at $76. In May the assumption shifted again: global inventories falling 8.5 million barrels per day in the second quarter, Brent around $106 in May and June, $89 in the fourth quarter and $79 in 2027.
For context on how far the baseline moved, the July 2025 outlook had Brent averaging $58 in 2026.
The banks cluster below current spot for the back half. J.P. Morgan's most recent revision puts end-2026 at $78, down from a prior $95, with earlier full-year figures of $96 Brent and $89 WTI for 2026 against $75 and $70 for 2027. HSBC raised its 2026 Brent average to $95 and WTI to $90, with 2027 at $83. ANZ projects Brent averaging $88 in 2026 and $76 in 2027. Macquarie carries $82.93 for full-year 2026 falling to $70 in 2027.
The medium-term consensus caps Brent at $65 to $75 through 2035 on energy transition dynamics, slower EV adoption and persistent Asian demand.
One assumption threads through all of them: Hormuz exports recover roughly 70% of the May-to-July decline and return to stable levels around October 2026. That assumption is now three weeks from its test date, with the memorandum expired, no talks scheduled and eight vessel attacks logged this month.
If October arrives without normalization, every one of these forecasts gets revised higher again.
The Backwardation Is Telling the Truth
Prompt differentials for WTI and Brent futures returned to backwardation in July, and that structural shift deserves more attention than the flat price.
Backwardation means the front-month contract trades above later-dated contracts. It exists when physical buyers need barrels immediately and are unwilling to wait, which makes storing crude economically irrational — a holder loses money by carrying inventory forward. The curve pays you to sell today.
That structure is inconsistent with the 17.4 million barrel U.S. build recorded for the week ending August 7. Backwardated curves and large domestic inventory builds do not normally coexist, and the resolution is geographic: the tightness is in the Gulf and on water, not in Cushing.
Global observed stocks falling 410 million barrels since the war began — 2.7 million barrels per day on average — is the number the curve is pricing. Oil on water plunged as Gulf and Caspian exports were disrupted, which is where the 69 million barrel July decline originated.
The IEA's emergency stock releases have slowed, removing a source of supply that had cushioned the first half of the disruption. Chinese crude stocks continued drawing, meaning the largest importer is running down inventory rather than building it.
For anyone positioning around this: a backwardated curve with global stocks at 7.9 billion barrels and falling supports carrying length, because the roll yield works in your favor. It also means any resolution to Hormuz produces a violent flattening as deferred contracts catch up, and that flattening hits total return harder than the spot move alone.
The July price range of nearly $40 per barrel is what happens when a backwardated market trades on headlines. Neither the highs nor the lows held.
The current four-session grind higher is the opposite regime — low volatility, incremental gains, positioning rather than panic. That regime persists until the next headline, and the headline flow from the Gulf has been running roughly weekly.
Product Inventories, Refinery Runs and the EIA Print
Today's data release carries more information than the crude headline number, and the sub-components are where the trade sits.
The report includes weekly crude oil inventories with consensus at 0.2 million barrels against a prior 17.423 million, alongside weekly heating oil stocks with a prior of 0.192 million, weekly crude imports at a prior 1.768 million, refinery crude runs at a prior 0.026 million, and weekly gasoline production at a prior -0.001 million.
Refinery runs are the swing variable. High runs since mid-April drove the consistent crude declines that preceded the August build, and they are being pulled higher by a diesel crack at a record $102.20. If runs stay elevated, crude draws resume and product builds — which eventually compresses the crack that is driving the runs in the first place.
If runs moderate, crude builds and the crack holds. Those are the two paths and today's numbers indicate which one is operating.
Import and export flows are the second component. The August 7 build came almost entirely from a 1.14 million barrel per day import increase paired with a 627,000 barrel per day export decline. That combination reflects U.S. barrels unable to find international buyers at prevailing freight rates and insurance costs — a direct consequence of the shipping disruption rather than a domestic demand signal.
Distillate stocks near 23-year lows are the number that would move the market most. A further draw with the crack already at $102.20 would signal a genuine product shortage entering the fourth quarter, when heating demand adds seasonal pull. A build would be the first evidence that record margins are pulling enough supply through the system to relieve the squeeze.
Propane inventories reached record highs in late 2025 and are expected to remain above average through 2026, peaking in October before the winter drawdown. Elevated levels place downward pressure on U.S. propane prices while increasing exports as Asian buyers replace lost Persian Gulf supply.
That is the one corner of the barrel where American supply is genuinely long, and it has become an export opportunity created by the same disruption pressuring everything else.
The Fed Minutes Matter for Oil Too
The 2:00 p.m. ET release of the July FOMC minutes is not usually an energy event. This week it is, because the inflation channel runs directly through crude.
The Federal Reserve held at 3.50%–3.75% on a 9–3 vote at the July 28–29 meeting, with three regional presidents dissenting in favor of a hike. September hike odds sit near 33%, down from roughly 44% a week earlier after July CPI eased to 3.4%, PPI came in flat, retail sales fell 0.6% and payrolls showed job losses.
Energy is what threatens that repricing. Higher crude feeds directly into headline inflation, and inflation has been parked above the 2% target for five straight years. BMO flagged energy as the primary bearish trigger for Treasuries specifically because yields have refused to fall despite softer data — and the 30-year printed 5.338% this week, a 19-year high.
The circularity is uncomfortable. Rising oil pushes inflation expectations higher, which pushes the Fed hawkish, which strengthens the dollar, which mechanically pressures dollar-denominated crude. Deutsche Bank has warned that the combination of a negative hit to both growth and inflation could hit equities and bonds simultaneously — and an energy shock delivers exactly that combination.
The dollar has been the offsetting tailwind. DXY fell toward 99.00 Wednesday, its weakest since June 1, down 0.65% on the session and 1.52% over four weeks. A softer dollar makes crude cheaper for non-dollar buyers and supports demand at the margin.
A hawkish minutes release reverses that, lifts the dollar back toward the 99.89 to 100.19 moving-average cluster, and caps crude's fourth-session advance at the $85.61 to $86.82 target zone.
Jackson Hole follows August 27 to 29 with Warsh delivering his first keynote as chair on August 28. July PCE lands August 26. The September FOMC on the 15th and 16th carries a fresh dot plot.
Oil is the input every one of those events has to account for, and it is the only variable none of them controls.
The Forecast: Levels, Triggers and the Verdict
The base case is that WTI holds $83.79 and tests the $85.61 to $86.82 target zone into the inventory print and the minutes.
The bull sequence is defined. Pierce $86.82 and the advance extends toward the $89.64 to $90.05 zone, with $90.56 as the confirmation level. Above $90.56, WTI has open structure toward the mid-$90s. On Brent, holding $90.17 keeps $93.78 in play, and clearing that opens $97.30 — which brackets the $96.80 July high on North Sea Dated. Above $97.30 the April high near $128 becomes the reference rather than the fantasy.
The triggers: a distillate draw confirming the $102.20 crack has further to run, a crude draw larger than the 0.2 million barrel consensus, another vessel attack in Hormuz, or a dovish minutes release that keeps the dollar at 99.00.
The bear sequence starts at $83.79. Losing that trend reference opens $80.94 to $80.54 — a 5.2% air pocket with nothing structural in between. Below $80 the EIA's third-quarter Brent average of $85 becomes the ceiling rather than the target, and J.P. Morgan's $78 end-2026 figure becomes the operative forecast.
The triggers on that side: a second consecutive large U.S. crude build echoing the 17.4 million barrel print, evidence that the Iran-Oman shipping arrangement is progressing, a hawkish minutes release lifting the dollar off 99.00, or any confirmation that the assumed October normalization of Hormuz exports is on track.
The verdict: the crude market has stopped trading the headline and started trading the arithmetic. Supply is 6.3 million barrels per day below year-ago levels with 8.3 million shut in behind Hormuz, and Brent still sits 28% below its April high because demand is falling 1.6 million barrels per day and producers have spent five months building routes around the chokepoint. Global stocks at 7.9 billion barrels and backwardated curves say the tightness is real. A 17.4 million barrel U.S. build and a $6.60 Brent-WTI spread say it has not reached America.
Base case targets $86.87 on WTI and $93.78 on Brent through the inventory print. Failure at $83.79 targets $80.54. The higher-conviction position is not in the barrel at all — it is in the $102.20 diesel crack against 23-year-low distillate inventories, and it stays that way until refinery runs build enough product to break it.