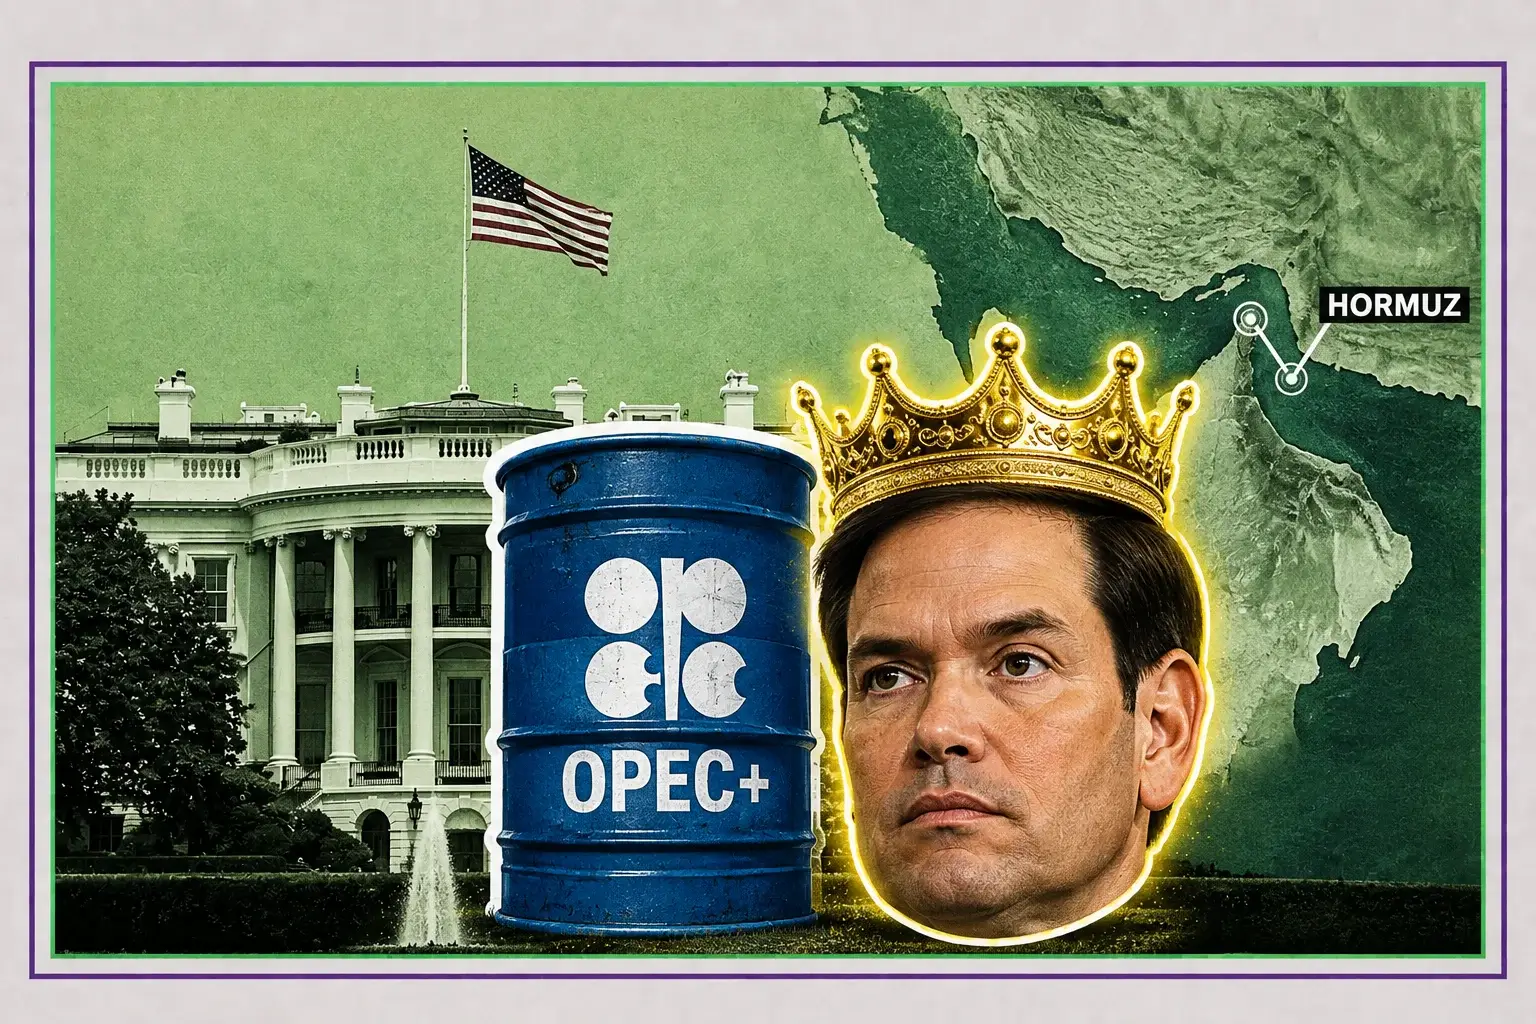
Brent at $90 and WTI at $84 Price a $6 War Premium as the SPR Sits at 1982 Lows
Crude has gained for three straight sessions after Trump rejected extending the Iran truce and threatened Oman | That's TradingNEWS
Key Points
- Brent trades $90.97 (+0.11%) and WTI $84.39 (+0.78%), a third consecutive session of gains.
- Hormuz transits fell to five vessels Saturday and zero Sunday, versus 31 the prior weekend.
- The EIA forecasts Brent averaging $85 in Q3 2026, falling to $69 across 2027.
Brent crude traded $90.97 per barrel Tuesday, up 0.11%, after climbing above $91 for a third consecutive session of gains. The contract opened at $91.02 and has now run for three days without a down close. September West Texas Intermediate traded $84.39, up 63 cents or 0.78%, with intraday prints reaching $85.18.
Monday delivered the bulk of the move. WTI rose 3.09% to $84.95 as the market priced the expiration of the 60-day memorandum of understanding between Washington and Tehran, signed in June and intended to give both sides room to negotiate a longer-term agreement. It expired Monday with no replacement.
Brent is up 1.96% over the past month and 38.27% over twelve months. WTI is up 2.99% on the month and 35.49% on the year. September RBOB gasoline rose 1.01% to add 3.16 cents.
The trailing three weeks have been violent in both directions. Brent fell back to roughly $80 on August 4 as optimism over a draft US-Iran agreement drained the risk premium. September WTI printed $78.08 on Friday, August 7, down $8.72 or 10.05% on the week. Brent then surged more than 7% during August 10 to 14, closing that week at $88.60 with WTI at $81.12. The recovery from the August 7 low to Tuesday's print covers $7.10 on WTI, or 9.1%, in seven sessions.
July delivered a gain of more than 20% before that whipsaw.
The 52-week range frames the volatility. WTI has traded from an intraday low of $54.97 on December 17, 2025 to an intraday high of $119.47 on March 9, 2026 — a $64.50 band, or 76% of the current price. Tuesday's $84.39 sits 41.5% above the low and 29.4% below the high.
Money managers have reduced bullish positioning on both Brent and WTI over the past two weeks, which means this rally is running without a build in speculative length behind it.
Equity markets absorbed the transmission directly. European shares fell on the crude move, with the Stoxx 600 down 0.51%, and S&P 500 futures dropped 0.51% with the 30-year Treasury yield printing 5.323%.
Hormuz Transits Collapsed to Zero on Sunday
The physical data is the most important input on the tape, and it deteriorated sharply over the weekend.
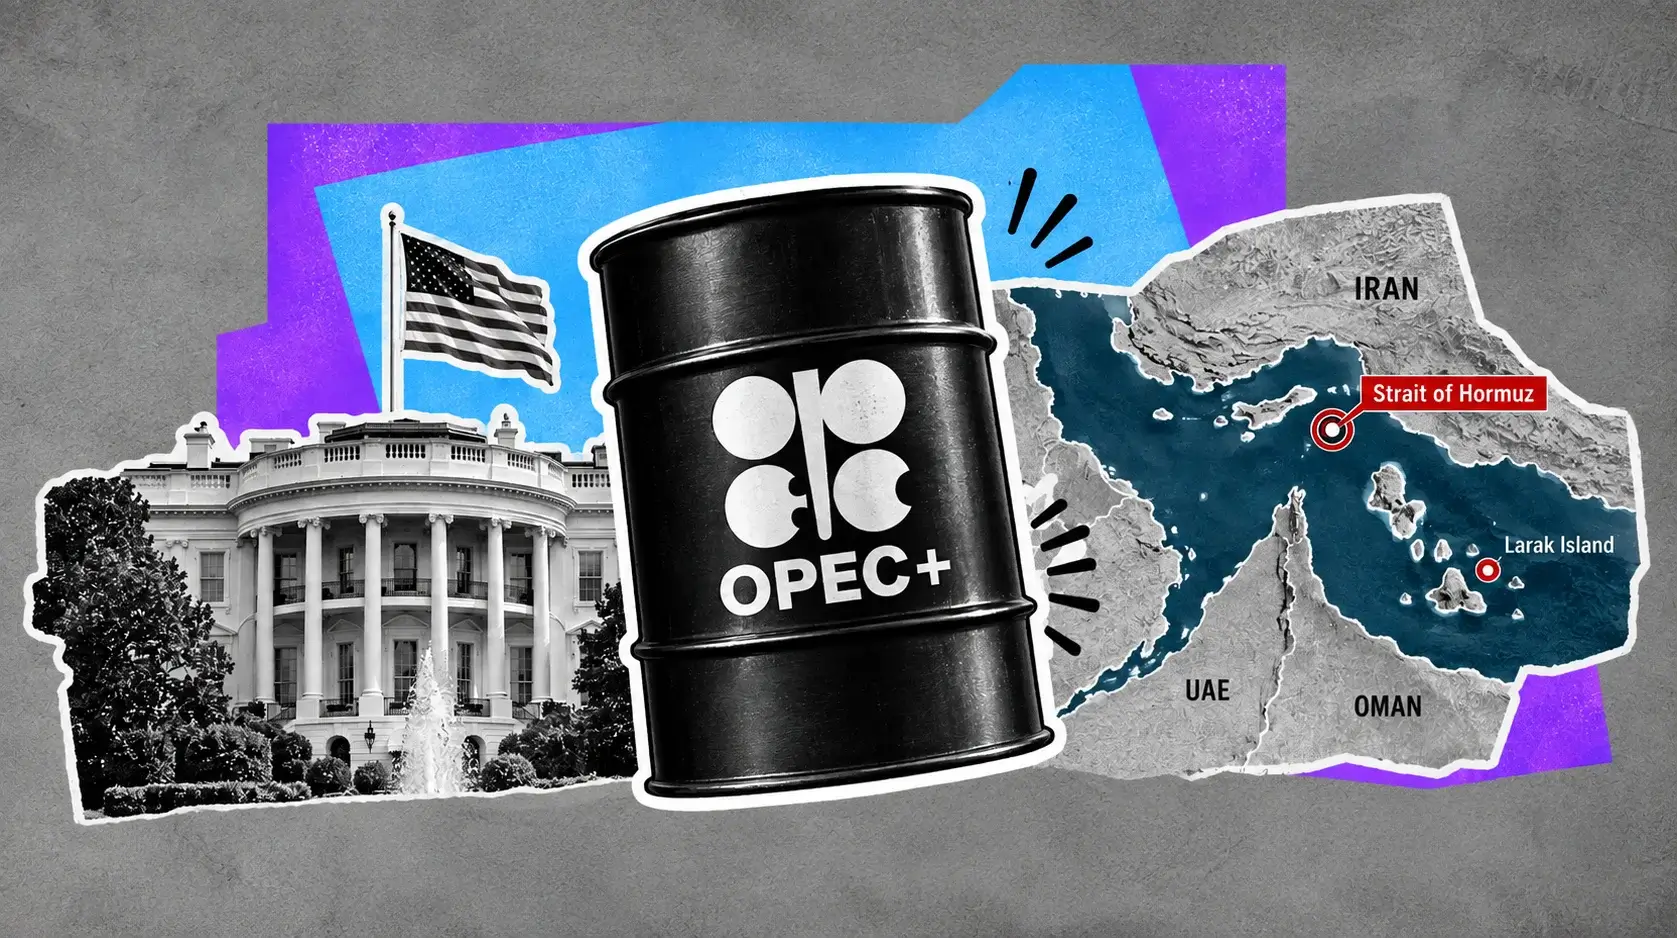
Only five commodity vessels transited the Strait of Hormuz on Saturday. Zero transited on Sunday. That compares with 31 during the previous weekend — a collapse of better than 90% in a single week.
Two Abu Dhabi National Oil Company vessels, among the few still successfully moving crude through the strait, were attacked late Thursday. That attack is what broke the transit count, because it removed the assumption that any operator could route through the waterway without direct targeting.
Private businesses tracking shipments estimate current flows out of the Strait of Hormuz at up to 5 million barrels per day at best, against roughly 9 to 10 million barrels per day for the entire Middle East region. Hormuz normally carries around a fifth of global seaborne crude. Running at 5 million barrels per day against a pre-conflict baseline that ran materially higher means several million barrels of daily throughput have been rerouted, shut in, or simply stopped.
Iran continues targeting tankers that disregard its demands, and vessel traffic has fallen accordingly. The White House has signalled an indefinite naval blockade posture, which raises the insurance and freight cost of every remaining transit without restoring volume.
Iran and Oman are negotiating an arrangement for managing shipping through the strait. The United States is not party to those talks and is unlikely to back any deal that fails to guarantee unrestricted passage.
Alternative routing is expanding at the margins. Saudi crude is moving west across the country to Yanbu and then north, a path that adds distance and cost but bypasses the chokepoint. Libya and Egypt are reviving an 800-kilometre pipeline linking Tobruk to Alexandria, likely starting at 150,000 to 250,000 barrels per day.
Those workarounds move hundreds of thousands of barrels. The chokepoint moves millions.
Despite the transit collapse, the absence of a confirmed major supply outage has limited further gains. That is the market's current judgment: disruption priced, catastrophe not.
Trump Rejected the Extension and Threatened Oman
The diplomatic track closed Monday, and the sequence matters for anyone modelling the risk premium.
President Trump stated he was not interested in extending the interim peace deal with Iran. The memorandum of understanding signed in June, structured to give both sides 60 days to negotiate a durable agreement, expired without replacement. Trump said he intends to inflict further economic pain on Tehran and is preparing new sanctions aimed at forcing Iranian capitulation.
He repeated his position on declaring the Strait of Hormuz US territory and threatened to bomb Oman if it interferes with US plans for the waterway — a threat aimed at the country currently mediating the shipping arrangement Washington has excluded itself from.
Iranian Foreign Minister Abbas Araqchi stated Tehran has not decided whether to resume talks with the United States. A senior Iranian official separately warned that the country would shift to a fully offensive military posture if diplomacy fails, and would escalate in the strait.
Israel launched fresh strikes on Lebanon over the weekend, killing 11 people including a senior Hezbollah commander. That opens a second front in the risk calculation and reduces the probability of any regional de-escalation.
Trump urged Americans to accept somewhat higher gasoline prices while the conflict continues — a statement that removes the domestic political constraint that has historically capped how long an administration tolerates elevated crude. He is separately weighing another suspension of the Jones Act to ease coastal product logistics.
The pattern through 2026 has been mechanical. Every de-escalation headline has taken $8 to $10 off the barrel within days. The April ceasefire dropped Brent sharply. The early-August draft agreement optimism took Brent to $80 and WTI to $78.08. Every collapse of those talks has restored the premium within a week.
That two-way sensitivity is why positioning has thinned. Money managers cut bullish bets on both benchmarks over the past fortnight because a headline can erase a week of gains overnight.
The truce expiring without replacement removes the nearest de-escalation catalyst from the calendar.
The SPR at 1982 Lows Removes the Ceiling
The US Strategic Petroleum Reserve stands at its lowest level since 1982, and that single fact changes the shape of the entire price distribution.
Coordinated strategic releases have functioned as the implicit ceiling on crude for four years. The 2022 drawdown demonstrated that Washington would deploy hundreds of millions of barrels to cap a geopolitical spike, and traders priced that intervention into every subsequent rally. That mechanism is now unavailable at scale.
Without it, the entire adjustment to a supply disruption has to clear through the futures curve and through demand destruction. There is no buffer between a Hormuz shutdown and the price required to ration consumption.
The reserve's depletion also constrains the policy response to the current situation. An administration urging citizens to accept higher gasoline prices is an administration without the tool it would otherwise use, and the Jones Act suspension under consideration is a logistics workaround rather than a supply addition.
US production growth offers no offset on the timeline that matters. The EIA expects domestic output to rise just 200,000 barrels per day in 2026. Shale producers dominating the Permian are trimming spending plans and taking advantage of higher prices through cash returns rather than volume growth, which is a structural change from prior cycles where $90 crude triggered an immediate rig response.
The total US oil and gas rig count rose modestly last week after holding flat the week prior. That is not a supply surge.
Energy Secretary Chris Wright stated Monday that Middle East oil exports have rebounded to 15 million barrels per day, and Washington will make further announcements on the situation. That figure sits above the 9 to 10 million barrels per day private trackers estimate for the region, and the gap between official and private estimates is itself a market variable.
The asymmetry is what matters for the forecast. Downside from here requires a diplomatic breakthrough. Upside requires only that the current disruption persist, and the mechanism that historically capped it no longer exists.
EIA Cut Its Assumptions: 0.6 Million Barrels Per Day Disrupted Through 2027
The Energy Information Administration released its Short-Term Energy Outlook on August 11, with the forecast completed August 6, and the revisions were explicit.
The agency increased its estimates of Middle East shut-in crude production for the coming months relative to the July forecast, citing continued severe constraints on Strait of Hormuz transits which it assumes persist through August. It expects most regional production to return to near pre-conflict averages in early 2027, but forecasts ongoing disruptions of approximately 0.6 million barrels per day continuing through the end of next year.
That is a structural, multi-year impairment rather than a temporary outage.
On price, the EIA forecasts Brent to average around $85 per barrel in the third quarter of 2026, based on the assumption that reduced Hormuz shipments lower global inventories further and keep crude near early-August levels. As inventories rebuild with most production recovering by early 2027, the agency expects Brent to fall gradually to an average of $69 per barrel in 2027.
Brent at $90.97 currently trades $5.97 above the EIA's third-quarter average forecast, which means the market is pricing more disruption than the agency's base case assumes.
The 2027 projection at $69 implies a 24.2% decline from spot over roughly eighteen months, contingent entirely on regional production normalizing. The full outlook is published on the EIA Short-Term Energy Outlook page, with the next release scheduled for September 9.
Prediction market pricing has clustered around similar levels, with the August WTI contract carrying $7.33 million in traded volume and the broader crude complex running more than $24.4 million.
The gap between the EIA's $85 Brent average and Tuesday's $90.97 is the risk premium the market has added since the forecast was completed on August 6 — before the Abu Dhabi tanker attacks, before the transit collapse to zero, and before the memorandum expired.
That premium is roughly $6, or 7%, and it is the number that unwinds first on any diplomatic progress.
US Commercial Crude Below the Five-Year Low Through Year-End
The inventory picture is the tightest input in the entire complex and receives the least attention.
The EIA expects US commercial crude oil inventories to remain below the five-year 2021–2025 low through the end of 2026. That is not below the five-year average — it is below the lowest reading in five years, sustained for another four and a half months.
Three forces produced it. Crude oil exports increased as international buyers sought barrels outside the disrupted Middle East. Imports fell as global supply tightened. Refinery runs have stayed high since mid-April. Together those have driven consistent weekly declines in domestic crude stocks.
Net imports are forecast to remain below average through 2027 due to strong international demand for US crude exports. That means the domestic inventory cushion does not rebuild even as the price incentive to store rises.
The counterexample came in the week ending July 31, when inventories built 2.5 million barrels. That print coincided with the early-August price collapse toward $80 Brent and $78 WTI, and it was the exception rather than the trend.
Wednesday's weekly EIA inventory report is the nearest scheduled catalyst for the complex. A draw against a base already below the five-year low reinforces the tightness argument. A build repeats the late-July pattern and hands the bears a data point.
The structural read is straightforward. A market where the largest consumer holds crude inventories below its five-year floor, holds strategic reserves at a 1982 low, and imports below average has no domestic buffer against a supply shock. Every barrel of disruption transmits directly to price.
The offset is refined product. High refinery runs mean product inventories have absorbed some of the crude drawdown, and Trump's consideration of a Jones Act suspension addresses coastal distribution rather than aggregate supply.
Diesel supplies roughly 22% of US transportation energy, which makes distillate the pressure point if the tightness moves down the barrel.
OPEC+ Completed the Restoration of the 2023 Cuts
OPEC+ approved a modest production increase in early August, completing the planned restoration of the output cuts introduced in 2023. That is the supply-side offset to the geopolitical premium, and it is now exhausted.
The significance is what it removes rather than what it adds. For three years, the group held spare capacity that could be deployed against a price spike, and that spare capacity functioned alongside the SPR as a second implicit ceiling. Completing the restoration means the barrels held back since 2023 are now in the market. Further increases require new capacity rather than the release of withheld volume.
The producers with meaningful spare capacity sit predominantly in the Gulf, which is precisely the region whose export routes are constrained. Spare capacity behind a chokepoint is not spare capacity in any operational sense.
Long-term damage to Gulf production infrastructure is believed to be minimal — the disruption is logistical rather than physical, which supports the EIA's assumption that most output returns to pre-conflict levels by early 2027. It also means the barrels exist and would return quickly if Hormuz reopened, which is the bear case in a single sentence.
The group's own institutional future adds uncertainty. OPEC has trimmed its 2026 demand forecast alongside the IEA, and coordinated management of a market where the primary constraint is a shipping lane rather than a quota is outside the organization's traditional toolkit.
Non-OPEC supply additions are marginal. The Libya-Egypt pipeline revival at 150,000 to 250,000 barrels per day is real but small. US production growth of 200,000 barrels per day for the full year does not move a global balance. Russian export capacity has its own constraints.
Global mine-to-market arithmetic leaves the balance dependent on Hormuz throughput, and Hormuz throughput is running at roughly half its normal level on the most generous private estimates.
That is why the curve holds a premium despite completed OPEC+ restoration and downgraded demand forecasts.
The IEA Cut Demand and the Market Cut Positioning
The International Energy Agency cut its global oil demand forecast, citing the prolonged conflict and elevated prices. OPEC trimmed its own 2026 demand projections to account for higher fuel costs and weaker consumption.
Those revisions are the demand-side counterweight to every supply argument in this analysis, and they have already produced price action. Oil futures retreated approximately 2% in a recent session as anxiety over softening demand overshadowed the ongoing US-Iran tensions — the first clear instance this cycle where the demand narrative beat the supply narrative on the tape.
Money managers have acted on it. Bullish bets on both Brent and WTI have been reduced over the past two weeks. That positioning shift is significant because it means the rally from $78.08 on August 7 to $85.18 Tuesday happened without speculative accumulation behind it, driven by physical tightness and headline risk rather than by fund flows.
Thin speculative length cuts both ways. It removes the crowded-long vulnerability that has amplified prior selloffs — the 10.05% weekly collapse in early August came partly from liquidation of exactly that positioning. It also means there is no committed capital defending current levels if a diplomatic headline lands.
The demand destruction case has a documented precedent this cycle. The market rebalanced through larger-than-expected demand losses and smaller-than-expected OECD commercial inventory draws, with China serving as the clearest example of consumption responding to price. Forward Brent projections have been marked down accordingly, with $86 for the third quarter, $80 for the fourth, and $78 at year-end representing a material cut from a prior $95 year-end path.
That trajectory and the EIA's $69 for 2027 describe the same conclusion from different models: the current price is a disruption premium, not a demand-driven level, and it decays as logistics normalize.
The question is timing. Every week Hormuz runs at zero-to-five transits pushes the normalization date further out and keeps inventories drawing.
Backwardation and What the Curve Is Pricing
Futures have held backwardation despite weekly volatility, and the curve structure is the cleanest read on physical tightness available.
Backwardation means prompt barrels trade above deferred barrels — buyers are paying a premium for immediate delivery rather than for storage. It is the market's direct statement that supply is constrained now and expected to loosen later, and it is entirely consistent with an inventory picture running below the five-year low.
The curve shape aligns with the forecast path. Spot Brent at $90.97, an EIA third-quarter average of $85, a fourth-quarter path toward $80, and a 2027 average of $69 describes a downward-sloping forward curve — backwardation extended across the whole horizon.
That structure carries a mechanical consequence for anyone long the commodity through futures. Rolling a position in backwardation generates positive carry, which supports long exposure even without price appreciation. It also penalizes storage, which discourages the inventory build that would eventually cap the price.
The next Brent settlement date is August 28. September WTI is the active contract, trading at $84.39 against Brent at $90.97 for a spread of $6.58. That differential is wider than the historical norm and reflects the geographic split: Brent prices the disrupted seaborne market, WTI prices a landlocked US benchmark with domestic production and pipeline access.
Technical readings on Brent futures register a strong buy on the daily signal, with the market having reclaimed the $88 to $89 zone that capped it through early August.
The volatility is structural. The standard WTI contract covers 1,000 barrels, so a full-dollar move is worth $1,000 per contract; the micro covers 100 barrels at $100 per dollar. In a market that has moved $8.72 in a week and 10.05% in five sessions, position sizing dominates directional accuracy.
Prediction market volume of $7.33 million on the August WTI contract confirms active two-way interest rather than a one-sided consensus.
The Demand Destruction Case: China, Freight and $91 Brent
The bear case does not depend on Hormuz reopening. It depends on $91 Brent destroying enough consumption to rebalance the market on its own.
China provided the clearest case study this cycle. The rebalancing that followed the initial conflict spike came predominantly through demand losses rather than through the inventory draws forecasters expected, with Chinese consumption responding faster and harder to elevated prices than models assumed. That composition difference is why forward price forecasts were cut from a $95 year-end path to $78.
The mechanism is arithmetic. Every $10 increase in crude subtracts roughly 0.3% from the GDP of a net-importing economy and adds approximately 0.5% to headline inflation. Brent has run from roughly $72 in early July to $90.97 Tuesday — a $19 move that maps to nearly 1.0 percentage point of added inflation and 0.6 points of subtracted growth across the importing world.
Europe absorbs that directly. The eurozone imports its energy and just posted July inflation accelerating to 2.9% with core at 2.5%. The ECB is now roughly 84% priced for a September hike, which is monetary tightening caused by oil that then destroys the demand that caused it.
The United States is more insulated as a producer but not immune. July retail sales fell 0.6% against expectations for a 0.1% gain. Consumer sentiment dropped to 51.0 from 55.2. Housing starts collapsed 12.4%. Those are the rate-sensitive channels contracting, and gasoline prices at levels the President is publicly asking citizens to accept feed the same squeeze.
Structural demand headwinds compound it. Freight automation could meaningfully reduce diesel consumption over time, and diesel supplies 22% of US transportation energy.
The countervailing force is that demand destruction takes quarters while supply disruption is immediate. Hormuz at zero transits on a Sunday moves price today. Chinese refiners cutting runs shows up in monthly data.
That timing mismatch is why the curve holds a premium in the front and a discount in the back.
Read More
-
Yen Stalls at 160 Despite a 3% JGB and Tokyo Core CPI at 2.0% — Intervention Sits at 164, Friday's Payrolls Decide
02.09.2026 · TradingNEWS ArchiveEnergy
-
PAGS Shares Gap From $9.02 to $10.76 as Ibovespa Rallies 8.76% and Selic Cut Bets Build — $14 Upside Case
05.10.2026 · TradingNEWS ArchiveStocks
-
Bitcoin Stalls Under $87,400 as Shorts Get Squeezed and Strategy Buys 334 BTC — Breakout Opens $90K to $95K
05.10.2026 · TradingNEWS ArchiveCrypto
-
Gold ($4,158) Rebounds Off $4,110 2-Month Low but High Yields Block $4,230 — Downside Risk to $4K Before Recovery
05.10.2026 · TradingNEWS ArchiveCommodities
-
S&P 500, Nasdaq and Dow Futures Dip as 5.28% Yields Test Friday's Rally; PTC Soars 36%, INTC Falls 3.9%
05.10.2026 · TradingNEWS ArchiveMarkets
-
Euro at 1.1205 Extends a 3% Four-Week Slide as OAT Yields Near 5% and the ECB Signals an October Pause — 1.1096 in Sight
05.10.2026 · TradingNEWS ArchiveForex
Refined Products: Russian Diesel Exports at 80,000 Barrels Per Day
The crude headline understates what is happening down the barrel, and refined products are where the tightness has become acute.
Russian diesel and gasoil exports crashed to just 80,000 barrels per day during the first seven days of August. That is a collapse from a baseline measured in the hundreds of thousands, and it removes a major supply of middle distillates from the international market at the same time Middle East logistics are constrained.
Diesel is the product that matters most for economic transmission. It moves freight, powers agriculture, and runs industrial equipment, and it supplies roughly 22% of US transportation energy. Distillate tightness passes through to goods prices faster than gasoline tightness passes through to consumer sentiment.
US refinery runs have stayed high since mid-April, which is what has drawn crude inventories below the five-year low. Those runs have kept product supply adequate domestically while draining the crude cushion — a trade that works until refiners hit maintenance season or feedstock becomes the binding constraint.
September RBOB gasoline rose 1.01% Tuesday, outpacing crude's 0.78% gain, which indicates the product crack is widening rather than compressing. Refiners are capturing margin, and that margin is the market's signal that product supply is tighter than crude supply.
The warning that the world is running short on fuels rather than on crude was first raised by analysts watching the physical market, and the Russian export collapse plus constrained Middle East refining validates the framing.
The Jones Act suspension Trump is weighing addresses exactly this problem. It would allow foreign-flagged vessels to move product between US ports, easing East Coast supply where refining capacity is thin and pipeline access is limited.
Trump's request that Americans accept somewhat higher gasoline prices is the political acknowledgment that the product side has no quick fix.
For crude pricing, high refinery runs are a demand source. If margins compress or runs fall, crude loses a buyer.
The Macro Transmission: 5.323% Long Bonds and a $91 Barrel
Crude at $90.97 is no longer just an energy story. It is the primary input into the global rate complex, and that feedback loop is the most important development in this market.
The 30-year Treasury yield printed 5.323% Tuesday, the highest since 2007 and a nineteen-year high. The 10-year hit 4.72%. Long-dated sovereign yields rose across every major market simultaneously. Rising oil feeds inflation expectations, inflation expectations feed the long end, and the long end compresses every risk asset.
The German 10-year Bund reached 3.21%, its highest since May 2011, with markets pricing an ECB rate hike in September driven explicitly by energy costs. ECB President Christine Lagarde has stated that the longer energy prices stay elevated, the more likely they drive broader inflation through second-round effects.
In the US, the Federal Reserve holds at 3.50% to 3.75% with September hold odds at 69.9%, but that pricing was built on soft consumption data rather than on benign inflation. Brent sustaining $91 into the September CPI print reverses it.
Equities took the damage Tuesday. S&P 500 futures fell 0.51%, Nasdaq-100 futures dropped 1.31%, and the Cboe Volatility Index rose 3.69% to 15.75. Gold fell 0.61% to $4,389.83 as real yields rose faster than the geopolitical bid could absorb.
That last correlation is the tell. Gold selling off during a Middle East escalation with crude at $91 means the market is trading this as a rates event, not as a risk event.
Wednesday's FOMC minutes and Friday's Jackson Hole opening remarks from Fed Chair Kevin Warsh are the events that price it. Any acknowledgment that energy-driven inflation requires a policy response repositions the entire curve.
The feedback loop closes on itself. Higher oil forces tighter policy, tighter policy destroys demand, weaker demand eventually lowers oil. The lag between the first step and the last runs two to three quarters.
Weekly EIA inventories land Wednesday alongside the minutes.
Oil Price Forecast: $85 and $100 Are the Boundaries
The forecast reduces to two levels on Brent and the single variable that decides which one prints.
Upside case. Brent at $90.97 has cleared $91 intraday for three consecutive sessions and needs a daily close above $91.76 — the session high — to confirm the breakout. Above that, $95 is the next round-number reference and the level Brent traded during the March spike toward the $119.47 WTI high. A confirmed supply outage rather than a transit slowdown puts $100 in play, and prediction market participants have positioned for that tail. The required inputs are already largely in place: Hormuz transits at zero to five vessels per weekend, the memorandum expired, no diplomatic channel with US participation, an SPR at 1982 lows, and OPEC+ spare capacity exhausted and located behind the chokepoint.
Base case target for August: $95. Bullish target on a confirmed outage: $100 to $105.
Downside case. Brent losing $88.60 — last week's close and the level that capped the early-August range — opens $85, which is the EIA's third-quarter average forecast and the market's fair value absent a premium. Beneath that, $80 marks the August 4 low where draft-agreement optimism took the contract, and $78.08 was the September WTI print on August 7. The trigger is diplomatic: any credible Hormuz arrangement between Iran and Oman that Washington accepts erases $6 to $10 within days, as it did twice already this cycle.
Downside target on a diplomatic breakthrough: $85 initially, $80 on confirmation.
The structural anchor is the EIA path — $85 average for the third quarter, falling to $69 for 2027 as most regional production normalizes by early next year, with residual disruption of 0.6 million barrels per day persisting through 2027. Brent at $90.97 trades $5.97 above that third-quarter average, and that $6 gap is the entire war premium.
Verdict: this is a logistics premium, not a scarcity premium. The barrels exist and Gulf production damage is minimal — they cannot move. That distinction means the downside is violent and headline-driven while the upside is grinding and physical. WTI at $84.39 and Brent at $90.97 hold while transits stay below ten vessels per weekend. Reopen the strait and both benchmarks give back $10 inside a week.