INTC ($95.14) Rebounds as 59% Data Center Growth Meets a 63x Valuation — $109 Target Opens Above $103
Intel’s 18A output runs 25% above target and Q3 guidance calls for $15.8–16.8B in revenue | That's TradingNEWS
Key Points
- Intel rose 5.89% to $95.14, adding $28 billion in value after a 6% drop to $89.85 on Friday.
- Q2 2026 revenue grew 25% to $16.13 billion, led by 59% growth in Data Center and AI.
- Intel trades below its 50-day average at $103.05 and its 200-day average at $101.31.
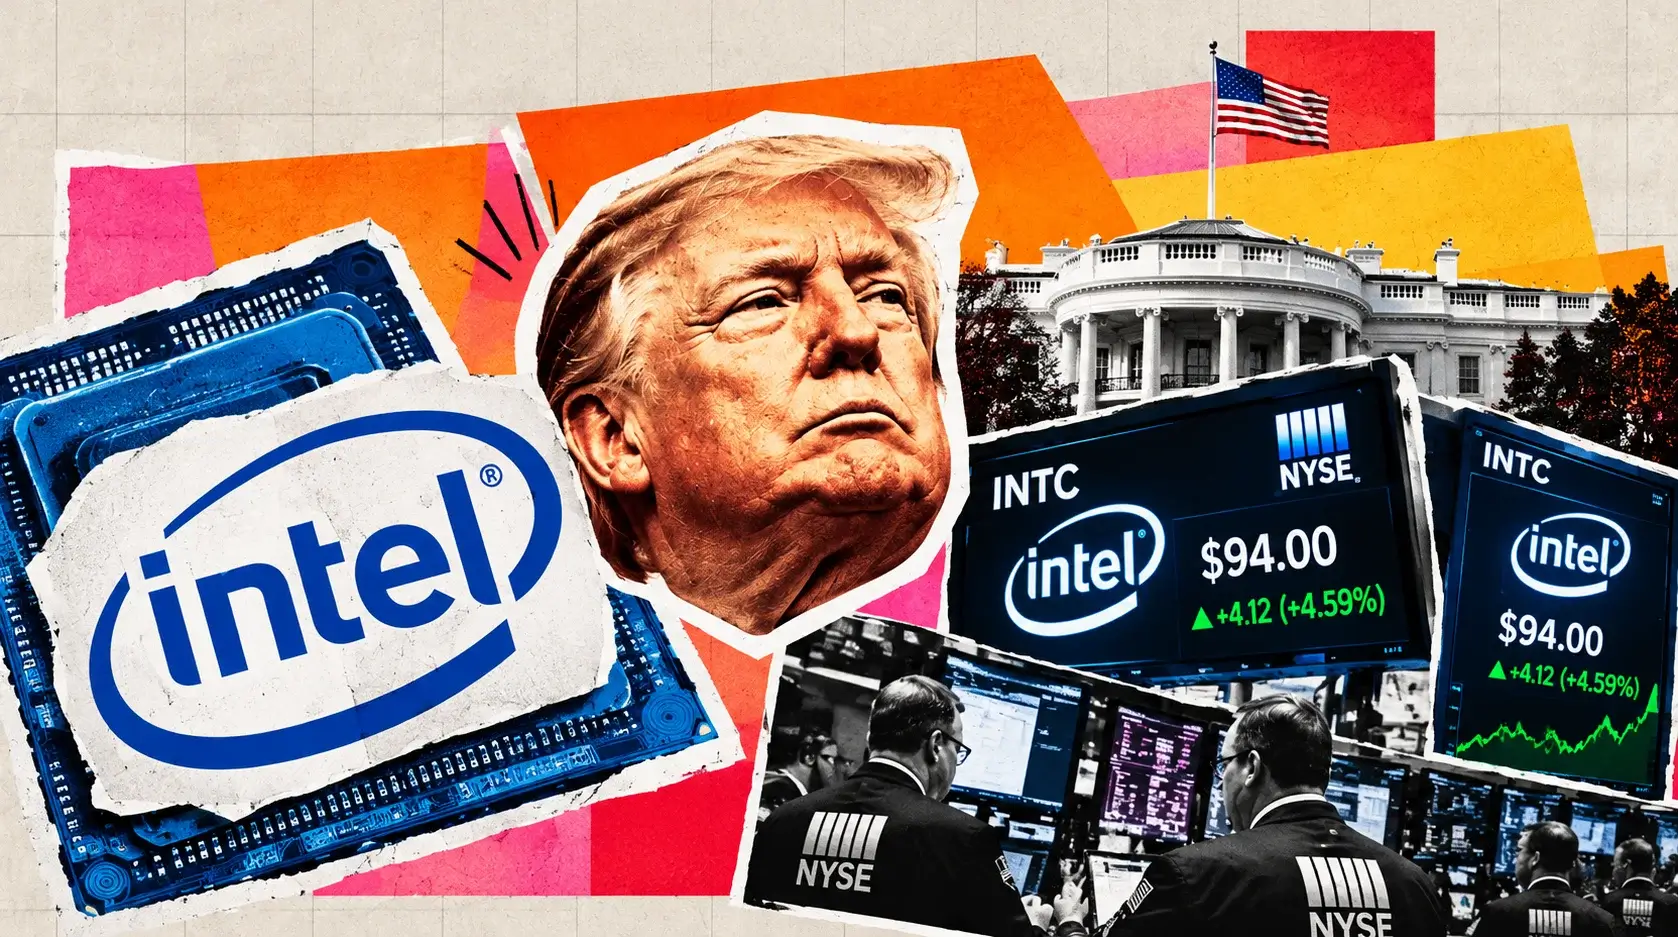
Intel (NASDAQ:INTC) rose $5.29, or 5.89%, to $95.14 by 11:26 a.m. ET on Monday, October 19, 2026, and was the most actively traded stock in the U.S. market by late morning with 42.8 million shares changing hands. The move added $28 billion in market value and lifted Intel’s capitalization to $502.92 billion. It also snapped a three-session losing streak that ended with a 6% drop to $89.85 on Friday.
The immediate trigger was an upgrade to Neutral from Underweight, with an unchanged $85 price target, from a desk that had held a bearish stance on the stock for close to four years. The reasoning was valuation, not a change in the operating view. After a 36% slide from the June peak, the downside implied by the $85 target had shrunk enough to make the risk and reward look balanced. The same note flagged a few more quarters of server market-share losses ahead.
That combination tells you what Monday’s rally is. Intel is now trading 12% above the price target of the analyst who just upgraded it. The stock did not jump because someone found new upside. It jumped because one of the loudest bears stepped aside, and a heavily traded, heavily debated stock with a large short base and a 36% drawdown reacted to the removal of selling pressure.
The broader tape helped. The Nasdaq Composite rose 1.67% to 26,575.38, a gauge of large semiconductor stocks climbed 2.3% in the first hour, and the VIX fell 11.36% to 17.72 after last week’s 4.5% Nasdaq sell-off, its worst week since June. Nvidia rose 2.02% to $218.45, and AMD climbed alongside Intel.
The thesis of this forecast is narrow. Intel’s fundamentals have turned decisively better in 2026, with second-quarter revenue up 25% to $16.13 billion, the fastest growth in more than 15 years, and data center revenue up 59%. The stock already priced much of that improvement when it rallied to $142.35 in June. At $95.14 it sits below both its 50-day moving average at $103.05 and its 200-day average at $101.31, in a technical downtrend, with an earnings report on October 29 that has to justify a valuation of more than 60 times forward earnings.
Monday’s bounce changes the short-term tape. It does not change the setup. The $101 to $103 zone is the wall Intel must clear to restore its uptrend, and the October 29 print is the event that decides whether it can.
From $32.89 to $142.35 and Back to $89.85: The 2026 Round Trip
Intel’s 52-week chart reads like two separate stocks. The first half of the year delivered one of the largest rallies by any megacap in the market. The stock’s 52-week low sits at $32.89, and by June it had reached $142.35, a gain of 333%. The second half has been a steady unwind.
The scale of the reversal sets the context for Monday’s move. Friday’s close at $89.85 sat 36.9% below the June high. Even after Monday’s rally to $95.14, Intel trades 33.2% below its peak. The stock is still up 135.83% over 52 weeks and has gained 143% year to date through Friday’s close, rising to 157% with Monday’s move, so the drawdown has erased a portion of the rally rather than all of it.
Volatility explains the range. Intel has posted 66 daily moves larger than 5% over the past year. Monday’s 5.89% gain is the 67th. A stock that moves 5% in a day more than once a week on average is trading on momentum and positioning rather than on steady fundamental repricing. Large daily swings in both directions are the norm.
The last week shows how quickly sentiment can swing. On October 16, three sessions before Monday, Intel dropped 4.5% as investors weighed rising borrowing costs and Fed remarks emphasizing price stability over rate cuts. Friday added a 6% decline to $89.85 as the AI and semiconductor complex sold off on concerns about debt-financed data-center spending. Two sessions erased more than 10% of Intel’s value. Monday recovered half of that.
The European listing confirmed the U.S. move. Intel traded at €83.82 in Germany at 4:35 p.m. CEST, up 5.57% from the €79.40 Xetra close on October 16, against a 52-week range of €28.93 to €122.86.
The CEO’s own trade gives a reference point. Lip-Bu Tan bought roughly $10 million of Intel stock in August at $95 per share. Monday’s late-morning price of $95.14 sits within 14 cents of that purchase. The CEO’s entry level has become a visible line in the sand: above it, his August buy is in profit, and below it, it is underwater.
The round trip matters for positioning. Investors who bought in the first half are sitting on large gains and have shown a willingness to take profits on every rally. Investors who bought near the June peak are underwater by a third and are likely sellers as the stock approaches their cost basis. Both groups create supply between $100 and $142.
Technical Picture: Below the 50-Day at $103.05 and the 200-Day at $101.31
Intel’s daily chart carries a bearish structure despite Monday’s rally. The stock trades below its 50-day simple moving average at $103.05 and below its 200-day simple moving average at $101.31. The 50-day sits above the 200-day for now, but the gap has narrowed to $1.74, and the shorter average is falling faster. A cross of the 50-day below the 200-day, the pattern traders call a death cross, is within reach if the stock fails to recover the $100 area in the next few weeks.
The $101 to $103 zone is the wall. It combines both moving averages with the $100 psychological level, and it sits $5.86 to $7.91 above Monday’s price. A daily close above $103.05 would put Intel back above both averages and signal that the June-to-October correction has ended. Until that happens, Monday’s move is a counter-trend bounce inside a downtrend.
Support is equally defined. Friday’s close at $89.85 marks the first level, and the $85 price target set by the newly upgraded desk sits $10.14 below Monday’s price. Below that, the recent low near $80 is the level traders are watching as the logical retest if the October 29 report disappoints.
Monday’s volume pattern is mixed. Intel had traded 42.8 million shares by 11:26 a.m. ET, 40% of its 106.98 million three-month average, with 69% of the session still ahead. That pace is above normal without being a blowout. A full-day volume well above 107 million would confirm institutional buying behind the rally. A volume figure near or below average would suggest the move was driven by short covering and tactical traders.
The premarket price action supports the short-covering read. Intel indicated $93.31 before the bell, up $3.59, then traded at $93.68 shortly after the open and $93.84 in early trading before pushing to $94.39 and $95.14 by late morning. The steady grind higher through the morning, rather than a gap that faded, suggests buyers were present throughout. One level traders flagged was volume confirmation above $95, which Monday’s late-morning print reached.
The technical setup reduces to three numbers. Above $103.05, the trend turns bullish and $110 to $115 comes into view. Between $85 and $103, Intel is in a range with a downward bias. Below $85, and especially below $80, the drawdown resumes and the stock risks giving back a larger share of the first-half rally.
Q2 2026: Revenue Up 25% to $16.13 Billion, the Fastest Growth in 15 Years
Intel’s second-quarter results, released on July 23, marked a decisive turn in the company’s operating performance. Revenue rose 25% year over year to $16.13 billion, the strongest growth in more than 15 years and $1.8 billion above the midpoint of guidance. It was the seventh consecutive quarter in which Intel beat its own financial expectations.
The beat was broad. Data Center and AI revenue climbed 59% to $6.26 billion. Client Computing and Physical AI revenue rose 13% to $8.88 billion. Total Intel Products revenue reached $15.14 billion, up 28%. Intel Foundry revenue rose 31% to $5.77 billion, most of it internal. Management said the company’s AI-driven businesses together grew more than 70% year over year and contributed roughly 70% of revenue.
Margins recovered sharply. GAAP gross margin reached 40.4%, up from 27.5% a year earlier, a 12.9-percentage-point improvement. Non-GAAP gross margin hit 41.8%, up 12.1 points from 29.7% and 280 basis points above guidance. Management attributed the upside to higher revenue, better yields and higher average selling prices driven by mix and pricing actions.
Earnings beat by a wide margin on an adjusted basis. Non-GAAP EPS came in at $0.42, double the $0.20 guidance and the $0.21 consensus. GAAP results told a different story: Intel posted a net loss of $11 billion, or $2.16 per share. The loss was driven by a $12.5 billion mark-to-market charge on escrowed shares tied to the company’s CHIPS Act agreement with the U.S. government, a non-cash accounting item rather than an operating loss.
Cash generation was the cleanest signal of improvement. Intel produced $7.0 billion in cash from operations in the second quarter, up from $1.1 billion in the first quarter. That increase gives the company far more room to fund its manufacturing buildout from internal resources.
The first quarter provides the comparison. Q1 revenue reached $13.6 billion, up 7%, with a $3.9 billion goodwill charge, mostly related to Mobileye. Non-GAAP gross margin stood at 41.0%. Sequentially, revenue jumped 19% from Q1 to Q2, a pace that reflects demand outrunning supply rather than a one-time catch-up.
Management’s own commentary underlined the supply constraint. Despite exceeding its expectations for wafer output, the company said strengthening demand continues to outstrip its growing supply across leading-edge logic, wafers, memory and substrates.
Data Center and AI: 59% Growth and the Server Share Question
Intel’s Data Center and AI segment is the engine behind the 2026 turnaround. Second-quarter revenue reached $6.26 billion, up 59% from $3.94 billion a year earlier, with a segment operating margin of 40%. Custom chip revenue nearly tripled over the same period.
The first quarter showed how the growth is being built. Q1 DCAI revenue rose $926 million year over year, driven primarily by $696 million of higher server revenue on a 27% increase in server average selling prices. Server volumes fell 5% over the same period. Intel is growing data center revenue through price and mix rather than unit share, which means it is selling fewer but more expensive server chips.
That pattern sits at the heart of the debate over the stock. The bull case argues that AI is expanding from training into inference and increasingly into agentic and multi-agent systems, which raises the density of general-purpose server CPUs in every data center and gives Intel a structural tailwind. Rising enterprise demand for agentic AI workloads gives Intel additional runway to stabilize its core processor footprint. Intel launched Xeon 6+, its first server-class product on its Intel 18A process, in the second quarter, and it has added rack-scale AI infrastructure and disaggregated inference solutions built on Xeon processors.
The bear case is about share. The upgrade note that sparked Monday’s rally warned that Intel faces a few more quarters of server market-share losses. AMD has taken steady share in data center CPUs, and Arm-based custom chips designed by hyperscalers are growing quickly. Rising prices can offset falling units for a while, but not indefinitely.
Recent partnerships offer a partial answer. Intel enabled support for Meta’s Muse Spark Open AI model, a sign that its processors remain relevant in large-scale AI deployments. Meta’s adoption of Intel processors for its AI model boosted confidence in Intel’s data center position.
The October 29 report will show which side of the debate is winning. The key metrics are DCAI revenue growth against the second quarter’s 59%, server unit volume trends against Q1’s 5% decline, and any commentary on share stabilization in the fourth quarter. A DCAI print above $6.5 billion with flat or rising units would support the bull case. A print below $6 billion or a further unit decline would confirm the share-loss warning.
Intel Foundry: 18A Output 25% Above Target, External Revenue Still Small
Intel Foundry is the most important long-term question for the stock and the area where 2026 has delivered the most technical progress. Second-quarter Foundry revenue reached $5.77 billion, up 6% sequentially and 31% year over year, on higher fab volumes. Intel 18A output came in roughly 25% above target and rose more than 50% from the first quarter.
The milestones are accumulating. Intel 18A-P entered risk production in the second quarter, on the timeline shared with customers and partners a year earlier, extending the 18A platform with better performance, power and thermal characteristics. Intel Foundry entered high-volume manufacturing for a subset of Core Ultra Series 3 processors, code-named Panther Lake, using High NA EUV lithography. On the next node, Intel 14A, the company completed its PDK 0.5 design kit and set PDK 0.9 for October. Volume production on 14A is planned for 2028.
Losses are narrowing. Intel Foundry posted an operating loss of $2.09 billion in the second quarter, $348 million better than the first quarter, as higher yields, faster cycle times and greater scale lowered wafer costs. For context, Foundry lost $10.32 billion in fiscal 2025, or $2.58 billion per quarter on average. The second-quarter loss sits 19% below that run rate.
The weakness is external revenue. External foundry revenue reached $293 million in the second quarter, mainly from Altera, and $467 million across the first half of 2026, including third-party chipmaking and assembly-and-test services. That annualizes to $934 million, a fraction of Foundry’s $23 billion annualized total. Intel’s filings state that it has few external foundry customers to date and name none at the leading edge.
The competitive gap is large. TSMC held 72.5% of global foundry revenue in the second quarter of 2026, and Intel ranked outside the top ten. The external foundry business remains small compared with the industry leader.
One opening is capacity. TSMC’s capacity constraints could divert some orders to Intel Foundry, giving Intel a path to external customers without having to win purely on technology. The upgrade that lifted the stock on Monday identified the external foundry business as the area requiring the most growth.
The October 29 call is the next checkpoint. Any named leading-edge external customer for 18A or 14A, or confirmation that PDK 0.9 was delivered on time this month, would be a direct catalyst. Silence on external customers would keep the foundry thesis in the speculative column.
Q3 Guidance and the October 29 Report: $15.8 to $16.8 Billion
Intel reports third-quarter 2026 results after the market closes on Thursday, October 29, followed by a conference call at 2 p.m. PT. The company announced the date on October 6.
Guidance sets a high bar. Intel guided third-quarter revenue to $15.8 billion to $16.8 billion, with a midpoint of $16.3 billion that implies 19% year-over-year growth. It guided GAAP EPS to $0.31 and non-GAAP EPS to $0.38, with a non-GAAP gross margin of roughly 42%. When issued in July, the guidance sat well above consensus estimates of $15.0 billion to $15.1 billion in revenue and $0.24 to $0.27 in adjusted EPS.
Intel’s track record argues for a beat. The company has topped its own financial guidance for seven consecutive quarters. In the second quarter, it beat the revenue midpoint by $1.8 billion and doubled its EPS guidance. If it delivers a similar beat in Q3, revenue could land above $17 billion and non-GAAP EPS above $0.45.
The market’s expectations, however, have moved. Intel traded at $120.23 shortly after the July guidance, a level that implied a price-to-earnings ratio of 79 times annualized Q3 guidance. At Monday’s $95.14 that multiple has fallen to 63 times. The stock has de-rated by 21% while guidance has held, which lowers the bar for a positive reaction.
The variables that will drive the reaction are specific. First, revenue against the $16.3 billion midpoint and gross margin against 42%. Second, fourth-quarter guidance, which will show whether demand still outruns supply. Third, DCAI growth and server unit trends. Fourth, Foundry operating losses against Q2’s $2.09 billion and any external customer announcements. Fifth, capital spending plans, since management said in July it is meaningfully increasing investment in equipment, clean room space and substrates.
The reaction function is asymmetric given the stock’s volatility. A clean beat with strong Q4 guidance could carry Intel through the $101 to $103 wall toward $110 to $115. A miss or soft guide could send it back toward $85 and $80. With 66 moves larger than 5% in the past year, a double-digit move in either direction after the report is a realistic outcome.
Valuation: 63 Times Annualized Guidance and a $109 Average Target
Intel’s valuation is the strongest argument against chasing Monday’s rally. At $95.14, the stock trades at 63 times its annualized third-quarter non-GAAP EPS guidance of $0.38, or $1.52 per year. Against consensus estimates for next year’s earnings of $1.44 per share, up 38.46% from $1.04, it trades at 66 times forward earnings and 91 times the current-year estimate.
Trailing GAAP earnings are negative. Intel’s trailing GAAP EPS stands at minus $2.11, giving a price-to-earnings ratio of minus 44.36. The CHIPS Act mark-to-market charge and the Mobileye goodwill write-down distort the trailing figures, so investors focus on adjusted and forward earnings.
The revenue multiple is more moderate. A base-case fiscal 2026 revenue of $62.3 billion, built from first-half actuals, the Q3 guidance midpoint of $16.3 billion and a fourth quarter held at the Q3 level, puts Intel at 8.1 times sales on a $502.92 billion market cap. That is a premium to Intel’s own history but well below the multiples assigned to the leading AI chip designers.
The comparison with Nvidia is stark. Nvidia trades at $218.45 with a $5.275 trillion market cap and a trailing P/E of 27.08. Intel trades at more than twice Nvidia’s earnings multiple despite margins that are less than half as high. Intel’s non-GAAP gross margin of 41.8% compares with margins far above 70% at Nvidia. The market is paying for Intel’s earnings recovery and manufacturing optionality, not for its current profitability.
Street targets reflect the split. The average rating sits at Hold, with an average price target of $109.06, 14.6% above Monday’s price. The newly upgraded desk holds an $85 target, 10.7% below. The spread between those two numbers shows how widely views diverge.
The margin path is the key valuation driver. Intel’s core operating margin reached 12.9% in the second quarter and 8.4% on a trailing basis, against 29.8% in fiscal 2021. If margins return toward the high-20s by the end of the decade while revenue grows in the high teens, the current multiple compresses quickly. If margins stall in the low teens, it looks stretched. The October 29 report will add one more data point to that trajectory.
Read More
-
Yen Stalls at 160 Despite a 3% JGB and Tokyo Core CPI at 2.0% — Intervention Sits at 164, Friday's Payrolls Decide
02.09.2026 · TradingNEWS ArchiveEnergy
-
Amazon ($262.11) Rebounds From $250 on AWS Acceleration and a 24.8x Forward Multiple — $284 Then $300 on an October 29 Beat
19.10.2026 · TradingNEWS ArchiveStocks
-
XRP-USD Pinned Near the $1.28 200-Day Average as Escrow Supply Outpaces ETF Demand — $1.15 Below $1.25, $1.50 Above $1.38
19.10.2026 · TradingNEWS ArchiveCrypto
-
Brent ($108.20) Retreats From $110 as Diesel Deal Meets $2.78 WTI Backwardation — Dips Toward $105 Bought, $113 Above $110
19.10.2026 · TradingNEWS ArchiveCommodities
-
S&P 500 Climbs to 7,724, Nasdaq Jumps to 26,575, Dow Flips Green as Cleveland-Cliffs CLF Soars 15%
19.10.2026 · TradingNEWS ArchiveMarkets
-
Pound ($1.3319) Outperforms the Euro as BoE Hike Pricing Narrows the Fed Gap — Buy Dips Toward 1.3240, Target 1.3450
19.10.2026 · TradingNEWS ArchiveForex
Sector Backdrop: Chips Rebound 2.3% After the AI Financing Scare
Intel’s rally came inside a broad semiconductor rebound. A gauge of large chip stocks rose 2.3% in Monday’s first hour, and the Nasdaq 100 climbed 1.4% by mid-morning. The move followed a week in which the Nasdaq Composite lost 4.5%, its worst five sessions since June, and the semiconductor complex absorbed the heaviest selling.
The sell-off had a specific cause. Investors questioned how much debt the AI infrastructure build-out can carry with the 10-year Treasury yield above 5% and the Fed in hiking mode. CoreWeave’s credit spread widened to 1,200 basis points, and debt-financed neocloud operators lost between 10% and 12% on Friday alone. Chip suppliers were hit by association, since their order books depend on those customers.
Intel sits in an unusual position within that debate. Unlike the neoclouds, it is not borrowing to buy GPUs. Unlike Nvidia, it does not depend on a small number of debt-funded customers for its data center growth. Its exposure to the AI build-out runs mainly through server CPUs, custom silicon and foundry capacity, all of which benefit from AI spending without carrying the same counterparty risk.
Monday’s movers show the rebound’s breadth. Nvidia rose 2.02% to $218.45 on 38 million shares, AMD gained in line with Intel, and Micron recovered after last week’s drawdown in memory names. Super Micro Computer bounced 4.60% to $33.08. CoreWeave rose 2.74% to $63.08 after handing back more than half of its premarket gain.
The macro backdrop has not improved. The 10-year Treasury yield rose to 5.13% on Monday, U.S. headline CPI stands at 3.7%, and the Fed meets on October 28 with the funds rate at 3.75% to 4.00% and a 92% chance of another hike priced by December. Higher yields raise the discount rate on long-duration growth stocks, and Intel, trading at more than 60 times forward earnings, sits squarely in that category.
This week’s earnings calendar will shape the sector before Intel reports. Lam Research and Texas Instruments report this week, offering reads on wafer-fab equipment demand and analog and industrial chips. Tesla and Meta report on Wednesday, and Meta’s capital spending guidance will feed directly into expectations for data center CPU and accelerator demand. A strong Meta capex number would support Intel into its own report.
Competition: AMD, Arm and the TSMC Gap
Intel’s competitive position is improving on manufacturing and still under pressure on products. The 2026 rally has been shared: Intel is up 143% year to date through Friday and AMD is up 175%, which means the market has rewarded the entire x86 CPU franchise for its role in AI rather than Intel specifically.
AMD is the most direct rival. In server CPUs it has taken steady share from Intel, and the warning that Intel faces a few more quarters of server share losses refers primarily to AMD’s gains. Intel’s response has been to raise prices and shift mix toward higher-value products, which drove a 27% increase in server ASPs in the first quarter even as unit volumes fell 5%. That strategy protects revenue but concedes units.
Arm-based custom silicon is the second threat. Hyperscalers have been designing their own server processors on Arm architecture, reducing their dependence on both Intel and AMD. Intel’s custom chip revenue nearly tripling in the second quarter suggests it is winning some of that business through its foundry and design services, turning a competitive threat into a customer opportunity.
In client computing, Intel holds a stronger position. Client Computing and Physical AI revenue rose 13% to $8.88 billion in the second quarter, and Panther Lake, built on Intel 18A, entered high-volume manufacturing. The client business accounts for 55% of Intel Products revenue and generates the cash flow that funds the foundry buildout. Supply constraints have limited client volumes, with Q1 volumes down 13% as Intel ramped 18A to ease the bottleneck.
In foundry, the gap with TSMC remains the defining fact. TSMC held 72.5% of global foundry revenue in the second quarter. Intel’s external foundry revenue of $293 million in that quarter compares with tens of billions at TSMC. Intel’s advantages are U.S.-based capacity, government support through the CHIPS Act agreement and a process roadmap that has met its 18A and 18A-P milestones on time. Its disadvantage is a short track record with external customers.
The competitive scorecard heading into October 29 is mixed. Intel is winning on manufacturing execution, holding its own in client computing and losing share in servers. The stock’s next leg depends on whether the manufacturing gains begin translating into product share gains and named external foundry wins.
Price Scenarios: $85 Floor, $103 Trigger, $110 to $115 Targets
The base case into October 29 keeps Intel between $85 and $103. That scenario requires the semiconductor sector to hold Monday’s rebound without extending it, the 10-year yield to stay between 5.00% and 5.20%, and the Fed to hold rates on October 28 without a hawkish shift. Under those conditions, Intel oscillates between support at Friday’s $89.85 close and resistance at the 200-day average of $101.31, with the CEO’s $95 purchase price acting as a pivot in the middle of the range.
The upside case needs a trigger above $103.05. A daily close above the 50-day average would put Intel back above both moving averages and confirm the end of the June-to-October correction. The first target would be the $109.06 average Street price target, 14.6% above Monday’s price. A clean break there would open $115, then the $120 level where the stock traded after its July guidance, a 26% gain. That scenario requires a beat on the October 29 report with revenue above $17 billion and non-GAAP EPS above $0.45, fourth-quarter guidance above $17 billion, evidence of stable server unit share, and a named external foundry customer or confirmation of 14A PDK 0.9 delivery.
The downside case starts below $85. A daily close under the newly upgraded desk’s price target would expose the recent low near $80, a 16% decline from Monday’s price. A break below $80 would put the $70 to $75 area in play, where the stock consolidated during its first-half rally. That scenario requires a miss on revenue or gross margin, soft fourth-quarter guidance, an acceleration in server share losses, a rise in Foundry operating losses, or a renewed AI sell-off pushing the sector lower.
Intel’s volatility means the scenarios carry wide ranges. With 66 daily moves larger than 5% in a year, a 10% to 15% move after the October 29 report is a realistic base expectation, not a tail risk.
The probability weighting tilts toward the base case before the report, with a modest upside bias created by Intel’s seven-quarter streak of beating its own guidance. That bias weakens if the stock fails to hold $89.85 this week or if the 10-year yield pushes above 5.20%.
Verdict: Hold; Buy Above $103.05, Sell Below $85
Intel’s setup on October 19 is neutral with a constructive fundamental backdrop and a weak technical structure. The stock at $95.14 trades 33% below its June high of $142.35, below its 50-day average of $103.05 and its 200-day average of $101.31, 12% above the $85 target of the desk whose upgrade sparked Monday’s 5.89% rally, and within 14 cents of the CEO’s August purchase price of $95.
The fundamental case is strong. Second-quarter revenue rose 25% to $16.13 billion, the fastest growth in more than 15 years. Data Center and AI revenue jumped 59% to $6.26 billion. Non-GAAP gross margin reached 41.8%, up 12.1 points. Operating cash flow hit $7.0 billion. Intel 18A output ran 25% above target, Foundry losses narrowed by $348 million, and third-quarter guidance of $15.8 billion to $16.8 billion sits well above where consensus stood in July. The company has beaten its own guidance for seven straight quarters.
The case for caution is valuation and structure. At 63 times annualized guidance and 66 times next year’s consensus earnings, Intel trades at more than twice Nvidia’s multiple with less than half its margins. Server share losses are expected to continue for several quarters, external foundry revenue remains below $1 billion a year, and TSMC holds 72.5% of the foundry market. The chart remains in a downtrend below both key moving averages, and the 10-year yield at 5.13% weighs on high-multiple growth stocks.
October 29 decides the next move. The report needs to show revenue above the $16.3 billion guidance midpoint, gross margin at or above 42%, stable or improving server units and progress toward named external foundry customers.
The verdict is Hold at $95.14. A daily close above $103.05, ideally after a strong October 29 report, upgrades the call to Buy with targets at $109 and $115. A daily close below $85 downgrades it to Sell, with $80 as the first objective and $70 to $75 below.