Nasdaq Sinks to 25,306, S&P 500 and Dow Slide as NVDA Falls 6% After Huang Resigns; SPX Eyes 7,700 Upside Target
Nvidia lost as much as 14% at the open before steadying at $163.27 while Broadcom gained 5.6% and AMD 3.7% on rival bets | That's TradingNEWS
Key Points
- Nvidia NVDA fell 6.02% to $163.27 after Jensen Huang resigned; its market value dropped below $4 trillion.
- Broadcom AVGO rose 5.6% and AMD gained 3.7% as money rotated toward Nvidia’s chip rivals.
- The 10-year Treasury yield rose 7 basis points to 5.07% and the Russell 2000 dropped 1.21% to 2,811.84.
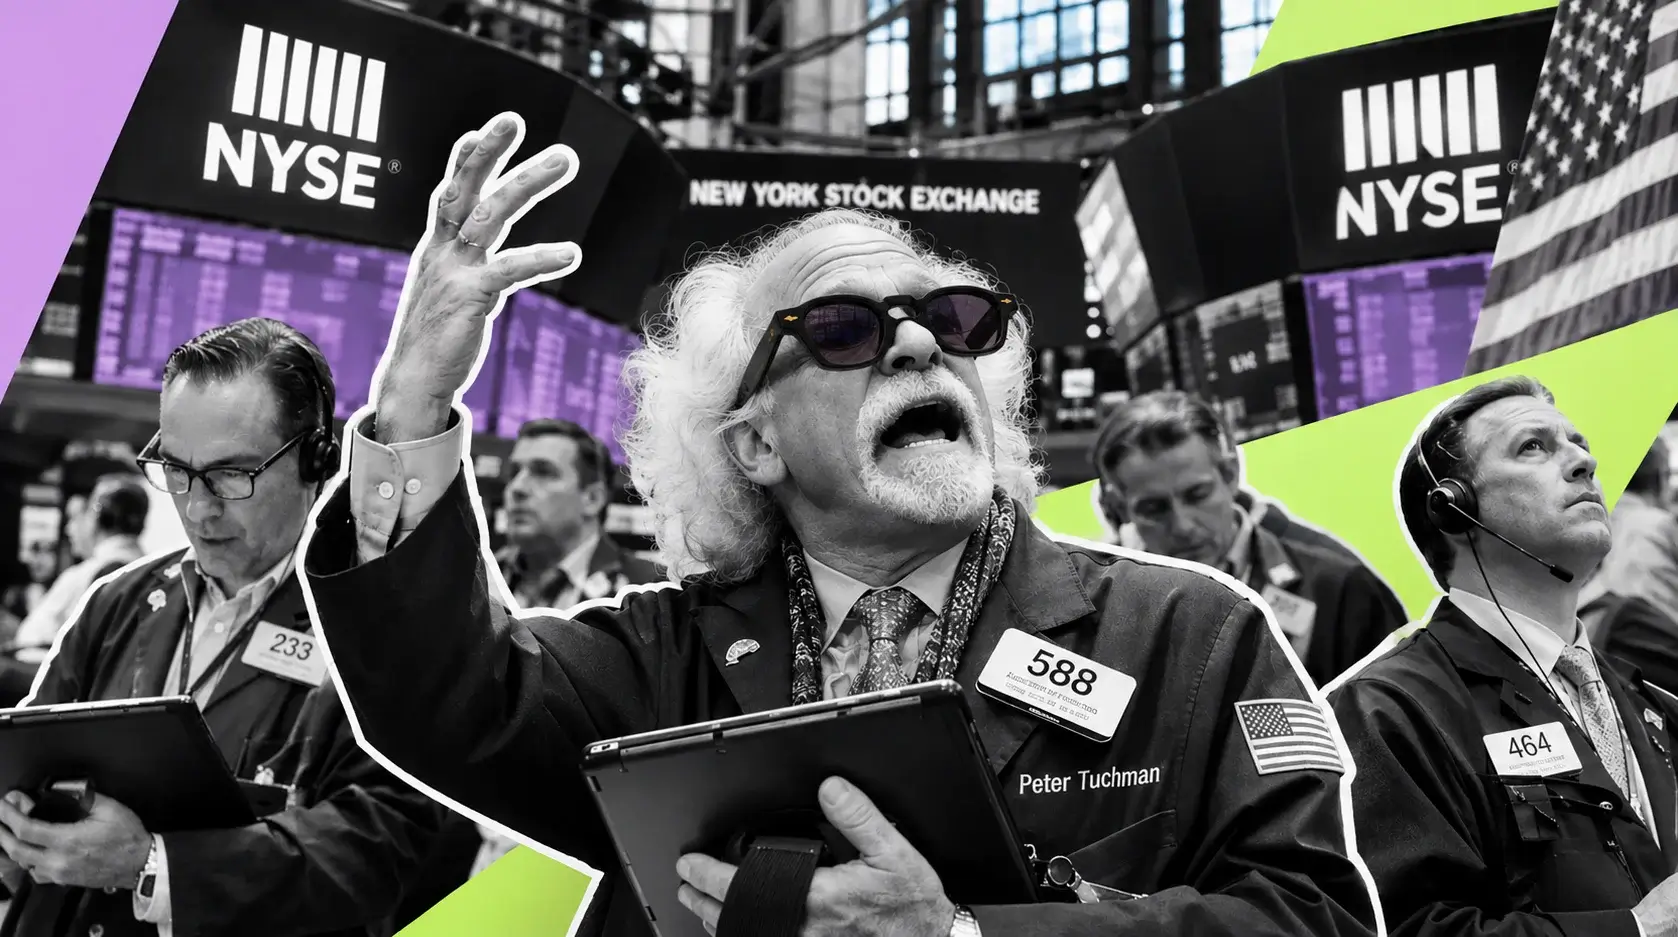
Wall Street opened Thursday into the worst leadership shock big tech has seen in years. Jensen Huang, co-founder and chief executive of Nvidia (NVDA), resigned as president, CEO and board member effective immediately, and CFO Colette Kress took the interim CEO job until a permanent successor is named. The announcement came at 8:59 a.m. ET, half an hour before the bell. That gave futures just enough time to price the hit and none to absorb it.
The stock fell 14% at the open, the deepest early drop of this week’s selloff, then buyers came in. By 10:18 a.m. NVDA traded at $163.27, down $10.46 or 6.02% from Wednesday’s $173.73 close. Clawing back more than half the opening loss inside an hour tells you there was real demand under the stock. It does not tell you the damage is over.
The index math followed. The S&P 500 (SPX) traded at 7,588.28, down 31.10 points or 0.41%, giving back a third of Wednesday’s 98.45-point rally to 7,619.38. The Nasdaq Composite (IXIC) slid 160.01 points, or 0.63%, to 25,306.18 after closing at 25,466.19 the prior session on a 1.6% jump. The Dow Jones Industrial Average (DJI) barely moved, off 55.86 points or 0.11% at 52,430.63, because price-weighting dilutes Nvidia’s pull on the blue-chip average. The Russell 2000 took the hardest hit of the four, down 34.42 points or 1.21% to 2,811.84.
Futures had flagged the shape of the day before the cash open. S&P 500 futures were down 29.25 points at 7,611 and Nasdaq 100 futures down 236.50 points, or 0.83%, at 28,237, while Dow futures were up 28 points at 52,606. The cash market delivered almost that exact split: tech heavy, industrials steady, small caps weak.
The VIX rose 1.04 points, or 5.96%, to 18.53. That is a real move but not a panic reading for a session in which the world’s second most valuable company lost its founder overnight. The options market treats this as a governance event at one company, not a systemic break.
That is the thesis of the session. The Nvidia story is about one company’s leadership and valuation, and the money leaving NVDA is mostly moving to other AI names rather than leaving AI. The real ceiling on the market is in the bond pit, where the 10-year Treasury yield rose 7 basis points to 5.07% and December rate-hike pricing keeps tightening. Nvidia sets the day’s headlines. The 10-year sets the market’s limits.
From Sunday Probe to Thursday Resignation: How Nvidia’s Board Moved
Thursday’s resignation ended five trading days of steady damage. On Sunday, Nvidia’s board announced an investigation into Huang’s relationship with Alice Huang, a businesswoman and former executive at Singapore-based Megaspeed whom U.S. intelligence reportedly believed to be a Chinese agent. Huang confirmed the affair, and the stock fell more than 4% on Monday. That day alone erased $192 billion in market value and capped a $1.46 trillion loss over 24 trading days, a record drawdown for any U.S. company.
On Monday the company said Huang would stay on and that business momentum would not slow. That held until Wednesday night, when a second alleged extramarital affair surfaced, this one with Kimberly Powell, the Nvidia executive who runs the healthcare business. The board met that night. By Thursday morning Huang was out of all three of his roles.
The speed matters for valuation. A drawn-out process with Huang hanging on would have kept a national-security cloud over every hyperscaler purchase order and every export-license talk in Washington. Lawmakers from both parties had already called for an investigation, and several House committees had asked Huang to brief them on the relationship. A clean break takes away the worst case, a CEO under congressional subpoena running the company that supplies most of the world’s AI compute.
The cost of that break is just as real. Huang co-founded Nvidia in 1993 and owns about 3.5% of the shares. He has personally fronted every major product launch, sovereign-AI deal and hyperscaler partnership in the company’s history. Kress has been CFO since 2013 and is the company’s best-known financial voice, but she is not a product architect. The market reads her appointment as a caretaker arrangement. Her job is to keep the order book steady while the board runs a search, and Huang has said in the past that he expected the next CEO to come from inside the company.
The ownership question also needs watching. Huang directly held 70,333,203 shares after his October sales under a pre-arranged trading plan. Any change to that position, whether through new sales or estate planning now that he is off the board, becomes a supply overhang the market will price. A founder stake of that size changes from a sign of commitment into potential stock for sale the moment the founder leaves.
The next hard date is Nvidia’s fiscal third-quarter report on November 17. The company guided to $108 billion in revenue for the October quarter after posting $96.22 billion and $2.22 in adjusted earnings per share in the August quarter. Kress will now deliver that number as interim chief executive. That turns a routine earnings call into the first real test of whether customers keep ordering with the founder gone.
Valuation Reset: 12 Times Forward Earnings, the $4 Trillion Line and the Broken $164 Floor
On the chart, the damage is clear. NVDA broke through a support zone near $164 that had held twice in the past 14 months. It now trades at a more than 16-month low and is down 30% over the past month. With the share price at $163.27, the company’s market value fell below $4 trillion for the first time since July 2025. More than $550 billion in value has disappeared since the board announced its investigation on Sunday, and $190 billion of that came after last week’s low.
The valuation tells a different story from the price chart. Nvidia now trades at 12 times forward 12-month earnings, its cheapest multiple since November 2012. For comparison, in May the stock closed at $211.50 with a trailing P/E of 43 and a forward P/E of 24. The forward multiple has halved in six months while earnings estimates kept rising. Investors are not pricing lower AI-chip demand. They are pricing a bigger discount for uncertainty about the company’s leadership and its standing with Washington.
Short sellers have booked $9.6 billion in paper profits this week. That matters for the next few sessions. Short positions of that size, sitting on a stock at a 14-year valuation low, become forced buyers the moment the news turns. A clean November 17 print or a credible permanent CEO named early could set off a squeeze. Until one of those happens, shorts have no reason to cover, and the $164 level now sits overhead as resistance.
Heavy volume confirms the move is real repositioning, not thin-market drift. Volume spikes this large on a break of multi-month support usually leave the stock stuck in a range for weeks rather than bouncing in a V. The intraday bounce from the 14% opening loss to a 6% loss shows buyers waiting around $150, but buyers waiting is not the same as buyers in control.
The governance discount also cuts both ways for the AI supply chain. Nvidia has financed infrastructure built around its own chips, including a $2 billion investment in Nebius (NBIS) in March, and that circular-funding model has drawn scrutiny. The open question in the tape is whether an Nvidia under an interim CEO pulls back on those financing commitments. If it does, the smaller neoclouds that lean on Nvidia capital lose a funding source just as their own expansion costs peak.
The level map for NVDA is simple. The $164 floor that broke this morning is the first test for any recovery. The $173.73 Wednesday close is the gap to fill. Below today’s opening flush near $150, the stock has no recent support at all.
Rotation, Not Liquidation: Broadcom +5.6%, AMD +3.7% and Green Hyperscalers
Under the headline selloff, investors are not dumping AI. They are swapping one AI stock for others. Broadcom (AVGO) ripped 5.6% and Advanced Micro Devices (AMD) gained 3.7% as traders bet on rivals picking up share from an Nvidia without its founder. Both had pared bigger premarket gains, which shows the trade was crowded before the open. They still held on to solid green prints.
The pattern started Monday, when the scandal first broke. That day AMD jumped 11% and Broadcom 8% while Nvidia fell more than 5%. Thursday repeats the trade. Money leaving the GPU leader goes to the custom-silicon designer and the second-source GPU supplier. Broadcom’s custom accelerators, the chips behind Google’s TPUs and the in-house silicon programs at Meta and others, offer an alternative to Nvidia that has nothing to do with who runs Nvidia.
The hyperscalers confirm the same reading. Alphabet (GOOGL), Amazon (AMZN) and Microsoft (MSFT) all rose between 0.8% and 2.7%. These companies are Nvidia’s biggest customers and the ones writing the capex checks. If the market believed the Huang exit put AI spending at risk, they would trade lower on fears about returns on that spending. They traded higher instead, which means the market expects the build-out to continue, just with more chip vendors in the mix.
Apple (AAPL) adds a third sign of confidence in big tech. The stock closed Wednesday at a record $355.63 after a 2% gain, putting its market value at $5.1 trillion. For the first time in months Apple, not Nvidia, is the market’s largest stock, and it is holding up while Nvidia sells off.
The losers inside the chip complex sit closest to Nvidia’s own supply chain. Taiwan Semiconductor Manufacturing (TSM), which builds Nvidia’s chips, fell more than 2%. Intel (INTC) dropped 3.87%. Marvell Technology (MRVL) fell 3.8%, an awkward move for a company Huang himself called the “next trillion dollar company” in June. ASML slipped into the red. The Philadelphia Semiconductor Index (SOX) fell 1.3%, a mild drop given that its largest member lost 6%. That gap says chips as a group are holding up far better than Nvidia alone.
European tech mirrored the split. The sector fell about 1% while the broader European market rose. In Asia, Japanese and South Korean benchmarks closed 0.7% lower as Nvidia-linked suppliers there took the overnight hit before New York opened.
The read-across for positioning is straightforward. Funds that hold AI exposure through Nvidia as a single name are rebalancing that exposure across the sector rather than cutting it.
Neoclouds and Memory Give Back Wednesday: CoreWeave, Nebius, Sandisk, Micron
The stocks that rallied hardest on Wednesday are the ones giving back the most on Thursday. CoreWeave (CRWV) dropped as much as 13.6% after surging more than 27% on Wednesday, when its third-quarter results set off a relief rally across AI infrastructure. The bulk of that gain is now gone. Investors are treating CoreWeave as what it is: a leveraged bet on Nvidia’s chips and Nvidia’s financing.
Nebius (NBIS) got smoked on its own numbers. The stock fell 16.2% after the company said 2026 revenue would land at the low end of its prior $3.0 billion to $3.4 billion forecast. Going into the print, full-year Street estimates of $3.48 billion sat above the top of that range. First-half revenue was $981 million, so the guide implies a second half well short of what the market had penciled in. Management had already flagged that the big contracts signed in the second quarter come online late in the year and help 2027 more than 2026. Thursday’s guidance confirmed the slip. Nebius also has a direct Nvidia link through the $2 billion investment, so it took both its own miss and the Huang fallout at once. IREN and Applied Digital also traded lower in sympathy.
Memory and storage took the next layer of selling. Sandisk (SNDK) fell between 6% and 8.5% after jumping 16% on Wednesday. Micron Technology (MU) dropped between 2.5% and 5.8% after a 13% gain the prior day. Western Digital (WDC) eased 3.7% to 5.2%, and South Korea’s SK Hynix fell 4% premarket. These names have become high-beta proxies for the AI build-out. Memory pricing has been the cleanest earnings story in semis this year, but when the AI trade wobbles, memory falls first and hardest.
The optical and server names followed. Lumentum (LITE), Coherent (COHR) and Dell Technologies (DELL) eased between 3% and 5.1%. Oracle (ORCL) shed 2.6%. Further down the AI supply chain, Caterpillar (CAT) and Vistra (VST), which trade on data-center power and construction demand, each slipped 0.5%. The fact that those two barely moved shows the selling stopped well short of the physical build-out.
The pattern is consistent: the harder a stock ran on Wednesday’s CoreWeave relief rally, the harder it is falling on Thursday. That is position-unwinding, not a fresh call on AI demand. The relief rally drew in short-term money, and the Huang headline gave that money a reason to leave within 24 hours.
The sector-level pressure runs deeper than one CEO. The Nasdaq entered a technical correction earlier this month after Democrats swept the midterms, including in states where local opposition to data centers runs high. Investors fear tighter regulation and permitting fights could slow the build-out. That is a policy discount on the neocloud model, and it was already on the table before Huang resigned.
Wednesday’s Setup: Record Apple, Nasdaq +1.6% and 10 of 11 Sectors Higher
Thursday’s drop has to be read against Wednesday’s rally, and Wednesday was a strong session. The Nasdaq surged 400.31 points, or 1.60%, to 25,466.19. The S&P 500 climbed 98.45 points, or 1.31%, to 7,619.38. The Dow added 254.60 points, or 0.49%, to 52,486.49, and the Russell 2000 rose 24.88 points, or 0.88%, to 2,846.26. Ten of the 11 S&P 500 sectors finished higher.
The Technology Select Sector SPDR (XLK) led with a 2.7% gain, the Energy Select Sector SPDR (XLE) rose 1.8%, and the Industrials Select Sector SPDR (XLI) added 1.3%. Consumer discretionary was the only sector in the red, with the Consumer Discretionary Select Sector SPDR (XLY) off 0.4%. That mix showed a growth-led rally with cyclical support, the kind of session that usually opens a multi-day rebound.
CoreWeave was the spark. Its third-quarter beat eased fears that neocloud economics were breaking under depreciation and financing costs, and the whole AI complex rallied with it. Nvidia itself rose 5% on Wednesday as it tried to recover from two straight sessions of steep losses. Apple’s 2% gain to a record $355.63 gave the index extra support from its largest stock.
Thursday’s open wiped out a good part of that work in one move. The S&P 500’s 31.10-point drop gives back a third of Wednesday’s gain, and the Nasdaq’s 160.01-point loss gives back 40% of its gain. The Russell 2000’s 34.42-point drop erased all of Wednesday’s 24.88-point advance and then some. That last detail matters. Small caps had no Nvidia exposure to blame, yet they fell hardest, which points back to yields as the real problem.
The two-day sequence fits the market’s recent behavior. Rallies get sold within a session or two because the macro backdrop does not let a breakout hold. The S&P 500 closed at 7,720.54 in early August and traded at 7,711 in early September. It has spent the autumn unable to get through that 7,700 to 7,720 zone, with rate-hike fears pulling it back every time it tries.
The structure of the pullback also beats the headline. The S&P 500 is only 0.41% lower even with its second-largest member down 6%. That means the other 490-plus stocks are carrying more of the load than the index level suggests. A sell-everything session would have pushed the S&P 500 down well over 1% with that kind of Nvidia drop.
The Bond Market Is the Ceiling: 10-Year at 5.07%, 2-Year at 4.69%, Dollar at 103.08
The 10-year Treasury yield rose 7 basis points to 5.07% on Thursday. That level is the real story under the Nvidia headline. The benchmark has spent two months fighting with the 5% line. It first cleared 5% in mid-September, its highest since July 2007, as the Federal Reserve resumed tightening. It hit a closing high of 5.31% on October 5 and has swung between 4.86% and 5.13% since. Every move back above 5% has knocked equities lower within days.
The 2-year yield, the maturity most tied to Fed policy, climbed to 4.69% on Tuesday after the October CPI report, a jump of more than 10 basis points in one session. With the 10-year at 5.07%, the 2s10s spread is near 38 basis points. That positive slope reflects a rising term premium, the extra yield investors demand to hold long-dated debt, as much as it reflects Fed policy. In October the term premium was estimated at +92 basis points, against a 2014 to 2021 average of −45 basis points.
The dollar confirms the pressure. The U.S. Dollar Index hit 103.08, a fresh year-to-date high, as Fed hike bets build. A stronger dollar tightens financial conditions globally and squeezes the overseas earnings of S&P 500 multinationals. It also explains part of the day’s weakness in gold and bitcoin.
The equity math is unforgiving. The S&P 500 at 7,588 trades on a forward multiple that made sense with a 4% 10-year. At 5.07%, the earnings yield on stocks gives little extra return over risk-free Treasuries. In October, real 10-year yields reached 2.66% on the inflation-protected TIPS series. Bonds now offer real competition for money that would otherwise go into equities, and money has been leaving the most rate-sensitive parts of the market.
That explains the Russell 2000’s 1.21% loss, the worst of the four major indices. Small caps carry more floating-rate debt and have less pricing power than megacaps, so a 7-basis-point jump in the 10-year hits their financing costs directly. They had no Nvidia problem on Thursday. They had a yield problem.
The direct link between the 10-year and Nvidia’s multiple is also clear. Long-duration growth stocks are valued on cash flows far in the future, so a higher discount rate cuts their present value. Nvidia at 12 times forward earnings has already absorbed much of that, which is part of why its valuation now looks cheap. The rest of the Nasdaq has not had the same reset.
The level that matters is 5.31%, the October 5 close. A move back to that level would almost certainly push the S&P 500 below 7,500. A drop back under 5% is what would open the path to 7,700.
CPI at 0.4%, Core at 0.3% and the Half-Point Question for December 8–9
The bond selloff traces back to Tuesday’s October consumer price index. The Bureau of Labor Statistics reported headline CPI up 0.4% on a seasonally adjusted basis against a 0.3% consensus, and core CPI, which excludes food and energy, up 0.3% against a 0.2% forecast. Core has now printed 0.3% for three straight months: August, September and October. Annualized, that three-month run works out to a 3.7% core pace, far above the 2.6% annual core rate published for September.
Headline CPI cooled from September’s 0.6% as the gasoline surge faded. Energy rose 0.7% in October after a 5.2% jump in September, and gasoline gained 1%. Food rose 0.5%, with groceries up 0.4% and restaurant meals up 0.5%. Core goods rose 0.2% after 0.3%. Shelter added to the gain. Motor vehicle insurance rose 0.7%, recreation 0.8% and medical care 0.3%.
The report carries a quirk. Because the 2025 government shutdown stopped the BLS from collecting October 2025 prices, the agency published no year-over-year rate for headline or core CPI this month. Markets had to trade the monthly prints alone, and the monthly prints ran hot. Gasoline, one of the few items with an annual comparison, was up 37.4% over 12 months.
The Fed’s position makes this a live decision. The central bank raised its target range to 3.75%-4.00% on September 16, its first hike since 2023, and held there on October 28 in a 10-2 vote in which both dissenters wanted another hike. Chair Kevin Warsh, who took the job on May 22, has not committed to a December move and says decisions depend on the data. The data keeps pointing the same way.
Fed Governor Christopher Waller set out the threshold on Tuesday morning in a speech in London. He said a 50-basis-point hike should be considered in December if core CPI came in at 0.3% or higher. Hours later, it printed exactly 0.3%. After the report, economists estimated core PCE, the Fed’s preferred gauge, rose 0.4% in October. The October jobs report had already shown a surge in payrolls and unemployment falling to 4.1% from 4.2%.
December hike odds had already climbed to 75% to 80% after the jobs report. The market is no longer debating whether the Fed hikes on December 8-9. It is debating whether the hike is 25 or 50 basis points. Even the Fed’s doves now see more hikes ahead, though they are in less of a hurry. Friday’s October producer price index at 8:30 a.m. ET is the next input, and the November CPI lands December 10, the day after the decision.
Read More
-
Yen Stalls at 160 Despite a 3% JGB and Tokyo Core CPI at 2.0% — Intervention Sits at 164, Friday's Payrolls Decide
02.09.2026 · TradingNEWS ArchiveEnergy
-
Broadcom Rips to $363, Eyes $417 Upside Target as Custom AI Chips Win the Rotation Out of Nvidia
12.11.2026 · TradingNEWS ArchiveStocks
-
Bitcoin Slides to $71,393, Eyes $82,700 Upside Target on Nvidia CEO Shock & IBIT’s $2B Exodus
12.11.2026 · TradingNEWS ArchiveCrypto
-
Gold Drops to $3,871, Eyes $4,150 Upside Target as Central Banks Defend the Floor Against ETF Selling
12.11.2026 · TradingNEWS ArchiveCommodities
-
FDVV ETF Targets $64 - Rebounds to $61 With 2.77% Yield & 10.68% Dividend Growth
11.11.2026 · TradingNEWS ArchiveMarkets
-
Euro Slides to 1.1078, Eyes 1.1270 Upside Target as ECB December Hike Meets a 150bp Fed Rate Gap
12.11.2026 · TradingNEWS ArchiveForex
December hike odds had already climbed to 75% to 80% after the jobs report. The market is no longer debating whether the Fed hikes on December 8-9. It is debating whether the hike is 25 or 50 basis points. Even the Fed’s doves now see more hikes ahead, though they are in less of a hurry. Friday’s October producer price index at 8:30 a.m. ET is the next input, and the November CPI lands December 10, the day after the decision.
Labor Data: Claims at 200,000, Continuing Claims at 1.697 Million
Thursday’s weekly jobless claims gave the market little relief. The Labor Department reported initial claims for state unemployment benefits rose 9,000 to a seasonally adjusted 200,000 for the week ended November 7. The consensus was 195,000. The prior week was revised up 2,000 to 191,000 from 189,000. The four-week moving average held at 195,250, which keeps that smoothed trend at its lowest level since 1969.
Continuing claims, the count of people receiving benefits after an initial week of aid and a proxy for hiring, fell 20,000 to 1.697 million for the week ended October 31. Falling continuing claims mean laid-off workers are finding new jobs quickly, which points to a firmer labor market, not a softer one.
On an unadjusted basis, initial claims rose 28,870, or 16.2%, to 206,982. Seasonal factors had expected a bigger 11% increase, so the raw number came in softer than the seasonal model predicted. For context, the same week of 2025 recorded 238,729 unadjusted claims. Layoffs are running more than 30,000 a week below last year’s pace. New Jersey had the highest insured unemployment rate at 2.0%, followed by Washington at 1.9% and Massachusetts at 1.8%.
Claims have stayed at or below 200,000 every week since mid-September. The mid-July reading of 189,000 matched the lowest since 1969. That is a labor market with almost no layoffs, which supports consumer spending and corporate revenue. It also gives the Fed no labor-market reason to hold back on hikes.
There is a structural debate under the numbers. Part of the drop in claims likely reflects a smaller labor force after the immigration crackdown, with fewer workers available to file for benefits. That still lines up with a low unemployment rate, and continuing claims suggest the jobless rate could fall toward 4.0% by early 2027. Whatever the reason, the effect on policy is the same: a tight labor market lets wage pressure feed into services inflation.
For equities, Thursday’s 5,000-claim miss against forecast was too small to change the Fed outlook. The market traded straight through the 8:30 a.m. release with its attention on Nvidia. The bigger point stands, though. Strong labor data plus three straight 0.3% core CPI prints leave the Fed boxed in. Each solid jobs number now pushes yields up and makes stocks look more expensive against bonds. On this tape, good economic data is bad news for the S&P 500’s multiple.
Small Caps and Breadth: Russell 2000 Down 1.21%, VIX at 18.53, AAII Bears Above 50%
The Russell 2000’s 34.42-point drop to 2,811.84 is the clearest breadth signal of the session. Small caps are down 1.21% with no direct Nvidia exposure. The index is reacting to the 10-year at 5.07% and the dollar at a 103.08 year-to-date high. That makes it the cleanest read on how much of Thursday’s weakness comes from rates rather than from Nvidia.
The answer is a lot. The S&P 500 is down 0.41% with its second-largest stock down 6%. The Russell is down three times as much with no Nvidia at all. Take Nvidia’s weight out of the S&P 500 and the rest of the index is roughly flat. That fits a tape in which megacaps outside the chip supply chain are holding the index up while the rest of the market leaks.
The Dow’s 0.11% loss to 52,430.63 tells the same story from the other side. Price-weighted and heavy in industrials, financials and healthcare, it has the least exposure to both the Nvidia headline and small-cap financing stress. Investors are hiding in quality large caps rather than selling stocks across the board.
Sentiment has turned defensive. The weekly survey from the American Association of Individual Investors showed bullish sentiment, the share of members expecting higher stock prices in six months, falling to 30.8% from 34.1%, the lowest in eight weeks. Bears topped 50% for the first time in eight weeks. Bulls have now sat below their long-term historical average of 37.5% for two straight weeks.
Bearish readings that heavy are usually a contrarian buy signal. When half of retail investors expect lower prices, there is less money left to sell and more on the sidelines that can chase a rally. The catch is timing. Contrarian signals work over weeks, not sessions, and they work best when a macro catalyst flips. Right now the macro catalysts all point toward a hike.
The VIX at 18.53, up 1.04 points, sits in a middle zone. It is high enough to show demand for protection but well below the mid-20s that mark forced selling. Options traders see a stock-specific shock and a rates problem, not a crash. That fits a session where the Nasdaq is down 0.63% rather than 2%.
The level to watch on the Russell is 2,800. A break below that round number would wipe out most of the small-cap index’s recent recovery and confirm that rates, not Nvidia, are setting the market’s direction.
Cross-Asset Damage: Gold Down 3.39%, Bitcoin at $71,393, MSTR’s MSCI Exit and Oil at $86.88
The selling spread well beyond equities. Gold fell $135.70, or 3.39%, to $3,864.80 an ounce. A stronger dollar and rising real yields are the textbook combination for gold: the metal pays no interest, so a 5.07% Treasury yield raises the cost of holding it, and a 103.08 dollar index makes it more expensive for overseas buyers. Gold broke below the $4,000 line in late October and has not reclaimed it. Thursday’s drop pushes it further from that level.
Bitcoin fell $2,519.55, or 3.41%, to $71,393.04 and is on track for its sixth straight weekly decline. Crypto trades as a liquidity-sensitive risk asset, and tightening financial conditions hit it as hard as they hit gold. At $71,393, bitcoin trades far below its 2025 highs.
Strategy (MSTR), the bitcoin treasury company, fell 7%, hit by both the bitcoin drop and an index decision. MSCI confirmed it will remove Strategy from its benchmark equity indexes as part of its November 2026 review, effective at the close on November 30. Under rules adopted October 15, MSCI drops “non-operating companies” whose assets are mostly treasury holdings once they fail the eligibility screen in both of their two most recent annual reporting periods. Strategy estimated MSCI-linked funds hold about 13 million shares, or 3.1% of its basic shares outstanding. That selling arrives in a stock already down sharply this year. Losing passive index demand also removes one of the supports for Strategy’s model of issuing stock to buy bitcoin.
Oil moved the other way. December WTI crude futures rose $0.35, or 0.40%, to $86.88 a barrel. President Trump posted that “We don’t need a deal with Iran,” which soured hopes for a Middle East resolution that had been building earlier in the week. Energy inflation was the main driver of September’s 0.6% CPI print, so every move up in crude feeds straight back into the Fed’s hike math. Energy stocks were the second-best sector on Wednesday with a 1.8% gain, and the oil bid gives them support again on Thursday.
The global picture was mixed. Japan’s Nikkei fell 429 points to 60,819, the Shanghai Composite dropped 24 points to 3,655, and the Hang Seng lost 307 points to 24,008. Europe held up better: Germany’s DAX rose 217 points to 26,880 and the FTSE 100 added 38 points to 10,874, even with European tech down 1%.
All these moves point to the same driver. A strong dollar and high real yields are pushing down every asset that pays no cash yield.
Single-Stock Moves Outside AI: Keurig Dr Pepper, YETI, Fossil and B&G Foods
The Nvidia story took the headlines, but company-specific news drove some of the session’s biggest moves outside tech. Keurig Dr Pepper (KDP) fell 5% after launching an underwritten public offering of $2 billion in common stock. A share sale of that size from a consumer staples company signals a need for balance-sheet funding. The market priced the dilution right away. With rates at 5%, an equity raise is the cheaper way to fund than new debt, and that trade-off will show up more as long as the 10-year stays above 5%.
YETI (YETI) dropped 8%. The cooler and drinkware brand posted an adjusted earnings beat for the third quarter, but revenue of $509.4 million, up 4% from a year ago, missed the $523 million consensus. Management cut its adjusted sales growth outlook to 6% from a prior 7% to 8% and lowered the top and bottom ends of its 2026 adjusted earnings guidance. The combination of an earnings beat, a revenue miss and lower guidance is getting punished this quarter, especially in consumer discretionary, which was the only sector that fell on Wednesday.
At the speculative end of the market, Fossil Group (FOSL) ripped 26.5% to $9.96 on 7 million shares. B&G Foods (BGS) blew through $3 and gained 37% to $3.64 on 13.8 million shares. Gevo (GEVO) jumped 30.2% to $1.81 on 28.5 million shares, and NextNRG (NXXT) posted an 857.6% gain to $1.79 on 95 million shares. Those micro-cap moves are noise for the index but show active retail trading even on a risk-off day.
The pattern across these names holds: companies that miss on revenue or need capital get hit hard, and the market does not give them the benefit of the doubt. That fits the rate backdrop. With money costing more, investors want proof of revenue growth and discipline on spending, and they sell companies that show neither.
The day’s earnings calendar adds more single-stock risk. Brookfield (BN), Nu Holdings (NU), Korea Electric Power (KEP), QXO, Brookfield Wealth Solutions (BNT), Dillard’s (DDS), Hudbay Minerals (HBM), Stantec (STN), Arrowhead Pharmaceuticals (ARWR), Twist Bioscience (TWST) and Kodiak Sciences (KOD) are all on the slate. Existing home sales data also lands later in the session. With mortgage rates priced off a 5.07% 10-year, housing data will show how much of the rate shock has reached real activity.
After the Bell and the Session Verdict: Cisco, Applied Materials, Friday’s PPI and the 7,700 Test
The afternoon catalysts all point back to the AI and rates themes. Cisco (CSCO) reports after the bell, with consensus at $18.12 billion in revenue and $1.33 in adjusted earnings per share, against company guidance of $18.0 billion to $18.2 billion and $1.32 to $1.34. Cisco’s AI infrastructure orders are the story, and management has pointed to at least $6 billion in AI revenue in fiscal 2027. A strong AI-networking number would support the view that AI spending is spreading beyond Nvidia.
Applied Materials (AMAT) also reports after the close, with Street estimates near $4.06 in earnings per share against $2.17 a year ago. Applied’s wafer-fab equipment sales are a direct read on capex for DRAM, leading-edge logic and advanced packaging. A solid guide would back up the semis rotation now favoring Broadcom and AMD over Nvidia. Cerebras (CBRS), an AI chip rival, also reports, and its numbers will test the thesis that Nvidia’s challengers gain from its turmoil.
Friday’s October PPI at 8:30 a.m. ET is the next rate catalyst. Economists expect a 0.3% monthly rise in core producer prices, and any upside surprise would lift core PCE estimates above the 0.4% already penciled in. After that come the November jobs report on December 4, the FOMC decision on December 9 and the November CPI on December 10. Nvidia’s earnings on November 17 sit in the middle of that run.
The levels are clear. The S&P 500 at 7,588 has support at 7,500 and resistance in the 7,700 to 7,720 zone, where it stalled in August and September. A close back above 7,619, Wednesday’s finish, would show the Huang shock absorbed in one session. Reaching 7,700 needs the 10-year back under 5% and a clean Nvidia print. The Nasdaq needs to retake 25,466. The Russell 2000 needs to hold 2,800.
The verdict on Thursday’s session is mixed with a bearish tilt. The Nvidia headline is severe for one company, but the market handled it in an orderly way. NVDA recovered more than half its 14% opening loss, Broadcom and AMD rallied, the hyperscalers stayed green and the Dow held flat. Money is moving within the AI complex rather than leaving it, and at 12 times forward earnings Nvidia has already been reset hard. The real constraint is macro: a 5.07% 10-year yield, a 103.08 dollar index, three straight 0.3% core CPI prints and a Fed now debating 25 versus 50 basis points in December. Those forces sank the Russell 2000 1.21% with no help from Nvidia. Until yields fall back under 5%, every rally toward 7,700 runs into the bond market, and the S&P 500 stays stuck in its 7,500 to 7,720 range regardless of who runs Nvidia.