Natural Gas Futures (NG-C) Price Forecast: $2.89 Near August Lows, 36 Bcf Injection
Storage Hits 1,865 Bcf Above Seasonal Norms, Qatar LNG Damage Takes Years to Repair, Turkey Hikes Gas 25% | That's TradingNEWS
Key Points
- EIA reported a 36 Bcf injection vs. the 5-year average 4 Bcf withdrawal; storage hit 1,865 Bcf above seasonal norms — the single most bearish data point keeping NG-C below $3.00.
- U.S. LNG terminals are running near max capacity, blocking Iran war geopolitical premium from entering Henry Hub while Brent surges 74.59% and Qatari tankers idle across Asia.
- Turkey raised residential gas prices 25% and electricity 25% on April 4 — adding 0.6pts to April CPI directly with 2–3pts total inflation impact over 3–6 months if energy stays elevated.
Natural Gas Futures (NG-C) are trading at $2.893 — up 0.035 or 1.22% on the session — in one of the most striking disconnects in the entire commodity complex right now. While West Texas Intermediate (CL=F) is trading above $112 per barrel, while Brent crude (BZ=F) is holding at $109-$111, while the Strait of Hormuz remains effectively closed to a fifth of global oil supply, and while the Iran war has been driving every energy headline for six consecutive weeks, Henry Hub natural gas is sitting near its weakest levels since August 2025. The May Nymex natural gas contract — which is the primary active contract shaping spot price discovery — has been testing $2.75 as a short-term floor while confronting $3.00 as an overhead ceiling that has successfully capped every rally attempt.
The explanation for this disconnect is not complicated, but it requires understanding what U.S. natural gas futures actually are versus what oil futures are. Oil is a globally traded commodity with physical supply chains that run directly through the Strait of Hormuz. When that chokepoint closes, oil prices respond immediately because the physical molecules that would have transited the strait are now unavailable to global buyers. Henry Hub natural gas is a domestic American contract — it prices the value of natural gas delivered at the Henry Hub interconnection in Erath, Louisiana. It does not directly price Qatari LNG, Iranian gas, or any Middle Eastern molecule. The geopolitical premium that has sent Brent up 74.59% year-over-year is largely invisible in the Henry Hub contract because the supply disruption does not physically affect U.S. domestic gas production or distribution.
The practical result: traders who expected natural gas futures to rally alongside oil on the Iran war thesis have been consistently wrong and consistently losing money on that position since the conflict began six weeks ago. The market is telling you something important with its $2.84-$2.89 stubbornness: domestic fundamentals matter more than geopolitical headlines for this specific contract, and domestic fundamentals are definitively bearish right now.
The 36 Bcf Injection vs. the 5-Year Average Withdrawal: The Number That Defines This Market
The most critical piece of data for natural gas futures (NG-C) in the current environment is not the Iran war. It is not Trump's Tuesday deadline. It is a single storage number from the EIA that has fundamentally changed the supply-demand narrative for the spring injection season. For the week ending March 27, 2026, working gas in U.S. storage rose by 36 Bcf. Total inventories reached 1,865 Bcf.
The 5-year average for the same week shows a 4 Bcf withdrawal — not an injection. The historical norm for the week ending March 27 is that the market is still drawing gas from storage, still consuming more than it produces, still burning through inventory to meet the tail end of winter heating demand. Instead, 36 Bcf was injected into storage during a week when the historical pattern calls for a 4 Bcf drawout. The swing from historical norm to actual result is 40 Bcf — 40 billion cubic feet of gas that the market expected to be consumed was instead added to underground storage.
That contrast is the single most bearish data point in the natural gas market right now and it explains the price action more completely than any other factor. At this stage of the seasonal calendar, the market would typically still be in winter-withdrawal mode with storage draws running through early April. Instead, inventories are already building — a full month ahead of the normal injection season start. That early injection tells you supply is outrunning current demand by a margin wide enough that the market cannot absorb the production without adding to storage. When supply consistently outstrips demand even before the seasonal demand low of spring and early summer, prices cannot sustain any meaningful rally without a shock to either the supply side or the demand side that reverses the balance.
Working gas in storage at 1,865 Bcf — the number produced by the 36 Bcf injection — represents a level that is meaningfully above both the 5-year average and year-ago levels. An above-average storage position at the start of the injection season tells the market that there is no scarcity in the domestic supply picture, no urgency to pay up for gas, and no fundamental reason for prices to recover toward the $3.40-$5.00 range where natural gas was trading at various points in the previous twelve months. The 5-day moving average at $2.90 and the 10-day moving average at $2.95 both sit above current price and act as immediate technical resistance rather than support — reflecting the fact that the trend has been decisively lower from the $5.69 peak earlier in 2026.
$5.69 to $2.84: The 50% Collapse From the Year High and What It Means Technically
Natural Gas Futures (NG-C) peaked at $5.69 earlier in 2026 — a level that reflected the combination of cold winter demand, supply tightness from the early phase of the Iran war's LNG disruption impact, and speculative positioning that had built significant length in the contract during the heating season. The subsequent decline to the current $2.84-$2.93 level represents a 50.1% collapse from that peak — a move of roughly $2.85 per MMBtu that has systematically destroyed every long position established above $4.50 and has converted what was a consensus bullish trade into one of the more painful commodity corrections of the year.
The technical structure on the daily chart confirms the bearish trend with precision. Natural gas is trading below all key moving averages — the 5-day SMA at $2.90, the 10-day SMA at $2.95, and the 20-day SMA at $3.08, which continues to slope downward reinforcing the underlying weakness. A price trading below three declining moving averages, all of which are sloping lower, is a textbook downtrend configuration with no ambiguity. The 50-day EMA sits significantly higher — reaching it would require a sustained move above $3.00 and continued buying pressure that pushes through multiple resistance levels. That scenario is possible but requires a domestic catalyst that does not currently exist.
The pattern of lower highs and lower lows since the $5.69 peak is intact and unbroken. Every recovery attempt — including Monday's 1.22% bounce to $2.893 — has been characterized by weak rallies that fail to reach the previous swing high before reversing. The compression near recent lows at $2.83-$2.84 suggests consolidation, but the technical context identifies this as a pause within a continuing downtrend rather than a base-building bottoming process. Base-building processes develop with increasing volume at the lows, narrowing price ranges over time, and improving momentum readings. The current picture shows declining bullish momentum, speculative long positions being liquidated rather than accumulated, and technical indicators that remain in bearish territory.
The key support levels descending from current price: $2.84 is the immediate floor, the level that has provided recent support on multiple intraday tests. Below $2.84, $2.80 is the next meaningful support. A break below $2.80 opens the path toward $2.70, which represents the next significant support level that the technical framework identifies as the potential destination if $2.84 breaks with volume. The resistance levels ascending from current price: $2.90 is the 5-day SMA acting as immediate resistance. $2.95 is the 10-day SMA — the first level that needs to be reclaimed to suggest any meaningful short-term recovery. $3.00 is the psychological level that the market has repeatedly failed to hold above. $3.08-$3.10 is the 20-day SMA zone. $3.40 is the level above which the bearish bias would begin to structurally shift — a level that currently seems distant given the domestic supply picture.
Why Iran Cannot Rescue Henry Hub: The Export Bottleneck That Traps Geopolitical Premium Outside the U.S. Gate
The most frequently asked question in the natural gas market right now is why Henry Hub hasn't rallied alongside global LNG prices as the Iran war disrupts Middle Eastern energy supply. The answer is structural and specific: U.S. LNG export terminals are already operating near practical capacity limits, which means that additional overseas demand driven by the Hormuz closure cannot be absorbed through incremental U.S. exports at any meaningful scale.
The Strait of Hormuz closure has removed enormous volumes of LNG from global markets. More than four dozen empty Qatari LNG tankers have been idling across Asia as Qatar's export plant remains shut and the Strait largely closed. QatarEnergy has stated that damage at LNG facilities could take years to repair, upending the global LNG supply outlook in a way that will persist far beyond any ceasefire. The Commonwealth LNG purchase agreement with Japan's JERA — one of the world's largest LNG buyers — has been terminated according to a filing with the U.S. Department of Energy. These are enormous dislocations in the global LNG market that should theoretically benefit U.S. gas producers through export demand.
The problem is the pipeline between U.S. domestic production and global LNG export capacity. U.S. liquefaction terminals — Sabine Pass, Corpus Christi, Freeport, Cameron, Elba Island, Calcasieu Pass — are processing natural gas at or near their rated capacities. When those terminals are full, no additional gas can be exported regardless of how desperate international buyers become. The export system acts as a ceiling on the geopolitical premium that can flow into Henry Hub prices. International buyers want more U.S. LNG, but they cannot get more because the liquefaction bottleneck prevents it. Additional overseas demand does not translate into meaningfully higher Henry Hub prices when the terminal infrastructure cannot process additional throughput.
This is fundamentally different from oil's relationship to the Hormuz closure. Oil is exported from the U.S. Gulf Coast through a wide range of vessels and terminals with substantial surge capacity. If global oil buyers want more U.S. crude, they can generally get more in the near term. For LNG, the infrastructure constraint is binding — and that constraint insulates Henry Hub from the full geopolitical premium that has driven Brent up 74.59% year-over-year while natural gas futures sit near August 2025 lows.
The result is a market that adds a modest geopolitical premium on top of domestic fundamentals — but domestic fundamentals dominate. Iran is relevant to Henry Hub pricing, but it is a secondary factor layered onto a primary bearish domestic picture rather than the primary driver.
Seasonal Demand: No Heating, No Cooling, and the Worst Time of Year for the Bull Case
Natural gas futures suffer from a predictable and unavoidable seasonal demand trough at precisely the moment the market finds itself in. Spring represents the absolute nadir of U.S. natural gas demand. Residential heating demand evaporates as temperatures moderate across the country — households that were burning gas through January, February, and March to heat their homes are now turning off their furnaces. Air conditioning demand for cooling, which drives the summer peak in power sector gas consumption, has not yet arrived at scale. The mild temperatures that are characterizing early April 2026 mean that neither heating nor cooling is generating meaningful incremental natural gas demand.
Power sector demand for natural gas — which accounts for roughly one-third of total U.S. natural gas consumption — is moderated by the mild weather reducing electricity demand overall. Solar generation in spring, with longer days and favorable angles for photovoltaic output, displaces some gas-fired generation at the margin. The combined effect of reduced residential heating, reduced cooling demand, and modest power sector gas consumption creates the weakest demand environment of the entire annual cycle.
This seasonal pattern repeats every year and it is the reason why natural gas prices almost always underperform in April and May relative to winter (heating demand) and summer (cooling demand) levels. The current price action is entirely consistent with historical seasonal norms — the only unusual element is that the starting point for the seasonal demand trough is coming off a much higher $5.69 price rather than from a more modest winter peak. The collapse from $5.69 to $2.84 is therefore also partly a normalization of the winter heating premium that gets systematically removed from the market each spring.
Looking forward, the demand trajectory improves as summer approaches. If temperatures in May and June come in above normal — particularly across the heavily air-conditioned Southeast and Texas — power sector gas demand can recover materially and provide a floor for prices above $2.84. The Tennessee Zone 0 North price hub was showing $0.10 per MMBtu, Tennessee Zone 1 non-St. at $0.09, NGPL Midcontinent at $0.065 — all extremely depressed basis prices that reflect the loose near-term domestic supply picture. Transwestern at -$1.62 and El Paso Keystone Pool at -$1.625 — negative basis prices indicating that physical gas in those Western locations is trading at a discount to the Henry Hub benchmark, reflecting pipeline constraints and supply abundance in those specific regions.
Read More
-
VOO ETF Analysis: VOO Juggernaut Hits Record Highs as Relentless Inflows Collide With Concentration and a Hawkish Fed
29.05.2026 · TradingNEWS ArchiveStocks
-
XRP ETF: XRPI and XRPR Anchor a Record Inflow Month as Institutional Demand Builds Against a Stubborn $1.45 Sell Wall
29.05.2026 · TradingNEWS ArchiveCrypto
-
Natural Gas Futures Price Forecast: Henry Hub Surges Toward $3.30 as a Light Storage Build
29.05.2026 · TradingNEWS ArchiveCommodities
-
USD/JPY Price Forecast: Yen Buckles Toward the 160 Intervention Line — Can Tokyo Hold the Wall Against a Hawkish Fed?
29.05.2026 · TradingNEWS ArchiveForex
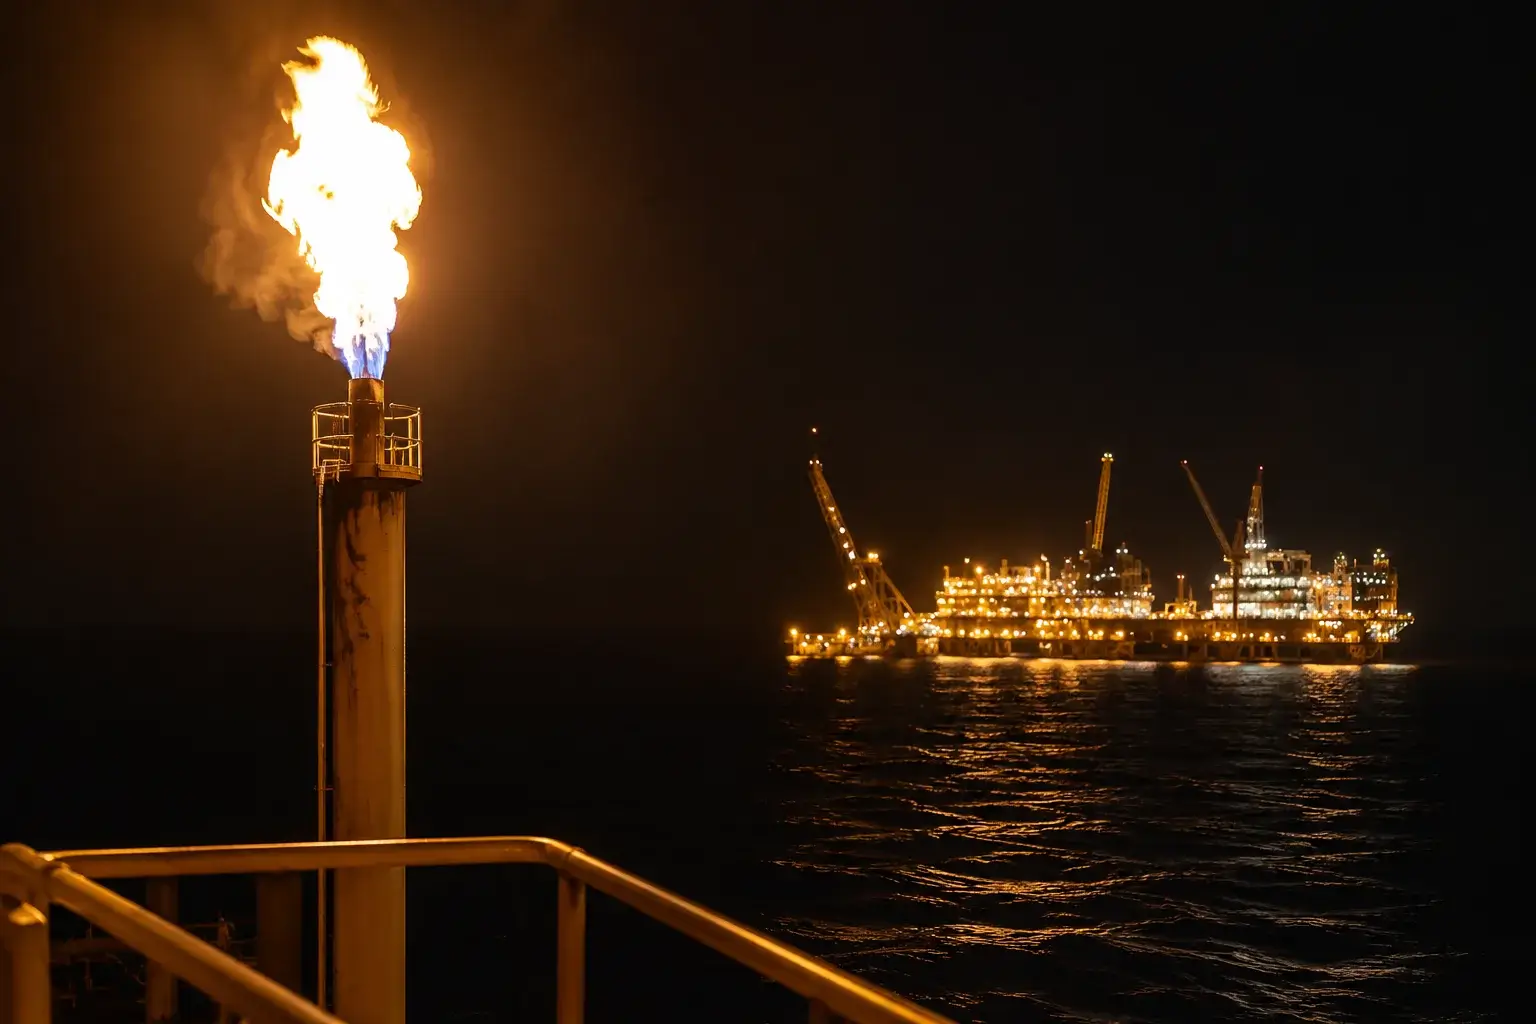
Qatar's Attack and the Ras Laffan Blaze: Why Global LNG Is More Disrupted Than the Henry Hub Price Suggests
The Iran war's impact on Qatar — one of the world's largest LNG exporters — is a structural disruption that will outlast any short-term ceasefire and that deserves substantially more attention than the Henry Hub price action suggests. Qatar's Ras Laffan Industrial City, home to QatarEnergy's LNG export terminals, experienced a significant fire following an Iranian attack. QatarEnergy stated that damage at LNG facilities could take years to repair — a timeline that, if accurate, means the global LNG supply shortfall created by the Iran war is not a temporary ceasefire-resolution story but a multi-year infrastructure reconstruction story.
The specific implication: even if the Strait of Hormuz reopens — either through a ceasefire or a military reopening — the LNG export capacity from Qatar's damaged facilities does not immediately return to pre-war levels. The physical infrastructure that liquefies natural gas, loads it onto tankers, and exports it to global markets requires complex, specialized equipment with long replacement lead times. If QatarEnergy's assessment that repairs could take years is accurate, the global LNG market has lost a significant portion of Qatar's approximately 77 million tonnes per year of export capacity for an extended period regardless of geopolitical resolution.
This is the scenario in which Vermilion Energy (VET) — specifically discussed in the energy sector analysis — has outperformed dramatically. Vermilion, which produces natural gas directly in Europe, has realized approximately C$5.50 per thousand cubic feet (Mcf) against a North American benchmark of roughly C$2.75/Mcf — double the domestic price. European spot natural gas prices have risen sharply above C$70/Mcf at peak, reflecting the severity of supply disruption. The 67% three-month stock price appreciation in VET is the direct market consequence of the premium pricing achievable by European gas producers during a period when global LNG supply is severely disrupted by the Iran war and Qatar infrastructure damage.
The contrast between Vermilion's (VET) C$5.50/Mcf realized price in Europe and the Henry Hub equivalent of approximately $2.50/Mcf at current futures prices illustrates precisely how the LNG export bottleneck is preventing the European price premium from being arbitraged into the U.S. domestic market. If U.S. LNG terminals could process unlimited volumes, the price differential would attract additional export flows until the gap narrowed. The infrastructure constraint prevents that arbitrage, leaving Henry Hub depressed domestically while European gas prices remain elevated.
Vermilion's operational data is instructive: Q4 2026 production reached 121,308 barrels of oil equivalent per day — above guidance and sharply up year-over-year. Canadian production increased roughly 5,000 Boe/d sequentially. The Osterheide well in Germany is performing strongly, and the Wisselhorst project is on track for mid-2026 startup — adding European gas production at a time when European prices are dramatically elevated. Management expects unit costs to decline more than 30% by 2026, which compounds the benefit of premium pricing. Forward EV/EBITDA at less than 3x for VET represents the cheapest valuation among the European-gas-exposed producers — a valuation that still underprices the multi-year benefit of premium gas pricing if Qatar's LNG infrastructure recovery indeed takes years.
Turkey's 25% Gas Price Hike: The Global Inflation Transmission Mechanism in Action
Turkey's decision to raise retail natural gas prices by an average of 25% for residential consumers — effective April 4, 2026 — provides the most concrete example of how the Iran war's LNG disruption is transmitting into consumer inflation globally, even in markets where the direct supply link is less obvious than in Europe. Turkey imports most of the natural gas it consumes, paying oil-indexed pricing with partial exposure to international spot market prices. The combination of the Hormuz closure and the Ras Laffan facility damage has driven Turkey's gas import costs to levels that required passing through to domestic consumers despite the government's history of absorbing energy cost increases through subsidies.
The specific structure of Turkey's price increase reveals the inflationary architecture precisely. Residential natural gas prices rose 25% on average — the largest category facing the steepest increase. Industrial consumers saw gas prices rise 18.61%. Power plant gas prices rose 19.42%. Electricity tariffs for residential consumers rose 25%. Low-voltage commercial users faced 17.5% electricity increases. Medium-voltage industrial consumers absorbed 5.8% electricity tariff increases. Agricultural users faced 24.8% electricity price increases.
The headline inflation impact is quantifiable. Electricity carries a weight of 1.27% in Turkey's Consumer Price Index basket. Natural gas accounts for 1.08% of the basket. A 25% increase in both categories directly adds approximately 0.6 percentage points to April CPI — a significant one-time inflation boost for a country already managing annual inflation of 30.9% in March (down from 31.5% in February). The more concerning figure is the indirect and second-round impact: economists estimate the total inflation effect, including manufacturing, transportation, logistics, agriculture, and food production cost pass-throughs, could reach 2-3 percentage points over the next 3-6 months if energy prices remain elevated.
Turkey used 16 billion cubic metres of gas for electricity generation in 2025 — more than a quarter of its total gas imports — with its $62 billion annual energy import bill making gas and crude oil the largest components. The tiered pricing system introduced alongside the flat rate increase adds a further dimension: households consuming above a defined threshold face gas prices approximately 70% higher than the standard tariff, with approximately 12-13% of residential users falling into this high-consumption category. Industrial gas consumers in Turkey last received a price increase of 24.6% in July 2025, meaning the April 4 increase represents a consecutive large-scale adjustment within a year — a pace that will accelerate the inflation transmission into manufactured goods costs.
Turkey's government had budgeted TL 305 billion for energy subsidies in 2026, cut from TL 650 billion (approximately $15 billion) in 2025 through the transition to a tiered pricing system. If oil and gas prices remain elevated because of the Iran war, that TL 305 billion allocation will prove insufficient and the budget will need to be supplemented — adding fiscal pressure to the inflation pressure Turkey is already managing. This is the global transmission mechanism by which the Iran war's energy supply shock becomes embedded in economies far from the Middle East, contributing to the persistent above-target inflation that central banks worldwide are struggling to address.
The LNG Canada Expansion and Why New Supply Takes Years, Not Months
LNG Canada is advancing a Coastal GasLink expansion with a new design contract — a development that speaks to the long-term trajectory of North American LNG export capacity expansion even as the near-term infrastructure bottleneck constrains Henry Hub geopolitical premium. TC Energy has reached key agreements to advance the LNG Canada expansion project. These are multi-year construction projects that will eventually add liquefaction capacity to the North American LNG export complex — but the timeline is measured in years, not months, and provides no near-term relief to the global LNG supply shortage created by the Iran war's impact on Qatar.
The LNG Canada expansion is significant because it will provide an additional export outlet for Canadian and U.S. natural gas into Asian markets — which are currently facing severe LNG supply shortages as Qatari tankers idle and the Strait of Hormuz restricts shipping. But "advancing a design contract" is the earliest phase of a major industrial project, with first LNG production potentially years away. The near-term upside for Henry Hub from LNG Canada expansion is zero — it is a medium-to-long-term bullish catalyst that will eventually tighten the domestic supply picture but does not provide any support in the $2.84-$3.00 trading range that characterizes Monday's market.
This is the fundamental paradox of the natural gas futures market in 2026: the global LNG supply disruption is severe enough to justify major new infrastructure investments in Canadian LNG export capacity, but the domestic supply-demand balance in the U.S. is so loose that Henry Hub prices cannot hold above $3.00 during the worst Middle East energy crisis in decades. The two realities are not contradictory — they reflect the physical separation between what U.S. producers can produce domestically and what global markets can absorb through the constrained export infrastructure.
The Middle East Disruption Creates a Two-Tier Global Gas Market — and North America Is the Wrong Tier
The clearest way to understand natural gas futures (NG-C) pricing in the current environment is to recognize that the Iran war has created a bifurcated global gas market. In the Middle East, Europe, and Asia — markets that depend on LNG shipped through the Strait of Hormuz or produced by Qatar — natural gas prices have risen dramatically. European spot prices exceeding C$70/Mcf and the premium economics that Vermilion Energy (VET) is realizing at C$5.50/Mcf in Germany reflect the supply-disrupted tier of the global market. In North America — where domestic production is abundant, storage is above seasonal norms, LNG export capacity is fully utilized, and domestic demand is in its seasonal trough — Henry Hub at $2.84-$2.89 reflects the supply-loose tier.
The "dual shock" for global energy — simultaneous disruption of both oil and LNG supplies — that Columbia University's Center on Global Energy Policy described is entirely real and severe from a global perspective. But it is flowing primarily through oil prices in the U.S. market context, while the LNG shock is insulated from Henry Hub by the export bottleneck. This is why the broader energy narrative of the Iran war has driven Brent and WTI to multi-decade highs while Henry Hub sits at August 2025 lows — two commodities both classified as "energy" but experiencing the same geopolitical shock in fundamentally different ways due to their respective market structures.
The Directional Call: Natural Gas Futures Are a Sell on Bounces Toward $3.00
Every piece of evidence in the current natural gas market — the 36 Bcf storage injection against a 5-year average 4 Bcf withdrawal, the 1,865 Bcf total storage level above seasonal norms, the seasonal demand trough with no meaningful heating or cooling load, the LNG export capacity already at practical limits capping geopolitical premium flow, the technical structure of lower highs and lower lows with price below all declining moving averages, and the speculative length being trimmed rather than accumulated — collectively produce a clear and actionable directional assessment: natural gas futures (NG-C) are a sell on bounces toward the $3.00-$3.10 resistance zone.
The $2.75 level cited as the short-term floor is the primary support that defines the bear scenario's near-term target range. Current price at $2.84-$2.89 sits approximately 3.5%-5% above that floor and approximately 3.7%-5.9% below the $3.00-$3.10 resistance ceiling. Within that $2.75-$3.10 band, the risk-reward for long positions is unfavorable — the upside target is 3.7%-5.9% from current levels while the downside risk to $2.70-$2.75 is 5%-7%. Negative expected value for longs.
The specific trade: short natural gas futures on any advance toward $2.95-$3.00, with a stop above $3.10. Targets are $2.84, $2.80, and $2.70. If the 20-day SMA at $3.08 is cleared on a sustained daily close with expanding volume — which would require a domestic tightening signal such as a significantly hotter-than-normal weather pattern or a meaningful production disruption — the bearish bias would need to be reassessed. Until that domestic catalyst arrives, every bounce toward $3.00 is a selling opportunity rather than a breakout to chase.
The one scenario that changes this calculus is a confirmed military strike on Iranian infrastructure on Tuesday combined with an escalatory response that physically disrupts U.S. domestic gas production or pipeline infrastructure — an extremely low probability event. More realistic: if summer 2026 brings above-normal temperatures to the Southeast and Texas consistently from June onward, power sector cooling demand could tighten the supply-demand balance sufficiently to support a recovery toward $3.40-$3.50 by July-August. That is a summer story for a market currently in deep spring. Between now and then, the path of least resistance for Henry Hub is sideways to lower, with the $2.70 level as the downside target if the next EIA storage report shows another above-average injection.