Natural Gas Futures Price Forecast: NGM26 Holds $2.69 as Hormuz LNG Shock Drives TTF to $14.80, JKM to $16.02
Henry Hub at $2.69 lags global benchmarks as Qatar's Ras Laffan damage cuts 20% of LNG supply | That's TradingNEWS
Key Points
- Natural Gas Futures (NGM26) at $2.69 as Hormuz cuts 10 Bcf/d global LNG; TTF up 35% to $14.80, JKM up 51% to $16.02
- Storage 7.1% above 5-yr average, production at 110 Bcf/d caps front-month; $2.683 is 52-week low support
- $2.85 break unlocks $3.00 then $3.25 Fib target; LNG ramp adds 2.4 Bcf/d capacity through year-end 2026
The U.S. natural gas tape is now sitting in one of the most fascinating divergence trades in the entire commodity complex, with the front-month June Nymex Natural Gas Futures contract (NGM26) printing $2.691 per MMBtu by midday Tuesday — off 1.39% on the session — while the May contract (NGK26) expired at $2.559 per MMBtu, gaining 0.4% on its final trading day. The 52-week range tells the bear story in real time: the contract has collapsed from a high of $4.183 to a 52-week low of $2.683, a 35% drawdown that has played out over six months as mild spring weather, robust storage builds, and near-record domestic production have crushed any near-term price support. Last Friday's close marked the lowest nearest-futures print since October 29, 2024, and the structural setup heading into the May injection season looks textbook bearish on the front-end of the curve. Yet the medium-term curve is telling an entirely different story — one defined by the Strait of Hormuz closure, the Qatari Ras Laffan facility damage, and the global LNG supply disruption that has sent the European TTF benchmark to $14.80/MMBtu and the Asian JKM benchmark to $16.02/MMBtu, while Henry Hub trades at roughly one-fifth those international prices. The arbitrage opportunity is real, but it cannot be executed at scale because U.S. LNG export terminals are already running at 94% utilization, capping the marginal supply response and preserving the divergence between domestic and international prices for the foreseeable future. For traders running directional length on Natural Gas Futures Price exposure, the question is whether the front-month $2.36 to $2.70 trading range holds through the shoulder season or whether the medium-term LNG export ramp finally tightens the U.S. balance enough to drag the front-end higher.
Where Natural Gas Futures Price Sits on the Tape Right Now
The June Nymex contract (NGM26) is currently parked at $2.691/MMBtu, having opened the session at $2.734 and traded a relatively narrow intraday range of $2.691 to $2.734. The session-by-session pattern through April captures the weakness: April 22 close at $2.861, April 23 close at $2.760 (down 3.53%), April 24 close at $2.683 (down 2.79% — fresh 52-week low), April 27 close at $2.729 (recovery of 1.71%), and Tuesday's open-to-close grind back to $2.691. That is the rhythm of a market that is finding short-term support around the $2.68 zone but cannot generate the buying pressure to break above the $2.86 to $2.88 resistance band that has capped multiple recent rally attempts.
The 52-week trading map is structurally bearish. The contract is 35.34% below its 52-week high of $4.183 and only 0.30% above its 52-week low of $2.683. The Fibonacci retracement levels from the high to current spot place the 38.2% level at $3.256, the 50% level at $3.433, and the 61.8% level at $3.610 — meaning a recovery to even the most modest Fibonacci target requires roughly 21% upside from current levels. The new-highs versus new-lows ratio confirms the bearish positioning: the contract has made 34 new lows in the past 52 weeks but only 10 new highs, and the most recent new low was just three sessions ago.
The May contract (NGK26) settling at $2.559/MMBtu on its final expiry day reflects the structural backwardation that has compressed throughout the spring. The roll into June at $2.691 implies a $0.13 contango that captures both the seasonal dynamic and the medium-term LNG export expectation. Traders watching the term structure should note that the curve is in modest contango through the next several months — a bearish front-end signal that nonetheless leaves room for the back-end to reflect the international LNG tightness.
The Hormuz LNG Shock: How Global Gas Markets Split From Henry Hub
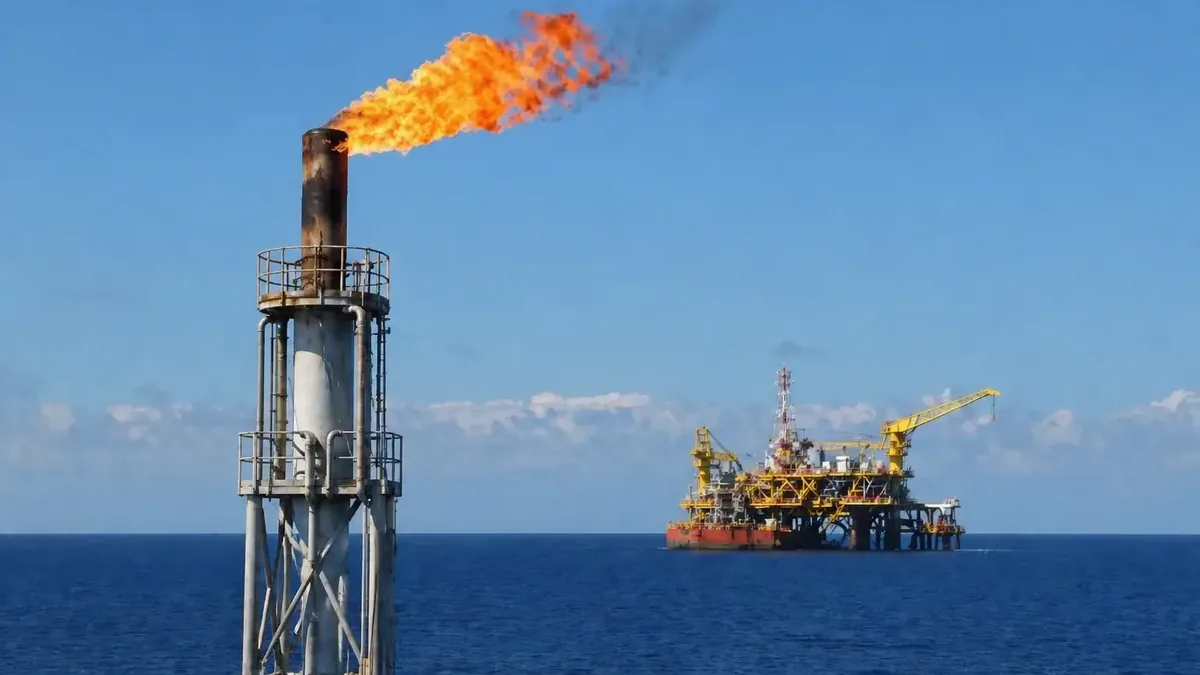
The single most consequential development in the global gas complex over the past two months is the Strait of Hormuz closure that began on February 28, which has effectively cut off over 10 billion cubic feet per day of global LNG supplies — approximately 20% of total global LNG flows. The bulk of the affected capacity comes from Qatar's Ras Laffan facility, which is the world's largest natural gas export plant and accounts for roughly 20% of global LNG supply on its own. QatarEnergy declared force majeure on March 4, formalizing the supply disruption and forcing Asian buyers — who import over 80% of Qatari gas — to compete for spot cargoes on global markets to replace lost contract volumes.
The price impact on international benchmarks has been violent. European TTF futures climbed to $14.80/MMBtu for the week ending April 24, up 35% from pre-closure levels, while the Asian JKM benchmark surged 51% to $16.02/MMBtu over the same window. By contrast, Henry Hub front-month futures have actually declined 9% since February 28 — a counterintuitive divergence that reflects two structural realities. First, U.S. LNG export terminals are already operating at near-maximum capacity, with March exports averaging 17.9 Bcf/d at 94% utilization rates against DOE-approved export levels. The marginal capacity to ramp exports in response to the Hormuz disruption is genuinely limited in the near term. Second, U.S. domestic production has remained at record levels even as injection season begins, keeping the domestic balance oversupplied even as the global market tightens.
The medium-term picture is materially more constructive. The damage to Qatar's Ras Laffan facility from the Iranian attacks affected roughly 17% of total LNG export capacity, and repair timelines have been quoted at three to five years. That is not a transitory disruption — it is a structural reduction in global LNG supply that will reshape pricing dynamics across multiple gas seasons. Combined with the U.S. LNG export capacity additions scheduled to come online between April and December 2026 — including Plaquemines LNG (0.5 Bcf/d), Elba Island (0.1 Bcf/d), Golden Pass Trains 1-2, and Corpus Christi Stage 3 Trains 5-7, totaling approximately 2.4 Bcf/d of new authorized capacity — the medium-term setup tightens the U.S. balance enough to support price recovery on the back-end of the curve.
The Storage Glut: 7.1% Above the Five-Year Average
The bearish front-end story is anchored on storage. EIA inventories as of April 17 sat 7.1% above the five-year seasonal average, with the most recent weekly injection of 103 Bcf comfortably exceeding both the 97 Bcf consensus expectation and the 64 Bcf five-year weekly average for the same period. By the week ending April 24, storage was projected to be 8% above normal levels, an increase from the 7% surplus recorded the prior week. That kind of structural overbuild is the textbook bearish signal that converts every weekly EIA report into a front-month selling trigger and locks the market into the oversupplied spring pattern.
The European storage picture is the polar opposite. European inventories closed the winter season at just 28% full, well below the five-year average of 41% and reflecting the cumulative drawdown from the Hormuz-driven supply disruption. As of April 26, European storage had recovered modestly to 32% full, but it remains 12 percentage points below the seasonal average. The implication is that European buyers will be aggressive on spot cargo procurement through the summer to refill storage ahead of next winter, which should pull global LNG into European delivery routes and keep TTF prices structurally elevated.
The Asian storage capacity is materially smaller than European capacity, which means JKM prices are more sensitive to weather-related spot demand swings rather than storage rebuilds. The summer cooling season in Asia could deliver another leg higher on JKM if temperatures push above seasonal norms and electricity demand drives gas-fired generation higher.
U.S. Production at Record Levels: The Bearish Anchor
U.S. dry gas production hit 110.0 Bcf/d on Tuesday per BNEF data, up 3.1% year-over-year, and has been tracking near a record high throughout the spring. The April 7 EIA forecast revised 2026 dry gas production guidance upward to 109.59 Bcf/d from a March estimate of 109.49 Bcf/d, and active gas drilling rigs hit a 2.5-year high of 134 in late February before easing slightly. As of the week ending April 24, Baker Hughes reported 129 active gas rigs — up from the 4.75-year low of 94 rigs reported in September 2024, a 37% increase in the rig count over the past 19 months that confirms the structural production response to higher prices earlier in the cycle.
The production response is starting to roll over modestly at the very front end. LSEG data showed average April production easing to 110.1 Bcf/d from 110.4 Bcf/d in March, and daily production was on track to drop by approximately 0.7 Bcf/d over the past five days to a preliminary 108.8 Bcf/d on Monday. Low spot prices have prompted producers like EQT — the second-largest U.S. gas producer — to cut production at the margin. That is the textbook supply-side response to oversupply, and it provides the floor under the front-month contract that has held the $2.68 to $2.70 zone over the past several sessions.
Demand Side: Mild Weather, Robust LNG Exports, Texas Negative Prices
The demand picture is genuinely two-sided. On the bullish side, U.S. LNG exports remain near record levels, with average flows to the nine major U.S. LNG export plants running at 18.9 Bcf/d in April, up from 18.6 Bcf/d in March and within striking distance of the all-time monthly record of 19.3 Bcf/d set earlier this year. The Edison Electric Institute also reported that U.S. lower-48 electricity output for the week ended April 18 rose 6.5% year-over-year to 77,299 GWh, with the trailing 52-week total up 1.8% year-over-year — confirming that power-sector demand for gas-fired generation is structurally rising as electricity consumption growth outpaces renewable additions in many regional grids.
On the bearish side, the spring shoulder season has delivered mild weather across most of the U.S. through the week of May 2, with temperatures trending below average but not extreme enough to materially boost heating demand. The Commodity Weather Group forecast that below-average temperatures will dominate through May 2, providing some marginal demand support but not enough to break the front-month out of the $2.36 to $2.70 trading band. Lower-48 state gas demand on Tuesday hit 72.4 Bcf/d, up 13.9% year-over-year per BNEF — a robust headline number that reflects the late-season cold snap, but one that LSEG forecasts will fade from 102.0 Bcf/d this week (including exports) to 100.1 Bcf/d next week as weather normalizes.
The most striking demand-side data point is the persistence of negative spot prices in certain regions. Cash-market gas in Texas and California has traded in negative territory for three consecutive weeks as mild weather has compressed both heating and cooling demand to the point where ample hydro and renewable energy is sufficient to meet load — leaving gas-fired generation pushed off the supply stack and producers paying buyers to take physical molecules off their hands. That kind of localized spot weakness underscores the structural overproduction and infrastructure constraints in specific regional markets, even though it does not change the broader fundamental picture priced into the futures curve.
The Two Time Frames: Bearish Front, Bullish Back
The current Henry Hub setup is the cleanest example of a market caught between two time frames running in opposite directions. The front-month is fundamentally short-term bearish, suppressed by the storage glut, the mild spring weather, the near-record production, and the marginal demand softness from negative cash prices in regional markets. The medium-term curve is fundamentally bullish on the LNG export ramp, the Hormuz-driven structural tightening of global supply, the seasonal pattern that historically delivers gas-price strength into Q4, and the contango that already embeds higher prices further out the curve.
Calendar-spread strategies are the cleanest expression of this divergence. Long further-out months versus short front-month positions capture both the seasonal pattern and the LNG export ramp without requiring a directional view on the front-end consolidation. Traders running these spreads have been adding length on the back-end as the Plaquemines, Elba Island, Golden Pass, and Corpus Christi capacity additions get closer to commercial operation, while staying short the front-month against the storage glut.
The short-squeeze risk is also material. The concentrated stack of short positions on the front-month contract creates the conditions for a rapid price spike if either weather deteriorates sharply or a new geopolitical trigger compounds the Hormuz disruption. The June Nymex contract has tested the $2.683 52-week low multiple times without breaking through, suggesting that short interest is heavy enough that any catalyst could trigger a violent reversal higher. The asymmetric setup favors patience — wait for the squeeze rather than fighting it.
Technical Levels: $2.36 to $2.70 Range, $2.60 Resistance, $2.85 Breakout
The actionable technical map for Nymex Natural Gas Futures Price is well-defined. Immediate support sits at $2.683 — the 52-week low — followed by the next structural floor at $2.50/MMBtu. A break below $2.50 would signal a continuation of the bear trend toward $2.36, the lower edge of the current trading band. The 1-month new-low data confirms the persistence of the bearish setup, with 11 new lows logged in the past month alone.
The upside resistance map starts at $2.60, where multiple recent rally attempts have stalled, followed by $2.70 — the upper edge of the current trading range. A confirmed break above $2.70 with rising volume opens the path to $2.85 to $2.88, the recent peak of the consolidation, and then to $3.00. The Fibonacci retracement levels imply that any sustained recovery toward the 38.2% retracement at $3.256 would require both a fundamental shift (storage normalization, weather turn, or LNG export acceleration) and a confirmed break of the $2.85 to $2.88 resistance ceiling.
The 1-month new-high data shows just one new high in the past 30 days, with the contract sitting 9.92% below that level. That asymmetry between new lows and new highs captures the market's positioning bias and explains why the rally attempts have been short-lived even as the LNG export thesis builds in the back of the curve.
Read More
-
SCHD ETF Holds Near Its All-Time High at $31.98 as the Chip Rout Crushes AI Tech and Money Rotates Into Dividend Value
23.06.2026 · TradingNEWS ArchiveStocks
-
XRP ETFs Keep Accumulating as the Token Falls: The 7-Fund Complex Locks 900M+ XRP While XRPI, XRPR Hold Their Floors
23.06.2026 · TradingNEWS ArchiveCrypto
-
Natural Gas Grinds at $3.20 as Storage Glut Caps Summer Demand; the Real Trade Is the $5 Winter Premium
23.06.2026 · TradingNEWS ArchiveCommodities
-
Yen Sits at 1986 Lows Near 161.5 as the BoJ Hike, Verbal Warnings and a Record Intervention All Fail to Stop the Slide
23.06.2026 · TradingNEWS ArchiveForex
The Geopolitical Layer: Hormuz Stalemate as the Wildcard
The geopolitical premium embedded in the gas complex is concentrated in the medium-term curve rather than the front-month. The Strait of Hormuz remains shut into the second month of the U.S.-Iran conflict, with no resolution in sight. President Trump cancelled the planned U.S. delegation trip to Pakistan for peace talks on April 25, calling it "a waste of time," and Iran has signaled that U.S. demands are excessive. The longer the strait stays closed, the more cumulative supply destruction works through global inventories, and the higher the structural premium on TTF and JKM relative to Henry Hub.
For U.S. natural gas specifically, the Hormuz situation is bullish on the medium-term but largely irrelevant to the front-month. The constraint is U.S. export capacity — until the Plaquemines, Elba Island, Golden Pass, and Corpus Christi additions come online through the back half of 2026, the marginal molecule of U.S. gas cannot reach the international premium markets, and the domestic price gets capped by the local supply-demand balance regardless of what happens in Doha or Rotterdam. As capacity ramps, the arbitrage starts to close — but the closing happens on the back-end of the curve, not on the front-month.
The Plaquemines LNG additional 0.5 Bcf/d authorization in March and the Elba Island 0.1 Bcf/d authorization in April reflect the regulatory pace of capacity expansion. These approvals are necessary but not sufficient — the physical capacity needs to come online, and the contract structure needs to support the marginal export economics. As of March, U.S. LNG exports of 17.9 Bcf/d represented the second-highest monthly volume since the December 2025 record of 18.4 Bcf/d, with terminal utilization at 94% of DOE-approved export levels.
Trade Decision: Buy, Sell, or Hold Natural Gas Futures Price Right Here
The honest read is that the natural gas complex sits at one of the most binary inflection points of the year, and the trade decision depends materially on the timeframe. For active traders working a one to three day window into the upcoming weekly EIA report and the May weather outlook, the path of least resistance is range-bound between $2.68 and $2.85 on the June contract. Stance for the active book: neutral-to-cautiously bullish, with conviction shifting to bullish on a confirmed break above $2.85 with rising volume and bearish on a daily close below $2.68. Position sizing should accommodate the binary nature of weekly EIA prints, which have repeatedly been the trigger for sharp directional moves.
For positional traders working a one to three week horizon, the discipline is to lean into the contango via calendar-spread strategies — long further-out months versus short front-month — rather than committing to a directional view on the front-end consolidation. The medium-term LNG export ramp through Q3 and Q4 provides the structural support for back-end pricing, while the front-month remains exposed to the storage glut and mild weather pattern. Stance for the positional book: cautiously bullish on the curve via spreads, neutral on absolute front-month direction.
For strategic accounts working a six to twelve month horizon, the medium-term setup is genuinely constructive. The combination of Hormuz-driven structural LNG supply destruction, the U.S. capacity additions through year-end, the European storage rebuild requirement, and the Asian summer cooling demand all support a bullish medium-term thesis on the Henry Hub-TTF-JKM arbitrage. Stance for the strategic book: bullish, with the recognition that the multi-quarter path will include drawdowns tied to weather normalization and storage builds.
The bear scenario activates on a confirmed break below $2.68 with the storage surplus widening further into the May injection season. That outcome would expose the path to $2.50 and ultimately the $2.36 lower band of the trading range. The bull scenario activates on a confirmed reclaim of $2.85 paired with either a hot summer weather turn, a Hormuz escalation, or an acceleration in U.S. LNG export capacity coming online ahead of schedule. Aggressive new shorts at $2.69 are paying for a structural floor that has held for several sessions, exposing the trade to the short-squeeze risk that the concentrated short positioning creates. Aggressive new longs without a confirmed break of $2.85 are catching a falling knife in a market that remains structurally oversupplied at the front-end.
The disciplined posture is to lean into calendar spreads rather than absolute directional length, to wait for the weekly EIA print before committing fresh tactical capital, and to recognize that the medium-term LNG thesis is durable but the front-month is a different trade entirely. Cautiously bullish on the curve, neutral on the front-month, and the next several weekly EIA reports paired with the May weather pattern are the catalysts that determine which side of the consolidation prints first. Hold existing positions, accumulate via spreads rather than outright length, and resist the urge to chase either the rebound or the breakdown before the structural confirmation arrives. The valuation is genuinely attractive on the back of the curve given the LNG export ramp and Hormuz disruption, the production response is starting to show at the margin with EQT and others trimming output, and the storage surplus is the only material headwind left to clear before the medium-term bullish thesis takes over. BUY on the curve via long-dated calendar spreads, HOLD on absolute front-month length, and recognize that the path to higher prices runs through the LNG export ramp rather than the front-month consolidation