Natural Gas Futures Price Forecast: NYMEX Futures at $2.70 Compress Between Seasonal Demand Void
US production drops 3.9 bcfd while LNG exports hit record 18.9 bcfd; break above $2.85 opens $3.00 and $3.40 targets | That's TradingNEWS
Key Points
- Natural Gas Futures trade at $2.697/mmBtu as storage runs 7% above normal while Iran war hits 20% of global LNG.
- US production drops to 108.3 bcfd while LNG exports hit record 18.9 bcfd at nine major export terminals.
- Break above $2.85 targets $3.00 and $3.40 BofA year-end; Waha Hub prints negative pricing for record 51 days.
U.S. Natural Gas Futures Price on the NYMEX front-month May contract is changing hands at $2.697 per mmBtu, up roughly 0.33-0.45% on the session and closing at the highest level since April 8 for a second consecutive day. The contract has been compressed into a tight trading band through the spring shoulder season, with the commodity caught between two genuinely powerful and opposing forces that define the current moment in a way no other commodity market can replicate. On one side, mild weather across the Lower 48 is crushing heating demand and allowing storage injections that pushed inventories to approximately 7% above normal as of the week ending April 17 — a bearish setup that typically caps price upside through May. On the other side, the U.S.-Iran war has triggered a global energy crisis, with the near-closure of the Strait of Hormuz disrupting roughly 20% of global LNG supply, European gas prices up 25% versus pre-war levels (having briefly spiked 60% during peak panic), and governments across Europe and Asia scrambling to secure winter supplies that will increasingly depend on U.S. LNG exports to keep the lights on. The resulting compression is a textbook setup where summer heat and European winter demand could detonate prices higher, while the current seasonal demand void keeps a lid on every rally attempt. The price action over the next 4-6 weeks will reveal which force wins, and the numbers underneath the tape tell a story most generalist traders are still not pricing correctly.
The Current Price Setup Reveals a Pure Compression Regime
Natural gas front-month futures on NYMEX (NG=F) settled at $2.697 per mmBtu on Monday, then continued edging higher Tuesday to the $2.70 handle as traders digested the fresh Iranian vessel seizure in the Gulf of Oman and oil's 4.93% rip in WTI. The intraday range has been exceptionally tight — moves of less than a cent are dominating daily price action, which reflects genuine market uncertainty rather than directional conviction in either direction. Long-time natural gas trader John Woods flagged that $2.70 feels "a tad high" for a shoulder-season contract, noting the market will likely continue trading sideways until warmer weather drives actual demand. His framing was telling: the market will eventually bust through $3.00, but not until mid-May or so, and in the meantime traders are stuck inside a box for lack of a better description.
Bank of America Global Research has lowered its Henry Hub price estimate for the remainder of 2026 by 20 cents to $3.40 per mmBtu, reflecting the impact of mild weather that ended winter with healthy storage and continued into April. Analysts Clifton White and Francisco Blanch noted that the market does struggle during peak cold events, but typically has plenty of spare midstream capacity during summer months that reduces the risk of spiking prices even during peak heat. That capacity cushion is arguably the single biggest reason natural gas has stayed range-bound despite the geopolitical chaos dominating the broader energy complex. When you can physically move more gas than the market needs during the cooling season, supply shocks get absorbed rather than amplified.
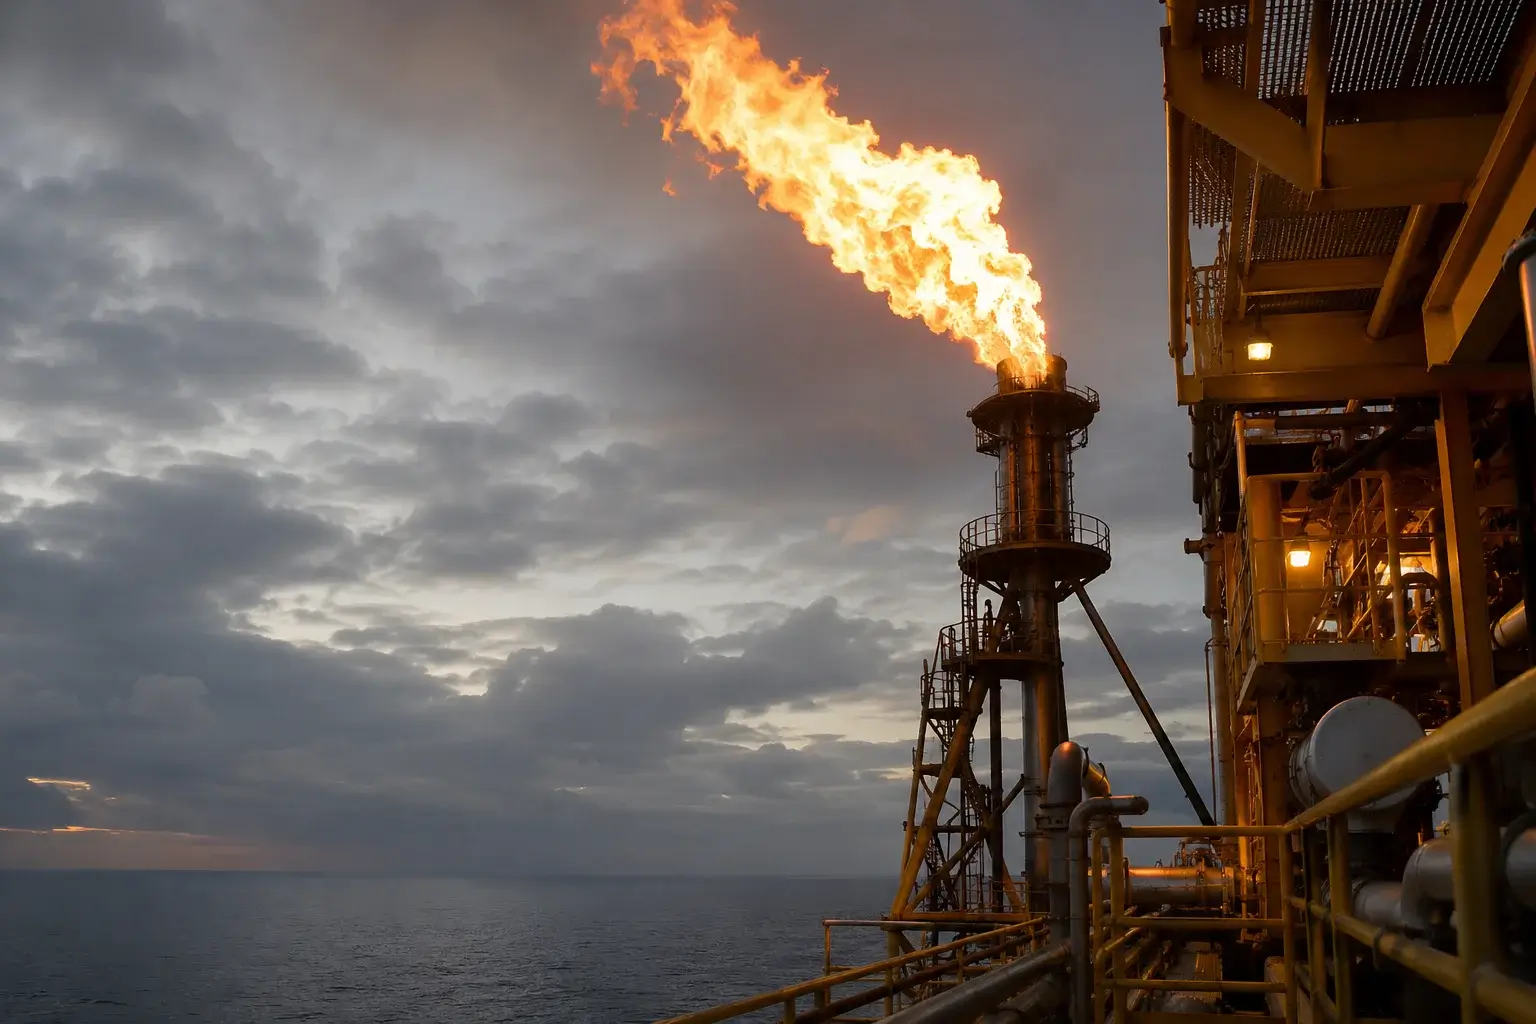
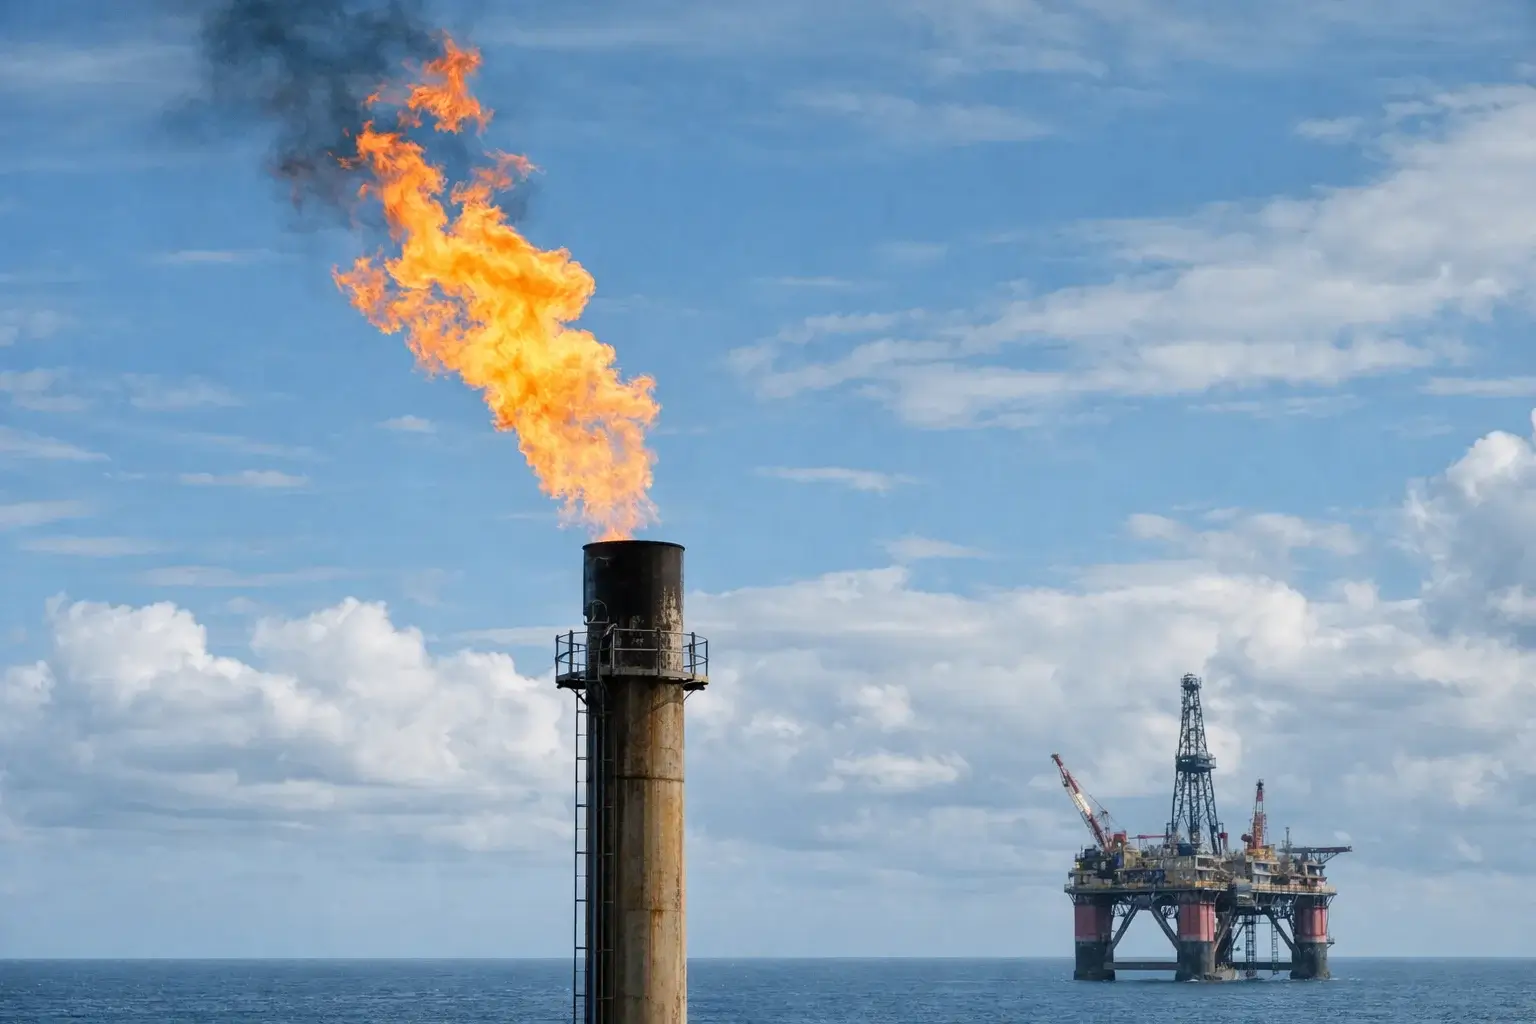
Supply Side Dynamics: Production Drop Meets Record-Breaking LNG Export Demand
Here is where the numbers start telling a more nuanced story that deserves careful unpacking. Average gas output in the U.S. Lower 48 has held at 110.4 billion cubic feet per day so far in April according to LSEG data — essentially the same pace as March, but notably below the monthly record of 110.7 bcfd set in December 2025. The concerning wrinkle is the daily output trajectory: production was on track to drop by around 3.9 bcfd over the past 14 days to a preliminary 10-week low of 108.3 bcfd on Monday. That is a meaningful compression on the supply side even before Iran-driven export demand enters the picture, and preliminary data is often revised later so the actual decline could be even sharper than currently reported.
On the demand side, average gas flows to the nine major U.S. LNG export plants climbed to 18.9 bcfd so far in April, up from 18.6 bcfd in March and exceeding the February monthly record of 18.7 bcfd. A tanker has already arrived at the QatarEnergy/ExxonMobil 2.4 bcfd Golden Pass facility in Texas to collect the plant's inaugural export — an incremental demand sink that simply did not exist in prior months and represents net new structural demand rather than a seasonal fluctuation. With European buyers scrambling for winter supplies after damage to Qatari pipelines from the Iran war, the U.S. LNG export machine is running near absolute capacity, and every additional molecule flowing to export terminals is one fewer available for domestic consumption. This is the kind of bifurcation that typically precedes major price moves because the domestic market cannot rely on exports slowing to absorb excess supply.
The Waha Hub Negative Pricing Anomaly Exposes Permian Infrastructure Stress
One of the most underappreciated stories in the current natural gas market is the extraordinary price dislocation at the Waha Hub in West Texas. Average prices at Waha have remained in negative territory for a record-breaking 51 consecutive days, with pipeline constraints continuing to trap gas in the Permian region — the largest oil-producing shale basin in the United States and a region where natural gas is produced primarily as associated gas alongside crude oil. The historical context is genuinely extreme and worth documenting: daily Waha prices first averaged below zero in 2019, then did so 17 times that year, six times in 2020, once in 2023, 49 times in 2024, 39 times in 2025, and a record 60 times so far in 2026 alone. The trajectory is accelerating rather than normalizing.
Waha has averaged negative $1.83 per mmBtu so far in 2026, compared to positive $1.15 in 2025 and positive $2.88 averaged across 2021-2025. That is not a rounding error — it is a structural infrastructure failure where associated gas produced alongside Permian oil has nowhere to go because pipeline takeaway capacity cannot keep up with the combined expansion of oil production and the methane-regulation pressure forcing producers to avoid flaring. Producers are effectively paying counterparties to take the gas rather than flaring it under tightening methane rules. The practical implication for Natural Gas Futures Price is that this trapped Permian supply represents a massive latent inventory waiting for new pipeline capacity to eventually release it into broader markets, which could cap prices over the medium term even if Henry Hub supply tightens.
Storage Injection Dynamics Create Near-Term Ceiling on Prices
The storage picture is the other critical bearish factor currently weighing on prices and needs direct treatment. Mild weather through spring has allowed energy firms to inject more gas into storage than seasonal norms, lifting inventories to approximately 7% above normal as of the week ending April 17 — an increase from the 6% above-normal reading the prior week. That cushion is precisely what permits price stability during the current low-demand window, but it also creates headroom that could absorb early-summer demand spikes without triggering price spikes. Storage effectively functions as a capacity buffer that muffles price volatility until it gets drawn down through sustained demand pressure.
Meteorologists are forecasting weather to remain mostly near normal through May 5. LSEG projected average gas demand in the Lower 48 states including exports will slide from 103.6 bcfd this week to 101.5 bcfd next week — a 2.1 bcfd decline that reflects the seasonal sweet spot between heating demand rolling off and cooling demand not yet building. Those forecasts actually came in higher than LSEG's Friday outlook, suggesting the demand picture is marginally better than previously expected. Still, this is the lowest-demand stretch of the calendar year for natural gas, and it historically marks the worst environment for prices. The market is navigating through the demand trough while carrying elevated storage, which is why every rally attempt has been sold into.
European Gas Market Crisis Provides the Real Directional Variable
The UK National Balancing Point (NBP) natural gas futures have been delivering far more volatile price action than their U.S. counterparts, and the disparity matters enormously for anticipating future U.S. price direction. UK gas futures climbed above 105 pence per therm Tuesday, rebounding from a seven-week low of 97.11 reached on April 17, as markets focus on potential U.S.-Iran talks ahead of the fragile ceasefire deadline. European gas prices had at one point soared 60% from pre-war levels during the March panic phase, while the current increase is still 25% — elevated but well off the panic highs as buyers have adjusted to the new regime and confirmed alternative supply routes.
The fundamental setup in Europe is genuinely dangerous and traders underestimating this risk are missing the core driver of the next leg higher. The near-closure of the Strait of Hormuz has disrupted approximately one-fifth of global LNG supply, though weaker demand from Asia has eased some pressure on European buyers who would otherwise be competing aggressively for the scarce Atlantic-basin cargoes. National Gas, the UK transmission operator, said domestic inventories should be sufficient to meet summer demand and may even support limited exports to Europe — a rare cushion that could tighten rapidly if the Iran situation worsens through summer. That tightening would mechanically push demand back into the U.S. LNG export channel and squeeze domestic supplies during the exact period when cooling demand peaks.
European Regulatory Response Reveals Depth of the Crisis
Aleksander Mervar, CEO of Slovenia's transmission system operator ELES, recently flagged that wholesale electricity prices for late 2026 delivery are running 40% higher than pre-war levels — a benchmark that tells you how severely the energy shock is flowing through the European power complex. The Slovenian government has imposed mandatory state approval for any electricity or natural gas price increase affecting households, small businesses, kindergartens, primary schools, health centers, and basic social services for the next six months. That represents a direct regulatory response to energy-driven inflation that underscores how severe the European energy stress has become.
When governments start imposing price caps and mandating approval for energy price increases, you know the underlying fundamentals are genuinely dangerous. Slovenia is not an outlier — similar energy cost pressures are propagating across Germany, France, Italy, and the broader European Union, with political pressure building rapidly for direct intervention in energy markets. That pressure will translate into accelerated long-term LNG purchase contracts with U.S. exporters as European governments prioritize supply security over price optimization, and those contracts will tighten the U.S. domestic supply picture through late 2026 and into 2027.
The Iran War Dimension and Qatari Pipeline Damage Assessment
The geopolitical catalyst driving potential upside for U.S. Natural Gas Futures Price is specific and identifiable rather than abstract. Damage to Qatari pipeline infrastructure during the Iran war — particularly around the Ras Laffan energy complex that Iran struck in retaliation for Israeli attacks on the South Pars gas field — has reduced Qatar's ability to deliver LNG to European buyers. South Pars is the world's largest known natural gas reserve at approximately 1,800 trillion cubic feet and represents a cornerstone of Iran's energy infrastructure. The reciprocal damage to Ras Laffan means both sides of the Strait of Hormuz have taken hits to their ability to produce and export natural gas.
The question dominating every natural gas desk right now is how much additional LNG Europe will need to buy from the U.S. through the coming winter. If Qatari pipeline damage takes 12-18 months to fully repair — which current industry estimates suggest given the complexity of deepwater pipeline reconstruction — European winter demand for U.S. LNG could surge by 2-3 bcfd above normal, which would tighten the U.S. domestic supply-demand balance significantly. That structural demand shift could materialize starting in late summer or early fall as European buyers lock in winter supply through long-dated purchase contracts, which is precisely when U.S. cooling demand peaks and storage begins getting drawn down for the winter cycle.
The U.S.-Iran Ceasefire Binary Drives Near-Term Volatility
The Iran ceasefire expires late Wednesday Washington time, and the two-week pause to hostilities is explicitly set to end at 8 p.m. Eastern time Wednesday or midnight GMT Thursday according to Pakistani sources cited by Reuters. President Trump has accused Tehran of violating the truce "numerous times" without providing specifics, while simultaneously telling CNBC he expects the U.S. to make a "great deal" with Iran and that America is in a "very strong negotiating position." The messaging contradiction is creating exactly the kind of headline-driven volatility that makes clean directional trades on natural gas difficult to execute over the very short term.
Vice President JD Vance's trip to Islamabad for a second round of talks has been reportedly put on hold, adding another layer of uncertainty to the timeline. If the ceasefire lapses with renewed military action, oil prices could push above $110 and natural gas prices would likely follow through the correlated energy complex lift — potentially pushing NYMEX futures through $2.80 and toward $3.00. If the ceasefire extends with a genuine framework for peace and the Strait of Hormuz reopens durably, gas prices could compress back toward $2.55-$2.60 as the risk premium deflates. The binary nature of the catalyst makes conservative sizing essential in the days leading up to the expiration window.
Technical Framework and Critical Price Levels
On the chart, NYMEX Natural Gas Futures Price (NG=F) has well-defined technical levels that matter for positioning decisions. Immediate resistance sits at $2.70 (psychological and current price level), then $2.75 (recent swing high zone), followed by $2.80 as the next meaningful barrier, and $3.00 as the critical psychological ceiling combined with the 50-day exponential moving average confluence. A decisive break above $3.00 would signal a genuine trend change rather than range-bound chop, and would likely trigger accelerating short-covering from speculative positions that have been comfortable selling rallies.
On the downside, near-term support stacks at $2.65, then $2.60, followed by $2.55 as the recent demand pocket, and $2.45 as the deeper structural floor that aligns with the late-winter low. Daily candlesticks have been compressing into tight ranges — perfectly normal behavior for this time of year — which mechanically builds pressure for an eventual expansion move. Longer upper wicks on recent rally attempts suggest that sellers remain active on any approach to the $2.75-$2.80 zone, which is exactly what trader Christopher Lewis flagged when he said he views rallies toward $3.00 as opportunities to short against the 50-day EMA resistance.
Seasonal Demand Pattern and Summer Heat Catalyst Timing
The natural gas market is transitioning through one of its most predictable annual patterns, and understanding that seasonality is essential for any serious price forecast. Heating demand essentially ended in late March, cooling demand typically doesn't ramp meaningfully until mid-May or later depending on temperature trajectories, and the shoulder period between is historically the weakest demand window of the calendar year. This is why natural gas traders describe spring as shoulder season — it represents shoulders on a demand curve that peaks in both winter heating and summer cooling.
Once cooling demand begins building, the acceleration can be rapid. A single extended heat wave through the U.S. South and Midwest can drive gas demand up 5-8 bcfd within days as electric utilities fire up gas-fired peaker plants to meet air conditioning load. Those demand spikes are generally short-lived, lasting a few weeks at most during the summer, but they reliably occur and they tend to coincide with storage drawdowns that tighten the spot market meaningfully. The critical variable this year is how hot the summer actually gets — La Niña conditions projected for late 2026 could produce a hotter-than-normal summer across the Southern U.S., which would accelerate cooling demand and push gas prices higher faster than the shoulder-season compression suggests.
Scenario-Weighted Paths Over the Coming Six Weeks
The probability distribution for natural gas over the next 4-6 weeks breaks out with precision that serious traders need to respect. The base case at roughly 45% weight has NYMEX futures consolidating in the $2.55-$2.85 range through late May, with shoulder-season demand void and strong storage offsetting Iran-related supply concerns and elevated LNG export flows. Under this scenario, the expected closing trajectory tracks toward $2.80-$3.00 by mid-June as summer demand begins building and European winter buying activity intensifies. This is the "muddle-through" path where nothing extreme happens in either direction.
The bullish scenario at 30% weight involves Iran ceasefire collapse with renewed military action, Qatari pipeline damage proving structural rather than temporary, European buyers accelerating U.S. LNG purchases to lock in winter supply, summer heat arriving earlier than normal, and production continuing to decline from the current 108.3 bcfd pace. Under this path, NYMEX futures break above $3.00 in May and could test $3.40-$3.60 through summer, consistent with Bank of America's revised $3.40 year-end target. Winter 2026-2027 positioning could push prices toward $4.00 if multiple bullish factors align. The bearish scenario at 25% weight involves a clean Iran diplomatic breakthrough, Qatari pipelines returning to service faster than expected, mild weather extending through May and into early summer, production rebounding above 110 bcfd, and storage injections continuing at above-normal pace. Under this scenario, NYMEX futures could flush back to $2.40 support and potentially test $2.20 if the bearish confluence fully materializes.
Read More
-
FDMO's 39% Year Rides the AI Momentum Trade — and the June Volatility Tested It
12.06.2026 · TradingNEWS ArchiveStocks
-
XRP ETFs Post Record Inflows and 840 Million Locked Tokens — But the Price Still Fell to $1.15
12.06.2026 · TradingNEWS ArchiveCrypto
-
Natural Gas Holds $3.15 as a 108 Bcf Storage Build Battles Late-June Heat
12.06.2026 · TradingNEWS ArchiveCommodities
-
Dollar-Yen Presses 160 as a Record Rate Gap Battles Japan's Intervention Line
12.06.2026 · TradingNEWS ArchiveForex
Trade Management Framework for Active Positioning
For traders positioning around current levels, the discipline framework is straightforward but must be respected. Long exposure only makes sense on confirmed break above $2.85 with volume, targeting $3.00 first and $3.20 on extension, with stops below $2.65 to cap risk. Short exposure activates only below $2.55 with acceptance, targeting $2.45 first and $2.30 on breakdown, with stops above $2.75 to avoid getting whipsawed. The dead zone between $2.65 and $2.85 is where directional edge disappears — forcing trades in that band is a classic mistake during seasonal compression periods and leads to death by a thousand cuts as tight ranges eat into capital.
Position sizing should reflect the binary event risk over the coming days. The Iran ceasefire expiration Wednesday and the potential for European LNG buying to accelerate before winter create specific catalyst windows where conservative sizing is essential. Natural gas has demonstrated capability for 10-20% single-session moves when supply shock catalysts align, and those moves tend to occur with minimal warning. Proper position sizing means surviving the binary catalyst rather than maximizing the upside capture.
Winter 2026-2027 Positioning Is the Real Strategic Opportunity
The single most underappreciated variable in the current natural gas setup is what happens when winter arrives. If Qatari pipeline damage requires 12-18 months to fully repair — which aligns with industry estimates for major LNG infrastructure reconstruction in shallow-water environments, let alone the deepwater complexity of some Qatar infrastructure — European gas buyers will be fundamentally dependent on U.S. LNG exports through the 2026-2027 winter. Trader Christopher Lewis flagged this directly: the real question is how much natural gas Europeans will need to be buying from the United States this winter after the damage to Qatari pipelines.
That structural demand shift would require U.S. producers to balance domestic supply adequacy against export revenue opportunities, potentially tightening Henry Hub pricing meaningfully from late summer onwards. If winter arrives cold across both Europe and the U.S. East Coast simultaneously — which is possible given La Niña climate patterns projected for late 2026 — NYMEX Natural Gas Futures Price could test the $4.00-$4.50 zone, representing a 50-65% rally from current levels. That is the tail-risk scenario worth positioning for rather than chasing after the fact. Long-dated futures contracts for December 2026 and January 2027 delivery are currently pricing meaningfully higher than the front month, but arguably still underweight the structural supply risk facing Europe through winter.
Related Equity Plays on the Natural Gas Thesis
For investors looking to express the natural gas view through equities rather than futures, several liquid options exist. U.S. LNG export companies like Cheniere Energy (LNG) and NextDecade (NEXT) benefit directly from elevated export volumes and European demand. Natural gas producers with strong Henry Hub exposure including EQT Corporation (EQT) and Coterra Energy (CTRA) offer operational leverage to sustained price strength. Diversified energy names like ExxonMobil (XOM) with its integrated LNG operations and Chevron (CVX) with upstream gas production capture the theme with less single-commodity risk. The United States Natural Gas Fund (UNG) offers the cleanest ETF exposure to futures pricing but suffers from contango roll cost erosion that makes it better suited to tactical positioning than long-term hold strategies.
My Natural Gas Call: Hold Now With Buy Trigger Above $2.85 and Structural Bullish Bias Into Winter
NYMEX Natural Gas Futures Price at $2.697 per mmBtu is a Hold within the current range, upgrading to Buy on confirmed break above $2.85 targeting $3.00 and $3.40, with Sell bias only on breakdown below $2.55 toward $2.40 support. The near-term tactical setup is frustrating because the shoulder season demand void and elevated storage directly conflict with the geopolitical supply shock and LNG export demand acceleration. Every bullish factor has a bearish counter in the current tape, which is why the market has delivered such tight ranges over recent weeks and why trying to force directional trades has been a losing strategy for most speculators.
Strategically, however, the directional bias leans bullish over a 4-6 month horizon and that horizon is where serious capital should be positioning. The combination of declining U.S. production (down 3.9 bcfd over the past two weeks to 108.3 bcfd), record-high LNG export flows (18.9 bcfd April run-rate against the prior record of 18.7 bcfd), damaged Qatari pipeline infrastructure that will drive European buyers toward U.S. suppliers for winter, potential Iran escalation that could tighten global LNG further through renewed disruption, and the inevitable seasonal transition from shoulder-season weakness to summer cooling demand all point higher. Bank of America's $3.40 Henry Hub target for year-end 2026 — downgraded from higher levels but still implying 26% upside from current prices — reflects precisely this fundamental framework and in my view may actually understate the structural supply risk into winter.
The Waha Hub negative pricing situation creates an important wrinkle that cannot be ignored in any honest analysis. Trapped Permian supply represents latent inventory that could flood markets if new pipeline capacity comes online, which would cap upside in Henry Hub pricing over the medium term. The timing of when that pipeline capacity materializes is uncertain but likely falls in late 2026 or 2027, meaning near-term price setup is not directly constrained by Waha dynamics but longer-horizon bullish cases need to factor in that eventual supply release.
For active traders: respect the $2.85 breakout trigger, use tight stops at $2.55 for short exposure only, accept that shoulder-season ranges typically deliver disappointing returns to directional strategies, and reserve aggressive sizing for either the Iran binary catalyst or the late-May transition into cooling demand. For longer-term allocators positioning for winter 2026-2027: accumulating natural gas exposure through ETFs like UNG or futures-tracking vehicles at current levels offers asymmetric upside to $4.00+ if the European supply-tightening thesis plays out through autumn, with cleanly defined downside to $2.40 as the natural stop. The market is in a frustrating compression that will eventually resolve violently, and every structural factor — production decline, LNG export growth, Qatari damage, European regulatory desperation, and winter positioning — points toward higher prices over the medium term even as the current tape grinds sideways. The discipline play is patience now, positioning aggressively as cooling demand transitions from theoretical to actual, and maintaining bullish exposure through the winter catalyst window when European LNG demand forces the domestic U.S. market to tighten meaningfully.