Natural Gas Holds $3.30 on Expiry Day as Next Week's Heat Wave Overpowers a Bearish Storage Print and Record Production
July futures ticked higher into Friday's final settlement near $3.30 despite a larger-than-expected 76 Bcf injection | That's TradingNEWS
Key Points
- Natural gas July futures held near $3.30 on expiry day as next week's heat overpowered a bearish 76 Bcf injection.
- Record 117 Bcf/d production and storage 7% above the 5-year average cap the upside; LNG and power burn floor it.
- The curve prices December above $4; the base case sees a Q4 ramp toward $4–$4.50 as winter demand returns.
Natural gas is winning a fight it had no business winning this week. The July NYMEX contract trades near $3.30/MMBtu in Friday dealing, ticking higher in early trade ahead of its final settlement this afternoon, even after the government dropped a bearish storage number that should have knocked it lower. The prompt has averaged $3.19/MMBtu for the month through June 24 and settled at $3.22 on Wednesday, so the move back toward $3.30 on expiry day is a statement: the bulls have the upper hand despite a supply-and-storage backdrop that leans the other way. The reason is simple and it's the thesis driving every tick — heat trumps storage.
This is a weather-driven tug-of-war where near-term heat is overpowering a structurally bearish supply-and-storage picture, keeping the prompt pinned near $3.30 with the next leg dictated by whether the forecast heat materializes. The bearish case is loaded: record Lower 48 production near 117 Bcf/d, storage tracking comfortably above the five-year average, LNG feedgas dipping on seasonal maintenance, and the June 15 US-Iran memorandum easing the global supply-risk premium. The bullish case is narrower but immediate: forecasts calling for widespread heat next week, trending hotter overnight, driving a surge in cooling demand that's pulling the focus away from the storage overhang. So the market sits in a tight $3.19-$3.34 band, capped above by abundant supply and floored below by summer demand and LNG, with the weather forecast the swing factor that decides the daily direction. Right now, the heat is doing the talking, and the prompt is holding its ground into expiry.
The Bearish 76 Bcf Injection That Didn't Stick
The storage report this week was a clear miss to the bearish side, and the initial reaction was violent. The EIA reported a 76 Bcf net injection of natural gas into storage for the week ended June 19 — a larger-than-expected result compared to consensus estimates that sent prices plummeting on Thursday morning. A bigger-than-forecast injection means more gas is being stuffed into storage than the market anticipated, which signals looser balances and typically pressures prices lower. The knee-jerk selloff was the textbook response.
But the selling didn't hold. Natural gas futures rebounded Thursday after the early sell-off as the focus shifted back to forecasts calling for widespread heat next week, with July rallying in its penultimate session as the prompt month and August also settling higher despite the initial storage-driven retreat. That reversal is the tell. When a market gets a bearish report, sells off, and then closes higher, it's a sign the bears couldn't capitalize on their own news — the underlying bid is stronger than the headline suggests. The 76 Bcf injection confirmed the comfortable supply picture, but the crowd looked past it to the demand that's coming. The injection that should have broken the market instead became a buying opportunity as the heat forecasts trumped the storage data. That dynamic — a bearish print that fails to stick — is the clearest evidence that the near-term momentum belongs to the bulls, and it set up the firm tone heading into Friday's expiry. The storage overhang is real, but the market has decided it's not the story right now.
The Heat Wave Doing the Heavy Lifting
The single force holding natural gas up is the weather, and the forecasts have turned decisively hot. Already-bullish near-term forecasts trended hotter still overnight, which is what lifted futures in early Friday trade, and the projection is for widespread heat across the country next week. That heat translates directly into natural gas demand because air conditioning runs on electricity, and natural gas fuels more than 40% of US power generation — every above-normal cooling-degree day drives additional gas-fired generation.
The heat is already showing up in the cash market. Intense heat across Florida, the Southern Plains, and much of the West boosted cooling demand midweek, lifting premium markets across the Southeast and extending a recovery at West Texas hubs. Cash prices mostly strengthened as broad gains across Gulf Coast production-area hubs signaled strong regional demand, with expanding LNG export demand and building Southern heat offsetting weather-driven weakness across the West. Power burn — the volume of gas consumed for electricity generation — is the single largest variable during injection season, and it's surging as the cooling load builds. The forecast heat for next week is what's giving the bulls confidence that the demand surge has staying power, not just a one-day spike. As long as the forecasts keep trending hotter, the cooling demand provides the floor under prices that's absorbing the bearish storage and production data. The heat wave is doing the heavy lifting in this market, and the prompt's resilience near $3.30 is a direct function of how hot next week is shaping up to be. Weather is the whole game in the near term.
The Cooler Mid-June Wobble
The heat story isn't a straight line, and the recent past shows why the market has been choppy. After four consecutive weeks of warmer trends, US temperatures turned cooler in mid-June — for the week ending June 20, temperatures were 18% cooler than last year and 2% cooler than the 30-year normal, measured by cooling-degree days weighted by air-conditioning customers. That cool spell is part of why the prompt edged lower from its June 4 four-month high, drifting down toward the $3.19 monthly average before this week's heat-driven bounce.
The mid-June wobble illustrates the volatility inherent in a weather-driven market. Natural gas prices swing on forecast revisions, and a stretch of cooler-than-normal temperatures cut cooling demand at exactly the moment the bulls needed it to build. That cooler patch capped the rally that had pushed the prompt to its June 4 high and kept the month-to-date average subdued at $3.19. The whipsaw — warm, then cool, then warm again — is the signature of shoulder-season-into-summer trading, where the weather hasn't settled into a consistent pattern. What matters now is that the forecasts have flipped hot again for next week, reversing the cooler mid-June drag. But the wobble is a reminder that the heat-driven bid is only as durable as the next forecast revision, and a swing back to cooler projections would pull the prompt straight back toward the lower end of its range. The market is hostage to the weather models, and the mid-June cool spell showed how quickly the demand picture can soften when the heat fades.
Record Production Is the Ceiling
The reason natural gas can't sustain a bigger rally is sitting on the supply side, and it's at record levels. Lower 48 marketed gas production averaged 117.2 Bcf/d in Q1 2026, up 4% year over year, and US dry natural gas production remains on track to set a new annual record in 2026 — year-to-date output through early June ran nearly 4% higher than the same period last year. That flood of supply is the ceiling that caps every price advance.
The production surge is driven primarily by associated gas from the Permian Basin — gas that comes out of the ground alongside crude oil. With oil drilling incentivized by higher oil prices earlier this year, Permian wells are producing more associated gas as a byproduct, and that supply keeps coming regardless of natural gas prices because it's tied to oil economics rather than gas economics. The EIA forecasts 2026 production growth of 3.3%, about 3.9 Bcf/d, with the Permian driving most of the increase. Production has stayed resilient even as drilling activity moderated and lower prices pressured output, because the associated gas keeps flowing. That structural oversupply is why the EIA keeps lowering its price forecasts and why storage stays comfortable — there's simply a lot of gas being produced. The record production is the fundamental counterweight to the bullish demand story: every time heat lifts demand, the supply is there to meet it, which prevents prices from running away to the upside. The ceiling is real, and it's made of Permian associated gas that isn't going anywhere.
Storage Is Comfortable Above the Five-Year Average
The storage picture reinforces the supply-side caution, and the math is reassuring for the bears. The 2026 injection season began with working gas at 1,829 Bcf — right at the five-year average — and the industry needs to inject roughly 2,000 Bcf by November 1 for a comfortable winter cushion, requiring a pace of about 67 Bcf/week that's well within the system's historical capability. This week's 76 Bcf injection actually ran ahead of that required pace, confirming the refill is proceeding without stress.
The forward storage trajectory is the bearish anchor. The EIA expects inventories to end October roughly 7% above the prior five-year average, with the June outlook projecting end-of-October working gas nearly 80 Bcf higher than the January forecast — levels that would exceed the five-year maximum. Storage that comfortable removes the scarcity premium that drives prices higher; periods with above-average inventories are generally associated with lower prices, while tight storage corresponds with higher prices. So the storage picture is doing exactly what the production picture is doing: capping the upside. With the refill on track and inventories projected to finish the injection season well above the five-year average, the market has little reason to price in winter scarcity at the front of the curve. The comfortable storage is the second pillar of the bearish case, alongside record production, and it's why the heat-driven rallies keep running into resistance. The gas is there, it's being stored efficiently, and the cushion heading into winter looks ample — all of which weighs on the prompt even as cooling demand builds.
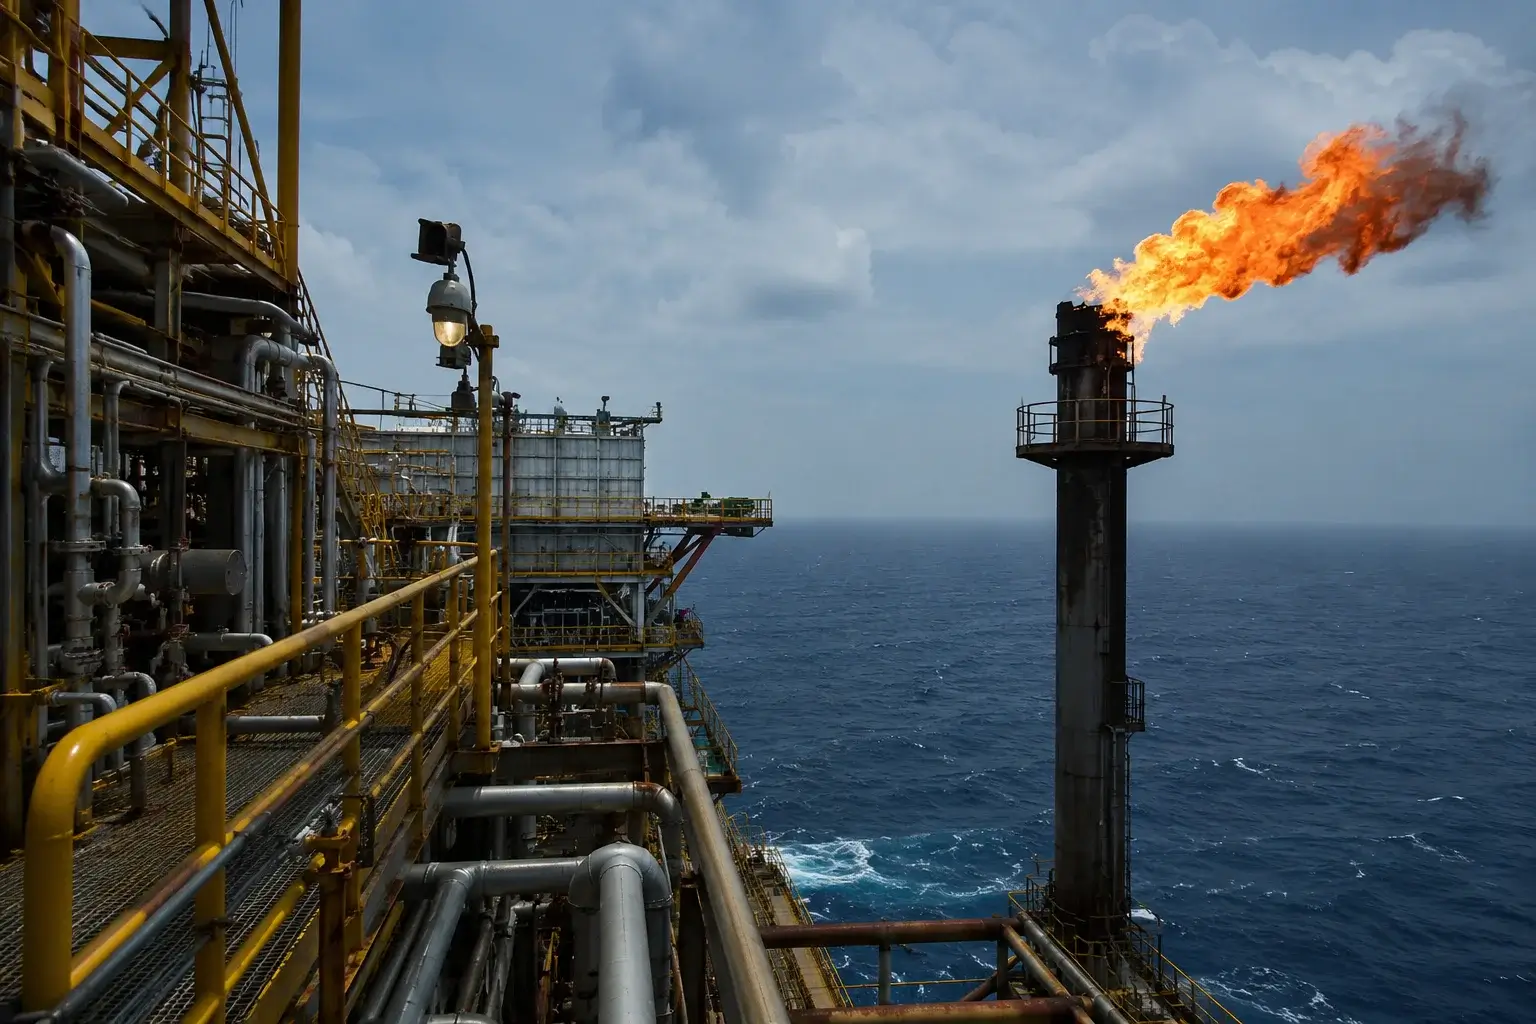
The LNG Floor
If production and storage are the ceiling, LNG exports are the floor, and that floor is rising structurally. US LNG export capacity now runs around 17 Bcf/d, and LNG feedgas demand is forecast to grow 9% (1.3 Bcf/d) in 2026 and 11% (1.7 Bcf/d) in 2027 — making it the single largest source of incremental demand over the forecast period. Three new export facilities — Plaquemines LNG, Corpus Christi Stage 3, and Golden Pass LNG — are ramping up, each adding a firmer floor under Henry Hub as they pull more gas into the export channel.
The LNG dynamic is the structural bull case that offsets the bearish supply picture. Every Bcf/d of LNG capacity that comes online removes gas from the domestic market, tightening balances and supporting prices. The export demand has made sustained prices below $2.50/MMBtu increasingly unlikely in a world of 17-plus Bcf/d of capacity, and Europe's structural reliance on US LNG — as it continues reducing Russian pipeline gas dependence — provides a long-term anchor. The near-term wrinkle is that LNG feedgas demand has declined following scheduled seasonal maintenance at US liquefaction facilities, which temporarily reduces the export pull and adds a softening factor this summer. But the maintenance is seasonal and temporary, and the structural trajectory is firmly upward. The LNG floor is what separates this market from previous gluts — the export demand provides a permanent bid that didn't exist in years past, and it's why the bears can cap rallies but struggle to break the market down toward the $2 level that record production might otherwise suggest. LNG is the structural counterweight to the Permian supply flood.
The Hormuz and Iran Wildcard
A geopolitical thread runs through the global gas picture, and it cuts in the bearish direction for now. On June 15, the US and Iran signed a memorandum of understanding that, according to Rystad Energy, reduces the likelihood of near-term disruptions to global energy flows through the Strait of Hormuz and lowers the probability of an immediate energy supply shock. Global natural gas supply levels stand to increase substantially if the US and Iran can seal a deal to end their Middle East war and free up a vital trade route for the region's LNG exports.
The Hormuz reopening is a bearish factor for global gas because it would unlock supply that had been bottled up by the conflict. Vessels have ramped up crossings through the strait since the preliminary deal, creating limited optimism that commodity flows could return to normal — which would ease the supply-risk premium that had supported prices during the conflict. But the situation remains fluid: another attack was reported in the waterway Thursday, and major questions linger as doubts about a near-term agreement persist. So the Hormuz wildcard is a two-way risk. A durable deal that fully reopens the strait would add global LNG supply and pressure prices, while a breakdown or renewed conflict would re-tighten the global market and support them. For US Henry Hub specifically, the effect is more indirect than for oil — domestic gas is priced on domestic balances — but the global LNG arbitrage matters as US exports increasingly tie domestic prices to international demand. The Iran MOU is part of why the global supply-risk premium has eased, and it's a background bearish factor that complements the record-production and comfortable-storage story. The geopolitical premium that supported gas during the conflict is unwinding, even as the situation stays unresolved.
Power Burn and the Summer Demand Engine
The demand side of the equation runs on cooling, and the summer engine is firing. EIA forecasts domestic demand this summer to increase 2.3% over the same period last year, averaging 76.7 Bcf/d across June, July, and August, with the increase driven by power-sector consumption as air conditioning loads build. Month-to-date through June 25, electric power consumption rose 27.1% month over month as warmer temperatures lifted cooling demand — a powerful jump that shows the summer demand engine accelerating.
Power burn is the seasonal growth driver, and the numbers are meaningful. Natural gas is forecast to make up more than 44% of US electricity generation at the summer peak, with monthly generation projected to peak at 434.8 billion kilowatt-hours, and above-average summer temperatures contributing to a 3% increase in forecast US electricity generation compared with the summer of 2025. That power-sector pull is the demand that offsets the seasonal collapse in heating demand — residential and commercial consumption fell 39.4% month over month as space-heating needs faded, and industrial demand hit its seasonal low for the year in June. So the summer demand story is entirely about cooling and power burn, and the 27.1% month-over-month jump in power consumption is the engine keeping the floor under prices. As the heat builds next week, the power burn climbs further, pulling more gas into generation and tightening the daily balances. The summer demand engine is the bullish demand counterweight to the bearish supply picture, and its strength depends directly on how hot the summer runs. The hotter the forecast, the more power burn, the firmer the floor.
Read More
-
FDVV Slips Near $60 as the "High Dividend" ETF's Hidden Tech Top — NVIDIA, Apple, Microsoft — Gets Caught in the AI Air Pocket
26.06.2026 · TradingNEWS ArchiveStocks
-
IBIT Drives Bitcoin ETF Flows Negative for 2026 as $7.2B Exits Across Two Record Streaks — But On-Chain Data Says Cyclical, Not Structural
26.06.2026 · TradingNEWS ArchiveCrypto
-
Crude Sinks Toward $69 as the War Premium Unwinds, Hormuz Reopens, and Saudi Arabia Floods the Market With Barrels
26.06.2026 · TradingNEWS ArchiveCommodities
-
Dollar-Yen Grinds to 40-Year Highs Near ¥161.70 as the Warsh Fed Keeps the Rate Gap Wide and Tokyo's Intervention Threat Loses Its Bite
26.06.2026 · TradingNEWS ArchiveForex
The Forward Curve Says Winter
The shape of the futures curve reveals what the market really thinks, and it's pricing a winter re-tightening. The prompt July contract settled $0.20/MMBtu below the average 12-month strip on June 24, meaning the front of the curve trades at a discount to the deferred contracts — a structure that signals the market expects stronger demand over the next year, particularly during the winter months. December 2026 futures hold above $4/MMBtu, well above the summer prompt, which is the clearest possible expression of the market's expectation that winter will reassert the bull case.
The contango structure — deferred months priced above the prompt — is the market's vote that the current summer softness is temporary. The crowd is pricing the summer prompt near $3.30 because record production and comfortable storage cap it now, but it's pricing December above $4 because winter heating demand plus peak LNG feedgas demand will tighten balances later in the year. That curve shape matters for the forecast because it tells you the structural bull case lives in the deferred contracts, not the prompt. The January 2026 record of $7.72/MMBtu — set during a polar vortex that drove record storage withdrawals — is the memory that keeps the winter contracts bid, because the market knows how violently gas can spike when cold weather collides with tight storage and 17-plus Bcf/d of LNG demand that leaves little margin for error. The forward curve saying winter is the reason the prompt's summer weakness shouldn't be read as a broader collapse — the market is simply pricing the seasonal pattern, with the cheap summer prompt and the expensive winter contracts reflecting the demand calendar. The curve is constructive even when the prompt is capped.
The EIA's Lowered Outlook
The official forecast frames the bearish supply story, and the EIA has been cutting its numbers. The agency now expects the Henry Hub spot price to average about $3.34/MMBtu in the second half of 2026 and $3.46-$3.55/MMBtu in 2027, with the May outlook reducing projected prices by 4.4% for 2026 and 11.5% for 2027 versus the January forecast. Those downward revisions are entirely about supply — the EIA raised its production forecast, citing higher associated gas from the Permian, which keeps inventories above the five-year average and limits upward pressure on prices.
The lowered outlook is the institutional confirmation of the bearish supply thesis. When the EIA cuts its price forecast because production is running higher than expected, it's validating the record-production-as-ceiling story that's capping the market. The agency's $3.34 average for the second half of 2026 sits right around where the prompt is trading now, suggesting the current level reflects the fundamental balance rather than a temporary dislocation. The annual average projections — around $3.50-$3.60 for 2026 from various forecasters — bracket the current price, reinforcing that gas is fairly valued near $3.30 given the supply-and-demand picture. The EIA's revisions also explain why the price curve has been translated vertically downward: more production means more storage means lower prices across the forecast. The lowered outlook doesn't mean gas is going to collapse — the LNG floor and winter demand prevent that — but it does mean the structural bias is for prices to stay capped, with the summer prompt anchored in the low-$3 range and the upside reserved for winter and weather surprises. The official forecast says comfortable, well-supplied, and range-bound.
Technical Map: The $3 Floor and the $3.50 Ceiling
The chart frames the near-term battle within a defined range, and the technical signals lean bullish despite the bearish fundamentals. The prompt trades near $3.30, having reached a four-month high on June 4 before pulling back to the $3.19 area and bouncing on this week's heat. The daily technical signal reads Strong Buy on the momentum indicators, reflecting the heat-driven recovery and the firm tone into expiry. The $3 level stands as the critical psychological and technical floor — the prompt climbed back above it in mid-May for the first time since late March, and holding above it keeps the bullish structure intact.
On the upside, the $3.50 zone is the resistance that aligns with the EIA's second-half average and the upper end of the recent range. A break and sustained close above $3.50 would open the path toward the $4 level where the winter contracts trade, while a break and sustained close below $3 would open the path toward $2.80-$3.00, the lower end of the base-case range. The technical map mirrors the fundamental one: $3 is the floor where cooling demand and LNG support kick in, and $3.50 is the ceiling where record production and comfortable storage cap the advance. The prompt at $3.30 sits in the middle of that band, with the heat forecasts pushing it toward the upper end and the storage overhang pulling it back toward the lower. The Strong Buy signal reflects the near-term momentum, but the range-bound structure means the technical bias is for continued chop between $3 and $3.50 until a weather or supply catalyst breaks the market out. The levels are tight, and the weather decides which way it leans.
The Scenario Map
The probability-weighted outlook frames the range of outcomes cleanly across the seasons. The base case, carrying roughly 55% probability, sees Henry Hub between $2.50 and $4.50/MMBtu — with Q3 prices hovering near $2.80-$3.00 before firming into winter, and Q4 ramping toward $4.00-$4.50 as LNG feedgas demand peaks and heating demand returns, leaving the full-year average near $3.50. That base case lines up almost exactly with where the prompt is trading and where the forward curve is priced, making it the most likely path.
The tails are where the weather matters. The bull case, at roughly 25% probability, sees $5.00-$8.00/MMBtu if an early or severe winter draws storage below the five-year average by November — the same dynamic that pushed January 2026 to its $7.72 record — with Morgan Stanley's $5 structural target reached and colder extremes capable of revisiting the record zone. The bear case, at roughly 20%, sees $2.00-$2.80/MMBtu if a mild winter leaves storage at or above the five-year average into spring 2027, with production at 118-plus Bcf/d and LNG maintenance keeping supply comfortable, though most analysts view $2 as an unsustainable floor that would trigger producer curtailments. Goldman holds a constructive $4.15 target for 2026-2027. The scenario map tells you the summer prompt near $3.30 sits in the lower-middle of the probable range, with the upside reserved for a cold winter and the downside for a warm one. The base case dominates, and it points to a seasonal ramp from the current summer level toward $4-plus by Q4 — which is exactly what the forward curve is already pricing.
The Contract Rollover
A technical event matters for the tape today: the July contract has its final settlement this afternoon, after which August becomes the prompt month. July rallied in its penultimate session and is ticking higher into expiry near $3.30, but the rollover means the market's attention shifts to the August contract and beyond. Contract expiries can bring volatility as positions are closed and rolled forward, and the final settlement print sets the reference for the month.
The rollover is worth flagging because it can create noise that obscures the underlying trend. As the July contract expires, the price action can be driven by position squaring rather than fundamentals, and the handoff to August resets the prompt to a contract that captures more of the peak summer cooling season. August, as the new prompt, will be even more sensitive to the heat forecasts than July, since it covers the heart of the air-conditioning season when power burn peaks. So the rollover actually amplifies the weather-driven dynamic — the new prompt is the contract most exposed to the cooling demand that's been holding the market up. The July settlement near $3.30 on a firm note carries the bullish momentum into the August prompt, and the heat forecasts that supported July will support August even more directly. The contract rollover is a mechanical event, but it shifts the market's focus to the peak-demand contract at exactly the moment the heat is building, which keeps the weather story front and center. Watch the August prompt's reaction to the weekend forecast updates for the cleanest read on near-term direction.
Forecast Into the Weekend and Beyond
The map into next week is defined by the heat-versus-storage tug-of-war. Support sits at $3.00 — the psychological and technical floor where cooling demand and LNG support engage — with $2.80 below it at the base-case low. Resistance runs at $3.50, the EIA's second-half average and the range ceiling, then $4.00 where the winter contracts trade. The prompt near $3.30 sits in the middle, with the heat forecasts pushing it toward the upper end and the record production and comfortable storage pulling it back.
The forecast follows the thesis: this is a weather-driven market where near-term heat is overpowering a structurally bearish supply-and-storage picture, and the prompt stays anchored near $3.30 until the weather breaks the tie. The base case into the weekend is continued firmness, with the widespread heat forecast for next week and the surging power burn supporting the bid, but the record Permian production, the comfortable storage tracking 7% above the five-year average, and the easing Hormuz premium capping any rally toward $3.50. A sustained break above $3.50 would require the heat to deliver and the storage injections to tighten; a break below $3.00 would require the forecasts to flip cooler and the production flood to reassert. The structural story sits in the forward curve, where December above $4 prices the winter re-tightening that the cheap summer prompt doesn't reflect. For the near term, watch the weekend weather updates and the new August prompt's reaction — the hotter the forecast, the firmer the floor. Natural gas is fairly valued near $3.30 given the supply-and-demand balance, range-bound between $3 and $3.50, with the weather the swing factor and the seasonal ramp toward $4-plus reserved for Q4. Heat is trumping storage today, but the supply is always there to cap the next rally.