Oil Price Forecast: WTI Crude at $102, Brent at $108 as Khamenei's Uranium Directive Rebuilds the War Premium
WTI (CL=F) up nearly 4% to $101.96 and Brent (BZ=F) up 3.4% to $108.54 | That's TradingNEWS
Key Points
- WTI at $101.96 (+4%), Brent at $108.54 (+3.4%); both rebuilding war premium after Khamenei uranium directive.
- 1B barrels of cumulative supply loss by end of May; IEA warns "red zone" summer if Hormuz stays closed
- UBS lifts Brent to $105 for September, warns $150 in disruption scenario; backwardation confirms tightness.
The market just got a textbook reminder that the only macro variable that actually matters right now sits in Tehran, not in Washington. WTI crude (CL=F) is ripping nearly 4% to $101.96-$102.06 per barrel. Brent (BZ=F) is up roughly 3.4%-3.5% to $108.34-$108.76. Murban crude is +3.59% to $106.9. WTI Midland is +3.29% to $102.9. OPEC Basket sits at $115.4. Indian Basket at $108.9. The trigger wasn't a supply disruption, an OPEC headline, or a U.S. inventory miss – it was a single line from Iran's Supreme Leader Mojtaba Khamenei via Reuters: enriched uranium does not leave the country. That sentence rebuilt the war premium that crude had shed on Wednesday's "final stages" rally, and it did so in less than a single trading session. This is no longer a market trading fundamentals. This is a market trading every word out of Tehran while the Strait of Hormuz remains effectively closed for the tenth consecutive week.
The Price Tape: Where Crude Actually Sits Right Now
The intraday print across the benchmark complex is uniformly bid. WTI futures at $100.30-$101.96-$102.06, +$2.05-$2.06 (+2.05%-2.10%), recovering toward the $102 handle after touching as high as $102.30 intraday. Brent crude at $106.74-$108.54, +1.50%-3.4%, pulling back from the daily high near $108.50 but holding the 3% gain. Murban crude at $106.9 (+3.59%), the strongest of the regional benchmarks. Heating oil at $3.939 per gallon (-0.20%). Gasoline at $3.479 per gallon (-0.24%). Natural gas at $3.047/MMBtu (+1.43%). The U.S. retail pump average has crossed $4 per gallon in all 50 states – a real-economy data point that's hitting consumer wallets directly.
The historical comparison is brutal. Brent at $108.76 sits roughly $44 above its $64.84 print one year ago, a 67.73% increase. One month ago, oil was at $94.75 – the current level is +14.78% in 30 days. Pre-war crude (late February 2026) sat at approximately $70 per barrel. That means the current Brent print carries a war premium of roughly $35-$40 per barrel, or about 50%+ above where it would otherwise be trading on supply-demand fundamentals alone.
The Khamenei Uranium Directive Is the Whole Story
This is what changed the tape. Two senior Iranian sources told Reuters that Ayatollah Mojtaba Khamenei issued a directive ordering Iran's enriched uranium to remain in the Islamic Republic. This directly complicates one of the U.S. core conditions for any peace deal. President Trump has publicly stated that dismantling Iran's nuclear program is a central objective of the U.S. war effort, and he has reportedly assured Israeli leaders that any deal must include the removal of Iran's highly enriched uranium stockpile. Khamenei's order moves Iran's negotiating position from "negotiable" to "non-negotiable" on the single issue Washington won't budge on.
Trump's response Wednesday was textbook brinkmanship: "We're all ready to go. We have to get the right answers. It would have to be a complete 100% good answers." He threatened to resume military action if Iran fails to provide adequate responses, while simultaneously stating he was willing to wait "a couple more days." That's a market-moving combination of escalation rhetoric and de-escalation patience that the oil tape can't price cleanly – which is exactly why crude is whipping in 5%-6% ranges within 24 hours.
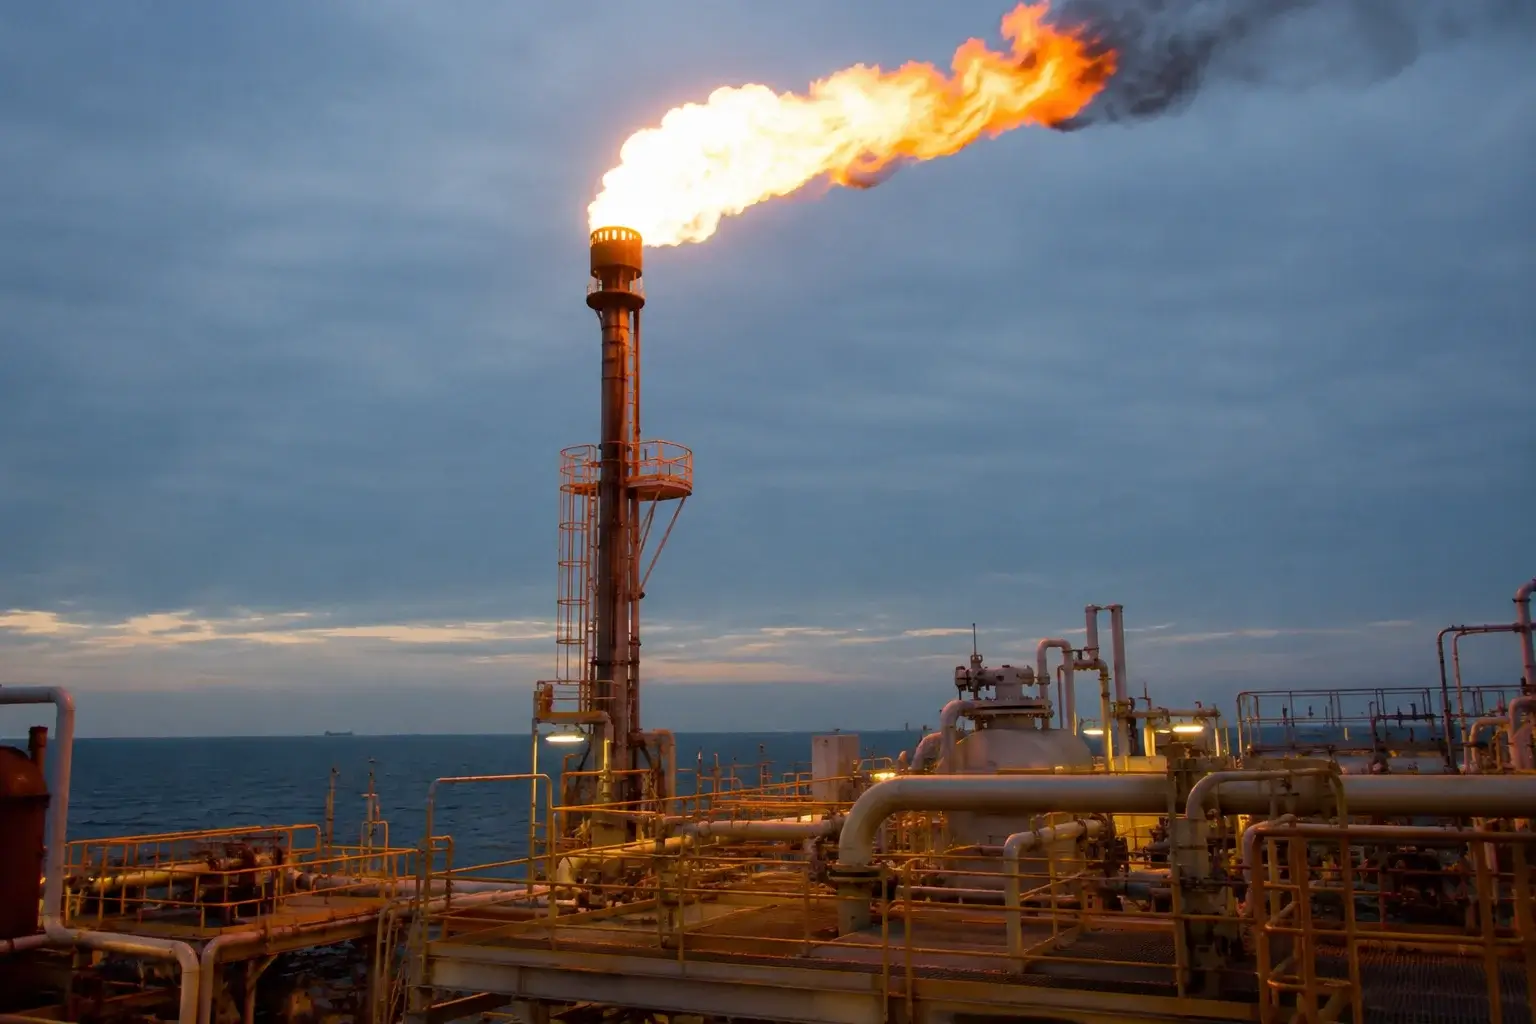
The Strait of Hormuz Is the Single Most Important Chokepoint on Earth Right Now
The structural backdrop driving everything: the Strait of Hormuz remains severely disrupted by Iran's blockade for the tenth consecutive week. This is the corridor through which approximately a fifth of the world's traded oil normally passes. Some shipping data shows partial movement – three supertankers carrying 6 million barrels exited the Strait this week, and two additional supertankers exited with crude bound for China in the past 48 hours. A first LNG tanker broke the Hormuz blockade, and the UK and France are leading a 30-nation military push to reopen the Strait. But these are exceptions, not the new normal. The chokepoint remains 90%+ disrupted.
The International Energy Agency warned Thursday that the oil market will reach a "red zone" this summer if Hormuz does not reopen. IEA chief Fatih Birol flagged that global oil stockpiles will deplete rapidly as demand picks up during summer travel season. The math is uncompromising: summer demand peaks while supply remains constrained. That's the recipe for a price spike, not a price retreat.
Inventory Math: 1 Billion Barrels Lost by End of May
The supply destruction is now measurable. UBS estimates overall oil production losses likely reached 650 million barrels over March and April, and are on track to exceed 1 billion barrels by the end of May. That's the largest supply shock in oil market history measured by absolute volume lost. Goldman Sachs has sounded fresh alarms on global oil stockpiles, with the May inventory drawdown running at 8.7 million barrels – twice the pace seen since the conflict outbreak.
On the U.S. side, U.S. crude inventories fell quickly this week, though they remain net positive year-to-date. Iran's floating oil stockpile jumped 65% as the U.S. naval blockade bites, but those barrels can't get to market through the disruption corridor anyway. Saudi Arabia crude exports sank to record lows per JODI data, with the kingdom being forced to boost fuel oil imports as gas output dips – an extraordinary inversion for the world's largest crude exporter. Saudi oil export income jumped to a 3.5-year high in March purely on the price effect, masking the volume compression underneath.
UBS Lifted Forecasts by $10/Barrel – And Warned Brent Could Hit $150
The bank revisions are stacking up bullish. UBS raised its September oil forecasts by $10 per barrel to Brent $105 and WTI $97. The bank lifted December and March forecasts by $5 per barrel. UBS flagged that near-term risks remain skewed to the upside and explicitly warned that if the supply disruption continues, Brent could trade above $150 per barrel as scarcity fears trigger hoarding and amplify price moves.
The Bloomberg Intelligence survey of 126 asset managers and energy strategists this week pegged oil to average between $81 and $100 per barrel over the next 12 months, with over 40% citing demand destruction as the single biggest driver of market balancing versus only 13% pointing to OPEC+ spare capacity and 12% saying "nothing will materially offset the disruption." That's the consensus view: the only way crude doesn't spike further is if the global economy breaks under the weight of $100+ oil.
The risk premium itself is now baked in for years. Most survey participants expect a $5-$15 per barrel risk premium to persist medium-term, with some forecasting more than $20. Traders themselves now expect oil to remain above $81 for the next 12 months – a structural reset of expectations versus where the market sat in early Q1.
OPEC+ Spare Capacity Is the Pressure Release Nobody's Using
OPEC+'s response has been measured but not aggressive enough to override the supply shock. Saudi Arabia's exports continue to fall to record lows. Russia's flows remain compressed. Nigeria is targeting a 100,000-bpd output increase as global supply disrupts, but that's marginal relative to the 1 billion-barrel cumulative loss. The bloc still holds meaningful spare capacity, but the political and price calculus argues against rapid release – why would Riyadh flood the market when prices are $30 above where it needs to balance the budget? The supply discipline is structural, and it favors continued tightness through summer.
China is boosting oil stockpiles despite an import plunge, indicating Beijing is reading the same risk and building precautionary inventory. Japan's crude imports from the Middle East slumped to the lowest on record, with logistics rerouting to alternative suppliers. India is eyeing direct Gulf oil loading despite the Hormuz blockade as it scrambles for security of supply. These are not the actions of buyers expecting oil to drop – they're the actions of buyers locking in barrels at any price before the next leg higher.
The Technical Structure: WTI at $102 Is Above the 200-Day, Brent Holding $108
The chart structure is constructive for the longs. WTI (CL=F) at $101.96-$102.06 sits well above the 200-day moving average and inside an established uptrend that has not been meaningfully challenged since late February. The $100 psychological level is acting as defended support. Resistance at $105-$108 is the next test, with the 2026 high near $112 as the structural ceiling. WTI Midland at $102.9 (+3.29%) is leading the U.S. benchmark complex, confirming spot tightness is real.
Brent (BZ=F) at $108.34-$108.76 is rebuilding the $110 handle after Wednesday's selloff to $105. The immediate resistance sits at $110-$112 (recent highs), with the 2026 peak at $115-$120 as the longer-term target. Support at $105 is the floor that held on Wednesday's de-escalation rally. The OPEC Basket at $115.4 trades structurally above Brent, reflecting the physical premium for sour crude given refinery configuration shifts. The widening OPEC Basket vs. Brent spread is the cleanest signal that physical market tightness is meaningfully ahead of paper market pricing.
The volatility profile favors continuation. The structure on both Brent and WTI is higher highs and higher lows since the February breakout. Every dip into the lower channel boundary has been bought. Every spike to new highs has consolidated rather than capitulated. That's the configuration of a market in a confirmed uptrend with structural sponsorship, not a headline-driven squeeze that fades.
The Brent-WTI Spread: Backwardation Says Real Tightness
The futures curve is in steep backwardation across both benchmarks – front-month contracts trade meaningfully above deferred months. That's the cleanest signal that physical market tightness is dominating paper positioning. When backwardation is this pronounced, it tells refiners and traders that holding inventory is being penalized – which means inventories will continue to draw and the market is structurally short. The Brent-WTI spread sits around $6-$7, with Brent at the premium reflecting the international supply shock more acutely than the U.S. domestic market, which has some insulation from Hormuz dynamics through shale production.
Read More
-
The Dividend ETF That Doesn't Act Like One — FDVV Rides Nvidia and Apple to a 20.5% Year and Nears Record Highs
06.07.2026 · TradingNEWS ArchiveStocks
-
XRP's ETFs Are Locking Away Supply Relentlessly — XRPI and XRPR Hold Their Floors as $1.44B in Inflows Await the Catalyst the Price Needs
06.07.2026 · TradingNEWS ArchiveCrypto
-
Heat vs. Supply Keeps Gas Pinned at $3.21 — A 100-Degree Heat Wave and Record LNG Flows Battle a 110 Bcf/d Production Flood
06.07.2026 · TradingNEWS ArchiveCommodities
-
The Yen Grinds to 40-Year Lows as the Carry Trade Overpowers Japan's Warnings — USD/JPY at ¥162 With Goldman Betting on More Upside
06.07.2026 · TradingNEWS ArchiveForex
Refinery Margins and Cracks: Profitability Is Driving Demand
The downstream complex is signaling robust pull. Crack spreads remain elevated globally, with refiners enjoying near-record margins on the disconnect between crude input costs and refined product output prices. Heating oil at $3.939 and gasoline at $3.479 at the wholesale level translate to retail pump prices above $4 nationwide. The diesel crack in particular is wide as truckers, shipping, and industrial demand all compete for distillate. That margin structure incentivizes refiners to run at maximum utilization, which mechanically supports crude demand even as headline economic activity softens.
The Macro Overlay: Fed Hawkish Pivot Is the Counterweight
The bearish risk to crude isn't supply – it's the macro tape working against demand. The U.S. 10-year Treasury yield at 4.61%-4.62%, Fed hike odds flipped to 62% by December, DXY firmer at 99.4, and mortgage rates at 6.75% are all draining real-economy liquidity. The textbook reaction is demand destruction – consumers cut driving, industrial production softens, transport demand compresses. The Bloomberg Intelligence survey directly identified demand destruction as the dominant market-balancing mechanism. But the timeline matters: demand destruction is a slow-moving variable, while supply shock is an acute one. The price doesn't break until destruction is verifiable in the data, and the next read is months away.
U.S. jobless claims at 209,000 continue to undershoot expectations, with the U.S. job market in better shape than economists predicted despite the macro headwinds. That's labor market resilience that keeps consumer fuel demand intact. Iran-related EV sales are surging in Europe per IEA data, but that's a multi-year demand offset, not a near-term price relief.
The Bullish Drivers: The Tape Is Set Up to Run
Stacking the bull case: Khamenei's uranium directive complicating any peace deal. Strait of Hormuz blockade entering its tenth week with no resolution. 1 billion barrels of cumulative production loss by end of May. 8.7 million barrel May inventory drawdown – twice the prior pace. Goldman warning on stockpile depletion. UBS forecasting $150 Brent in the disruption scenario. IEA red-zone warning for summer. Saudi exports at record lows. Japan's Middle East imports at record lows. China stockpiling defensively. Iran's floating stockpile +65% with no path to market. Backwardation across the curve confirming physical tightness. Refinery cracks elevated, signaling robust demand. Summer driving season hitting peak consumption window. Three Australian LNG strikes adding gas-side supply risk. The UAE pipeline bypass only 50% complete – limited near-term relief. Hedge fund positioning still net long but not stretched.
The Bearish Risks: What Could Crack the Rally
Conversely, the bear case isn't dead, it's just patient: a sudden Iran-U.S. deal that reopens Hormuz overnight would crater prices by $15-$25 in a single session. A coordinated SPR release from the U.S. and IEA member states could absorb 20-50 million barrels of immediate supply relief. OPEC+ choosing to unwind production cuts faster than current schedules would add 1-2 million barrels per day to the market. A severe global recession triggered by stagflation conditions in the U.S. and Europe could destroy 2-3 million barrels per day of demand. China demand collapse beyond what's already priced. Russian sanctions easing following geopolitical realignment. Strong dollar continuation that compresses non-USD oil demand.
The most dangerous bear scenario for current longs: a credible Trump-Iran framework agreement announced over a weekend that traders can't position around. That's the gap risk that keeps disciplined long positions sized below maximum.
Positioning and Sentiment: Speculators Are Long But Not Extreme
Hedge fund and CTA positioning is net long but not at the extremes that historically precede liquidation cascades. Open interest is healthy, funding through the futures complex is constructive, and the option market is pricing meaningful tail risk to the upside via call skew. That's a positioning configuration that allows further upside without forced unwind – the dangerous reverse scenario (extreme long positioning + forced liquidation) is not yet in place. CTA models remain trend-following long given the persistent uptrend, which provides systematic flow that defends pullbacks.
The Demand Side: Summer Driving Plus China Equals Pressure
The seasonal setup is the bull's underrated tailwind. Northern Hemisphere summer driving season kicks off Memorial Day weekend (May 25 this year), with U.S. travel demand historically peaking through July-August. Chinese refinery runs are scaling for industrial production cycles. India fuel prices have been hiked for the second time in a week, with refiners absorbing the spread. Indian airlines are asking refiners to postpone local jet fuel price hikes – a direct signal that downstream pricing pressure is acute. The IEA framework for the summer "red zone" assumes exactly this dynamic: demand strengthens precisely when supply remains constrained.
Currency and Cross-Asset Confirmation
The dollar at 99.4 is normally a headwind for crude pricing in USD terms, but the supply shock is overwhelming the currency effect. Gold at $4,510 is bleeding (-0.6%) as real yields capture the safe-haven flow that historically would have gone to bullion – meaning the cross-asset signal favors crude over gold as the geopolitical hedge of choice. The S&P 500 down 0.36% to $7,406 and Nasdaq down 0.47% confirm that risk assets are pricing the oil shock as a stagflation drag, not a transitory event. Oil is acting as the consensus geopolitical asset – exactly the configuration that supports continued upside as long as Hormuz stays closed.
The Bull Case Invalidator: What Kills the $108 Brent Thesis
The bullish read on crude breaks if any of the following land: a verifiable Iran-U.S. framework agreement with explicit uranium-removal terms; a clean reopening of the Strait of Hormuz with major tanker traffic resuming; a coordinated SPR release of 50+ million barrels; OPEC+ unilateral production increase of 1+ million barrels per day; a sharp deceleration in U.S. and global PMI data confirming demand destruction; a daily close below $95 WTI and $100 Brent that breaks the technical uptrend; or a credible breakdown of the Khamenei directive through internal Iranian political pressure. Any two of these in combination opens $90 WTI and $95 Brent as the next downside targets.
The Bear Case Invalidator: What Confirms the Continuation
The bearish read fully invalidates on: another Iran flashpoint (military action, Hormuz incident, IRGC seizure of a tanker); a clean daily close above $105 WTI and $110 Brent that opens the next leg; U.S. inventory drawdowns exceeding 5 million barrels per week confirming acute domestic tightness; OPEC+ extending production cuts at the June meeting; a hot PCE print Friday that locks in the inflation overlay and forces continued Fed hawkishness; or any escalation of LNG strikes in Australia adding gas-side supply contagion. The base-case continuation path targets $108-$115 WTI and $115-$125 Brent into summer.
The Verdict: BUY Pullbacks Into $98-$100 WTI and $103-$105 Brent, HOLD Existing Longs, Bullish Continuation
The call: WTI (CL=F) is a BUY on pullbacks into $98-$100, with stops below $95. Initial target $105, extended target $108, structural target $112. Brent (BZ=F) is a BUY on pullbacks into $103-$105, with stops below $100. Initial target $110, extended target $115, structural target $120. Existing longs are a HOLD with disciplined stops below the recent breakout zones – do not chase strength into the upper resistance bands, but do not exit positions until the technical structure breaks or a credible peace catalyst materializes.
This is a BULLISH read with high conviction on the structural fundamentals and moderate conviction on the near-term path given Iran headline risk. The thesis is supported by: the Khamenei uranium directive removing the diplomatic offramp, the 1 billion-barrel cumulative production loss, the 8.7M barrel May drawdown, Hormuz blockade entering week ten with no resolution, IEA red-zone summer warning, UBS $10 forecast hike with $150 disruption scenario, Saudi exports at record lows, Japan Middle East imports at record lows, China defensive stockpiling, backwardation confirming physical tightness, elevated cracks confirming downstream demand, summer driving season approaching, hedge fund positioning long but not stretched, and CTA models systematically trend-following long. The thesis is constrained by: gap risk on any sudden Iran framework agreement, SPR release potential, OPEC+ supply unwind risk, demand destruction from sustained $100+ oil, recession overlay from Fed hawkishness, and dollar strength compressing non-USD demand.
The catalyst path: a daily close above $105 WTI opens $108-$112; a daily close above $110 Brent opens $115-$120. A break below $95 WTI opens $90; a break below $100 Brent opens $95. The market sits in an asymmetric setup where the upside is structural (supply shock that takes quarters to resolve) and the downside is binary (one peace headline that triggers a 10% gap). Hold long exposure with stops, buy pullbacks into the recent breakout zones, fade extreme spikes above $112 WTI and $118 Brent on the first test, and respect Friday's PCE print as the secondary macro variable.
The Iran tape is the only catalyst that matters until it changes. The Strait of Hormuz is the only chokepoint that matters until it reopens. Crude is acting as a pure geopolitical asset with fundamentals reinforcing the geopolitical bid – and as long as both vectors point the same direction, the path of least resistance for oil is higher. Bullish with active position management and respect for headline gap risk is the only honest read of where this market sits today.