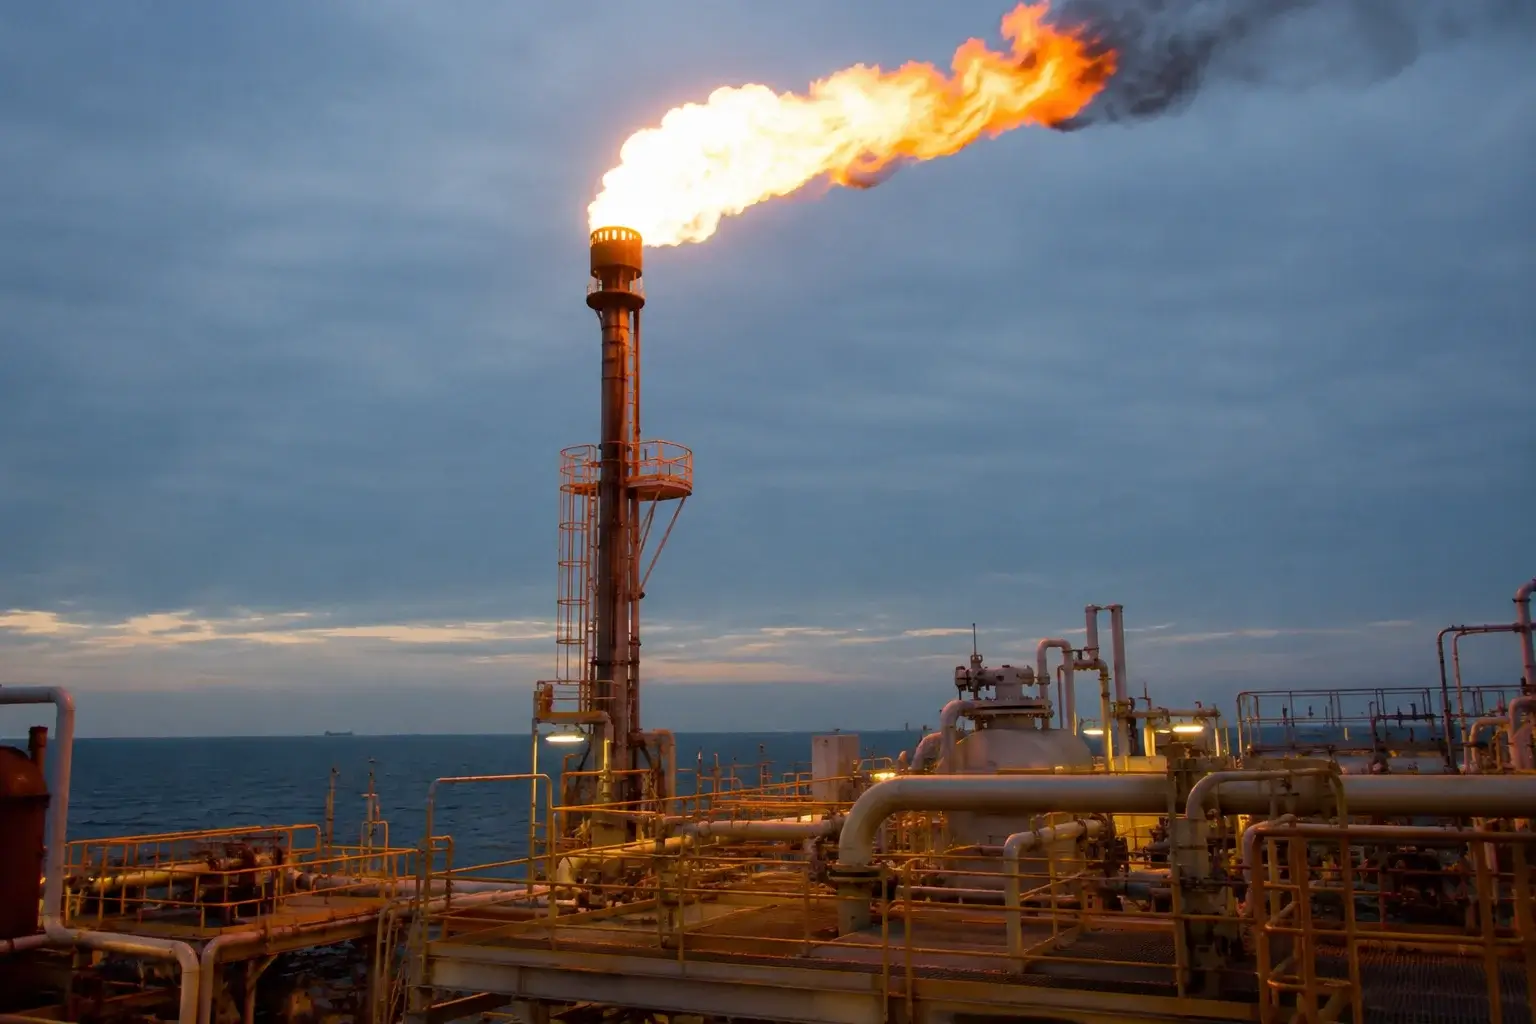
Oil Price Forecast – WTI Defends $98 With $108 Target as Hormuz Stays 90% Closed and EIA Confirms 7.9M Barrel Draw
WTI sits at $98.10 and Brent at $104.90 after peace-headline selling stripped 5.8% from the tape | That's TradingNEWS
Key Points
- WTI trades at $98.10 and Brent at $104.90 after a 5.8% drop on Trump peace headlines, but $95 holds as floor.
- EIA reported a 7.9M barrel crude draw to 445M, with Cushing down 1.6M as stocks sit 2% below the five-year avg.
- Hormuz transits run 90% below normal as Goldman calls for $10 per month of premium accretion toward $115.
The crude complex is taking a sharp hit on Wednesday as Trump's renewed signaling that the Iran war could end "very quickly" yanks risk premium out of the front of the curve. WTI (CL=F) is changing hands at $98.10 per barrel, down $6.05 or -5.81% on the session, while Brent (BZ=F) is printing $104.90, down $6.40 or -5.75%. Earlier in the European morning, the active boards showed WTI near $100.15 and Brent near $107.19, with intraday lows extending the rout into the close. WTI Midland is at $99.58, down 5.82%, with gasoline futures off 5.36% at $3.498 and heating oil down 5.54% at $3.932 — the entire petroleum complex is being repriced in lockstep, which is the textbook signature of a headline-driven de-risking rather than a fundamentally driven directional flush.
The Brent-WTI spread is sitting around $6.80 to $7.04, holding firm even through the selloff. That matters because the global benchmark is still carrying a visible Hormuz risk premium that the US benchmark cannot fully replicate. The OPEC Basket actually printed up 1.08% at $118.10, and the Indian Basket added 1.43% to $112.30 — meaning physical-market benchmarks are diverging from the paper futures tape, which is a classic late-stage signal that the futures correction is running ahead of the physical reality on the ground.
The $100 Line in the Sand for WTI
The single most important technical reference for WTI right now is the $100 psychological pivot. The active board has just lost that level on the session, but it remains the gravitational center of the entire price discussion. The prior close near $104.38 is the immediate reference for whether the selloff deepens into a structural reset or stabilizes as a headline overshoot. Holding above $95 to $97 keeps the broader uptrend from March intact; losing $95 opens the door to a deeper retracement toward $92 and the 2023-highs cluster at $88 to $91, which is the level that defined the pre-war consolidation.
The chart structure on the weekly time frame still favors the bulls until decisively broken. Brent (BZ=F) is challenging the resistance trendline connecting the lower highs since March 2026, and a sustained reclaim of $108 with follow-through above $115 would expose $126, $135, and $157 as the next Fibonacci-extension targets aligned with the 0.618, 0.786, and 100% projections of the 2020-to-2022-to-2026 cycle. That is the bull-case roadmap if Hormuz fails to reopen on a durable basis. The bear-case roadmap is equally precise: a sustained hold below $88 to $91 on Brent opens $86, $82, and $79, with the pre-conflict Middle East high near $76 as the structural magnet.
The Inventory Tape: A Bull Signal the Bears Are Ignoring
The fundamental data point that should be supporting price right now is the inventory draw, and the market is glossing over it because the diplomacy narrative is louder. The EIA Weekly Petroleum Status Report for the week ending May 15 showed US commercial crude inventories down 7.9 million barrels to 445.0 million barrels — a substantial draw that brings stocks to 2% below the five-year average for this time of year. API's parallel data showed an even larger draw of 9.1 million barrels the day prior, which means the directional read across both surveys is unambiguously tight.
The granular picture is just as bullish. Cushing inventories fell by roughly 1.6 million barrels in the same week, which matters because Cushing is the delivery hub for the WTI futures contract and tightness there directly supports the front of the curve. Gasoline stocks dropped 1.5 million barrels, following a 4.1 million barrel decline the prior week, with average daily gasoline production at 9.3 million barrels. Distillate inventories now sit 9% below the five-year average with production at 5.0 million barrels per day. Total products supplied — the proxy for US oil demand — rose to 20.2 million barrels per day on the four-week average, up 3.1% year-on-year, with gasoline demand at 8.9 million bpd and distillate demand up 1.4% YoY.
These are not the numbers of a market that should be down 6% on a single session. They are the numbers of a market that is structurally tight on physical balances and being whipsawed by headline trading. That divergence is the trade.
The Strait of Hormuz Reality Check
The most important sentence in this entire setup is that Hormuz remains effectively closed despite the political theater suggesting otherwise. The waterway normally moves 17.8 to 20 million barrels per day of crude and petroleum products — roughly 20% of global oil consumption — and current transit levels are running more than 90% below normal. In a typical day, around 138 vessels make the passage; the latest BBC Verify analysis showed only a handful clearing the strait since the conflict began.
The headlines that get traders excited do not match the operational reality. The US "Operation Freedom" launched on May 4 to evacuate stranded vessels was shelved within 24 hours at Pakistan's request, citing peace progress that has yet to materialize. A coalition of over 40 nations has committed to the Multinational Military Mission led by France and the UK to reopen Hormuz, but the deployment is contingent on a ceasefire that does not yet exist. Iran's latest peace proposal — including insistence on uranium enrichment rights, removal of the US naval blockade, lifting of all sanctions, release of frozen funds, and war damage compensation — was rejected by Trump on the spot as "totally unacceptable" and "a piece of garbage."
The yuan toll system Iran installed at Hormuz creates a two-tier transit regime where Chinese and Russian vessels move while Western tankers wait. Three supertankers carrying 6 million barrels just exited the strait, but those flows are being throttled at Iran's discretion rather than reopening freely. Iran's floating oil stockpile has jumped 65% as the US naval blockade prevents normal export channels, and incidents continue to multiply across the wider Gulf — a vessel anchored near Fujairah was seized and diverted toward Iran, an Indian-flagged cargo ship sank off Oman after an attack-induced fire, and the tanker Ocean Koi was seized in the Gulf of Oman.
This is not an open shipping lane. The market trading like one is the mispricing.
The Risk Premium Math
Goldman Sachs has quantified the Iran war premium at $14 to $18 per barrel since hostilities began in early March 2026. Before the conflict, Brent traded near $71 to $76 per barrel. The bank's Head of Oil Research, Daan Struyven, has been explicit: every month Hormuz remains closed adds $10 to the price of oil by year-end. That is a directional forecast, not a hedge — it tells you the structural skew runs higher, not lower, until the strait genuinely reopens on a commercial basis rather than a political one.
JPMorgan's view has shifted twice through the cycle: a $60 base case if Hormuz normalizes, with high-price scenarios returning if disruption worsens, and a public call that global oil prices likely remain above $100 for the rest of the year even if current restrictions ease. That second call is the one that matters because it acknowledges the structural damage that has already been done to refinery capacity, insurance markets, and shipping confidence.
The path of damage runs through three specific corridors. Iraq declared force majeure on all foreign-operated oilfields on March 20, removing meaningful supply from an OPEC producer pumping roughly 4.5 million bpd. Kuwaiti drone strikes temporarily disrupted 400,000 bpd of refining capacity. European jet fuel imports from the Middle East collapsed from 330,000 bpd in March to just 60,000 bpd in April, with the IEA warning Europe needs to replace 80% to 90% of those volumes to avoid summer shortages — a gap it has not yet closed.
The OPEC+ Producer Calculus
The cartel's behavior tells you exactly how the supply side reads the demand outlook. OPEC+ approved a 206,000 bpd production increase for May at its April 5 meeting, a move that was widely interpreted as symbolic given that Hormuz has removed multiples of that volume from the market. The group condemned attacks on energy infrastructure but stopped short of emergency coordination, which is the language of producers who do not believe the demand impulse justifies aggressive supply additions while uncertainty dominates.
Saudi Arabia's role as swing producer gives Riyadh the ability to add roughly 2 million bpd within 90 days if it chooses, but the Kingdom's official selling prices have actually been cut for Asian customers loading in May — telegraphing that physical buyers are not chasing barrels and that producers prefer to preserve price discipline rather than chase volume. JODI just reported Saudi crude exports sinking to record lows, which is the producer-discipline signature that argues against any aggressive supply unwind.
Russia continues to add LNG carriers to its Arctic dark fleet while OPEC's structural compliance remains intact through the conflict. The cartel is not trying to break the price — it is trying to manage it through a volatility window where physical supply is genuinely constrained.
US Shale and the Domestic Buffer
The EIA's Short-Term Energy Outlook has US crude production averaging 13.6 million bpd in 2026 and rising to 13.8 million bpd in 2027, both upward revisions driven by current price incentives. US production has already reached a record 13.3 million bpd through the current cycle, providing a partial domestic buffer that insulates US consumers from the worst of the Brent-linked global pricing. The rig count has stabilized, refinery utilization has held, and the shale response is real — but it cannot, by itself, offset a sustained Hormuz closure.
The US remains a net importer of crude despite the production surge, meaning WTI still tracks Brent with a lag rather than decoupling. The Brent-WTI spread at $6.80 to $7.04 is the visible measure of how much of the global supply-risk premium the US benchmark is currently absorbing through the import channel.
Read More
-
The Dividend ETF That Doesn't Act Like One — FDVV Rides Nvidia and Apple to a 20.5% Year and Nears Record Highs
06.07.2026 · TradingNEWS ArchiveStocks
-
XRP's ETFs Are Locking Away Supply Relentlessly — XRPI and XRPR Hold Their Floors as $1.44B in Inflows Await the Catalyst the Price Needs
06.07.2026 · TradingNEWS ArchiveCrypto
-
Heat vs. Supply Keeps Gas Pinned at $3.21 — A 100-Degree Heat Wave and Record LNG Flows Battle a 110 Bcf/d Production Flood
06.07.2026 · TradingNEWS ArchiveCommodities
-
The Yen Grinds to 40-Year Lows as the Carry Trade Overpowers Japan's Warnings — USD/JPY at ¥162 With Goldman Betting on More Upside
06.07.2026 · TradingNEWS ArchiveForex
Demand Resilience: The China and India Story
The bear case requires demand destruction to materialize. The data so far refuses to cooperate. Chinese crude imports surged 15.8% year-on-year in January-February 2026 to 11.99 million bpd, eclipsing the 2025 record of 11.55 million bpd. Beijing is stockpiling aggressively against further disruption: refinery utilization hit 73.2% in February, well above the prior-year baseline, and 11 new storage facilities with combined capacity of roughly 169 million barrels are under construction. Around 600,000 bpd of American crude is scheduled to load in April as China offsets lost Middle East supply through the Larak corridor preferential access.
India is consuming 5.99 million bpd, growing 4.3% year-on-year — double China's growth rate. India has been buying discounted Russian crude at volumes exceeding 2 million bpd, partially insulating itself from Brent-linked pricing, though Trump's trade-deal linkage threatens that supply mix going forward. Indian airlines are postponing local jet fuel price hikes, and Indian refiners are reportedly preparing to ride out further disruption after the Russian waiver ends. Europe at 14 million bpd is flat, with energy-transition policy and mild weather suppressing consumption rather than recession dynamics.
Chinese refiners just slashed crude runs to the lowest level since 2022, which is the one demand-side signal the bears can point to, but it reflects margin compression rather than terminal demand collapse — refiners are choosing to reduce throughput rather than absorb high feedstock costs into negative margins.
The Macro Overlay: Stagflation Risk and the Stagnant Dollar
The crude story is now a macro story. EU Commissioner Valdis Dombrovskis publicly characterized the bloc's economic outlook as facing a "stagflationary shock", with the spring forecast set to be revised toward lower growth and higher inflation simultaneously. Oxford Economics' prolonged-war scenario projects negative growth for Eurozone countries if Hormuz remains closed. The historical analog is the 1973 Arab oil embargo and the 1979 Iranian Revolution, both of which produced the worst stagflation episodes in postwar European history.
The Fed transmission channel runs through the inflation expectations cycle. The US 30-year Treasury yield climbed to 5.19% — the highest since 2007 — and 10-year UST yields hit 4.91%, both reflecting the inflation premium being priced into long-end paper. CME futures now show roughly 50% odds of a Fed hike by December, a complete inversion of the rate-cut pricing that existed pre-conflict. The DXY at 99.36 to 99.45 is firm but not euphoric — meaning the dollar is supporting crude through the petrodollar loop rather than crushing it through valuation.
This is the regime where oil bulls have the structural macro tailwind: rising inflation pressures, central banks tightening rather than easing, and physical supply constrained by geopolitical risk. The peace-headline correction is fighting the macro tide.
Cross-Asset Read-Through: Risk Assets, Gasoline, and the Consumer
The pass-through into adjacent markets remains substantial. US national gasoline prices reached $4.14 per gallon pre-ceasefire, up from $2.81 in early January — a 46% surge functioning as a direct consumption tax. With summer driving season approaching and crude still above $98, the relief that retailers were hoping for has not arrived. Every $10 move in crude translates to roughly $0.25 per gallon at the pump, and the time lag between futures movement and retail prices runs about two weeks.
UK petrol just hit 158.5p per litre, with diesel at 185.9p, the highest since the war began. Even with a temporary fuel-duty postponement from the UK government, the consumer squeeze remains live. European jet fuel prices doubled from the conflict baseline and remain elevated by roughly 50%, prompting airline route cancellations and fare hikes globally. Spirit Airlines entered liquidation in early May under the combined weight of debt and fuel costs.
The energy-sector equity bid has held even as broader risk has wobbled. The Energy Select Sector SPDR ETF (XLE) is up 26% to 33% year-to-date, with Exxon Mobil and Chevron leading as elevated crude flows directly to producer earnings. Crude is up roughly 43% from one month ago and over 62% year-on-year on Brent, making oil the single best-performing commodity of 2026.
Positioning and the Squeeze Risk
Hedge fund and CTA positioning in crude is the variable that determines whether today's selloff stops here or extends. The combination of a fully invested long crude book accumulated through the March-April rally, and the headline-driven flush triggered by Trump's "very quickly" comment, creates the textbook conditions for a short-term capitulation. Idle containership capacity at just 0.7% on the ocean-freight side confirms the broader supply-chain tightness that should support physical premiums regardless of paper-market positioning.
The Brent-WTI spread holding at $6.80 to $7.04 through the selloff is the contrarian tell. If the diplomacy story were genuine, the global benchmark would be losing premium faster than the US benchmark. Instead, the spread is holding, meaning the physical Hormuz risk has not actually been priced out — only the speculative leverage has been shaken loose.
What Invalidates the Bullish Case
The bull thesis fails on a specific combination of events that have not yet occurred. First, a confirmed Hormuz reopening with sustained transit volumes returning to normal — not the symbolic vessel transits Iran has been permitting selectively, but the full 138-vessel-per-day flow that defines a functional commercial corridor. Second, a durable US-Iran peace agreement that addresses the underlying nuclear and sanctions questions rather than another ceasefire that holds for nine sessions before collapsing. Third, a coordinated SPR release combined with OPEC+ supply additions and a confirmed China demand slowdown — the combination of supply unwinding and demand destruction.
None of those three have materialized. The market is trading as if they have. That gap is the structural mispricing.
What Invalidates the Bearish Case
The bear case fails on three triggers that are more probable than the bull invalidations. First, fresh hostilities — a single Iranian retaliation, a strike on a Saudi facility, or US military action against Iranian energy infrastructure — would reopen the $14 to $18 risk premium overnight. Second, an OPEC+ decision to defend price by trimming the May production increase or extending voluntary cuts, which is consistent with the Saudi OSP cuts and the JODI export decline already on the tape. Third, a sustained physical-market signal — wider crack spreads, deeper backwardation in the front of the Brent curve, or rising Asian premiums — that confirms the futures market is underpricing the physical reality.
The Trading Map: Buy the Dip Toward $95 to $97 WTI
The verdict on oil (CL=F and BZ=F) is buy the dip into $95 to $97 WTI with a defined-risk structure, treating the current peace-headline flush as a tactical opportunity rather than a trend change. The base case is scaling into long exposure between $95 and $97 WTI with stops below $92, targeting a return to the $104 to $108 range as the first leg, then $115 and $126 if Hormuz remains effectively closed through Q3.
For Brent (BZ=F), the equivalent structure is accumulating into $100 to $102 with stops below $96, targeting the reclaim of $108 to $112, then $126 to $135 as the bull-case extension. The $108 trendline resistance on the weekly is the make-or-break level for the bigger picture — clear it on volume and the path toward Goldman's $14-to-$18-premium accretion math activates.
The bullish invalidation runs through $95 on WTI and $96 on Brent — break those with daily closes, and the structure resets toward $88 to $91 Brent and the pre-war consolidation range. The bearish invalidation runs through $108 on Brent — clear that on volume, and the path to $115 and beyond becomes the dominant scenario.
The asymmetry favors longs. Inventories are drawing at 7.9 million barrels per week with stocks 2% below the five-year average. Hormuz transits are running 90% below normal. Goldman is calling $10 per month of premium accretion until normalization. OPEC+ is exercising discipline rather than chasing volume. Saudi exports just hit record lows. European stagflation risk is being publicly acknowledged. The Fed is repricing toward hikes. DXY is supporting rather than crushing crude. Gasoline demand is up 3.1% year-on-year. The energy sector remains the lone equity bright spot.
The market just got a peace headline and reacted as if the war were over. The war is not over. The strait is not open. The premium is not gone. That gap is the trade, and at WTI near $98 and Brent near $105, the risk-reward favors patience, accumulation into weakness, and respect for the structural macro tailwind that has not yet exhausted itself. Position with the trend, fade the diplomacy noise, let the physical market reassert itself, and let the inventory tape do the talking that the headlines have temporarily drowned out.