Oil Price Forecast: Brent at $112.93, WTI at $108.21 Target $150 as Strait of Hormuz Stays Closed
Brent crude extends gains $2.85 above yesterday's level as Trump's Iran strike postponement fails to compress the geopolitical premium | That's TradingNEWS
Key Points
- Brent (BZ=F) at $112.93 up 71.70% YoY, WTI (CL=F) at $108.21; targets $120 near-term, $135-$150 medium-term.
- Strait of Hormuz still closed, U.S. crude stocks drained 67M barrels in 5 weeks to 1.6B; SPR hits bottom late June.
- HFI Research warns "real panic" by first week of June could push crude past $150; JP Morgan sees $100+ all 2026.
The global crude complex is sitting on the most explosive setup of the post-2022 cycle, and the tape is forcing every major bank desk to redraw its second-half curve assumptions in real time. Brent crude (BZ=F) is trading at $112.93 per barrel as of 9:20 a.m. ET on May 19, 2026, up $2.85 from yesterday's open and a brutal $47 higher year-over-year against the $65.77 print of May 2025 — a 71.70% annual gain that ranks among the steepest 12-month rallies in the modern history of the international benchmark. West Texas Intermediate (CL=F) is changing hands at $108.21, off 0.41% intraday after settling 3.1% higher Monday in its sixth positive close of the past seven sessions. Both contracts have rallied more than 54% since the Iran war ignited on February 28, and the $110-$112 Brent zone has now hardened into the new equilibrium around which the entire physical and paper market is recalibrating. Earlier Tuesday session reads put Brent around $110.61 and $111.08 before the late-morning lift, reflecting how sensitive the curve has become to every Truth Social post out of Washington. President Trump's overnight reversal — postponing the planned Iran strike at the request of Qatar, Saudi Arabia, and the UAE — was supposed to bleed the geopolitical premium out of the market. It did not. Crude opened weaker, recovered through the morning, and is now climbing because the physical reality on the water has not changed. The Strait of Hormuz is still effectively closed. Inventories are still draining. And the analyst community is starting to model scenarios that would have been considered tail-risk fantasies six weeks ago.
The HFI Research Call: "Real Panic" by the First Week of June
The single most consequential piece of independent analysis hitting desks this week comes from HFI Research, which published a Substack note Monday declaring that the oil market is approaching a "point of no return." The firm's argument is brutally simple: if the Strait of Hormuz remains closed through the first week of June, global inventories will hit tank bottom, and nations will begin panic-buying and hoarding crude in a vicious feedback loop. HFI is not modeling this as its base case — but the firm has explicitly stated that crude breaking past $150 per barrel is "possible" if the panic phase actually triggers. The math behind the call is what makes it dangerous. The U.S. held 1.6 billion barrels of oil and petroleum products as of the week ending May 8, down 67 million barrels from the start of April. HFI's late-April projection had the U.S. depleting its excess crude stocks within 8 weeks — implying total drawdown completion by the end of June. That is exactly the timing of the projected panic phase.
The sell-side desks pricing a return to normality by June are, according to HFI, operating under "psychological biases" rather than physical-market arithmetic. The barrels lost are gone. The Strategic Petroleum Reserve drawdowns have masked the true scale of the disruption since February, but that masking effect has a fixed shelf life. Once inventories cross below operational minimums — the physical tank bottoms that refineries need to maintain to keep blending operations running — the spot market has no choice but to bid aggressively for any cargo that becomes available. That is when the cycle flips from price-discovery to scarcity-pricing, and the historical analogs all point to multi-standard-deviation upside moves.
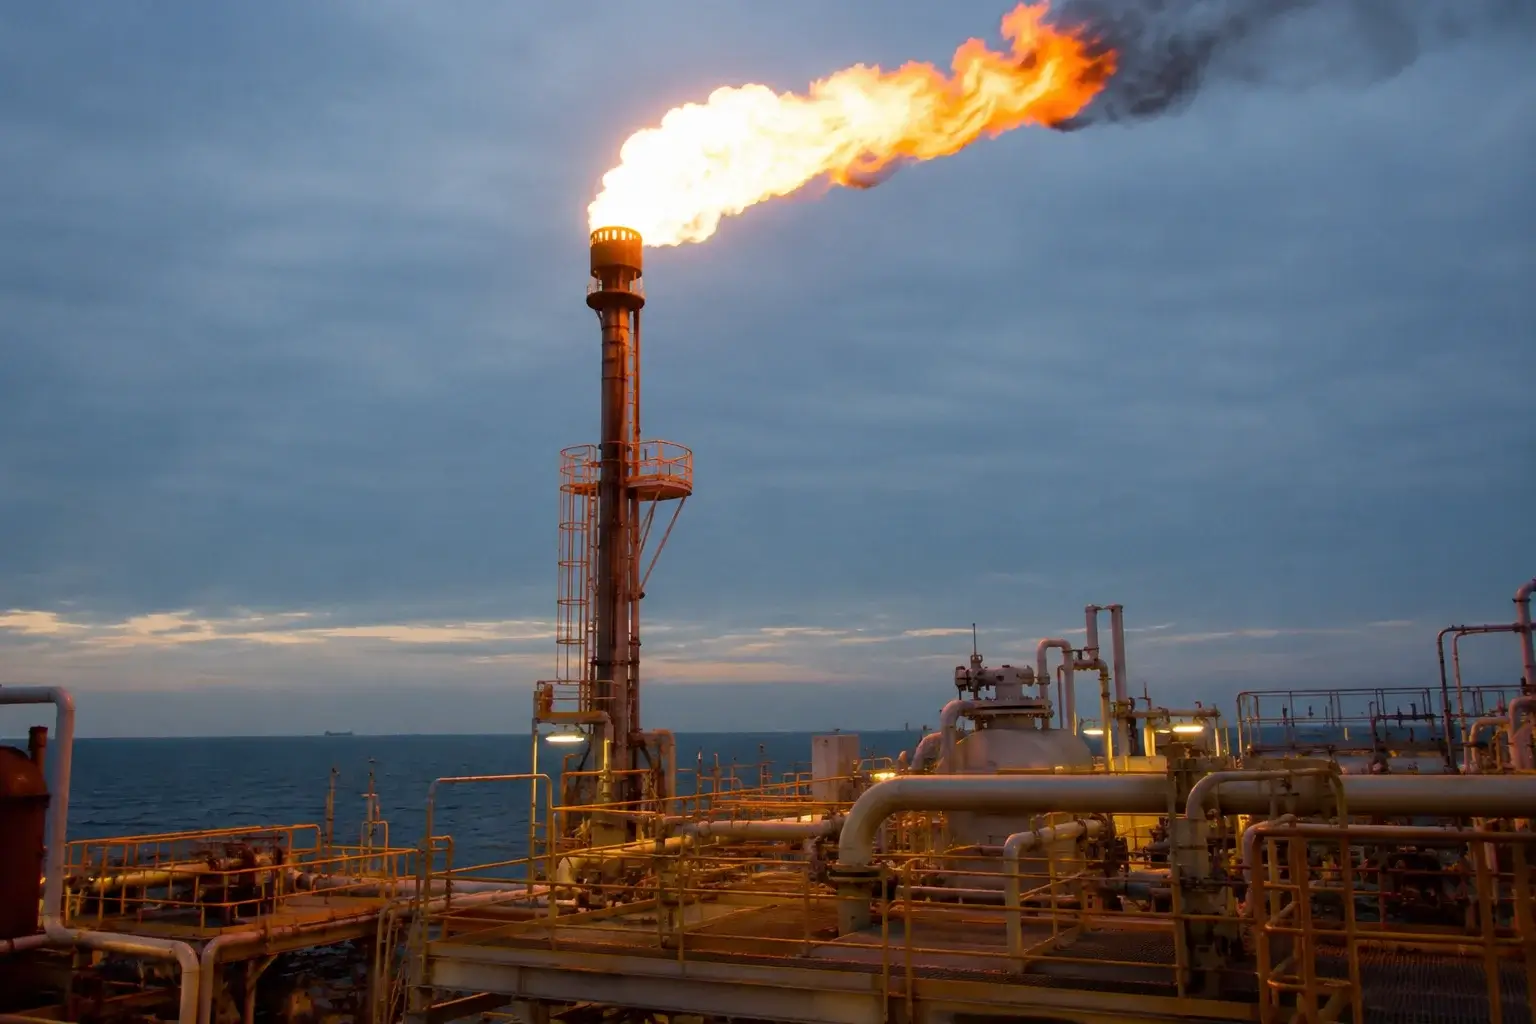
The Strait of Hormuz Math Is the Entire Story
Roughly 20% of the world's oil and liquefied natural gas normally transits the Strait of Hormuz. That shipping corridor has been effectively closed since the Iran war began on February 28. The April 8 ceasefire briefly reopened limited transit, but the long-term peace negotiations have stalled on the question of strait control itself, and traffic has not returned to normal levels. BBC Verify analysis showed that only a handful of ships have completed the crossing since the temporary ceasefire — versus the typical 138 vessels per day that historically transit the corridor. ING analysts reported some resumed activity, including several crude tankers and a Vietnamese-bound Iraqi shipment, but flows remain dramatically below normal and could deteriorate further at any moment.
The conflict has additionally damaged oil and gas infrastructure across the broader Gulf, materially impairing regional refining capacity. The supply-side hit is not just about transit. It is about the actual destruction of production and processing assets across multiple countries. JP Morgan now thinks global crude prices will remain above $100 for the remainder of 2026 even if the strait restrictions are lifted in the near term — and that forecast was published before HFI's panic-buying scenario started circulating across institutional desks. The asymmetry of the risk is what is forcing every commodities allocator to maintain long exposure: the downside if peace breaks out is a move back to $85-$90, while the upside if the strait stays closed is a move to $140-$160 or potentially higher.
Trump's Iran Reversal Failed to Compress the Geopolitical Premium
The Monday Truth Social post explicitly stated: "We will NOT be doing the scheduled attack of Iran tomorrow, but have further instructed them to be prepared to go forward with a full, large scale assault of Iran, on a moment's notice, in the event that an acceptable Deal is not reached." Trump said at the White House that "we were getting ready to do a very major attack tomorrow" but postponed it for "a little while, hopefully maybe forever, but possibly for a little while" because "we've had very big discussions with Iran." He told the New York Post separately that Iran knows "what's going to be happening soon." Axios reported that Trump had been weighing renewed military action after Tehran's latest negotiating proposal fell short of expectations.
The crude market read this correctly. The strike postponement is not a peace deal. It is a 24-to-72-hour delay layered on top of an unresolved structural conflict. The fact that Brent failed to break below $108 on the news — and is now trading at $112.93 in the New York morning session — is the cleanest possible signal that the marginal physical buyer is not waiting for diplomacy to play out. The two largest sources of geopolitical premium compression in the crude curve historically have been either a definitive ceasefire with verifiable terms or a rapid shift in OPEC+ production policy to offset disrupted barrels. Neither is currently in play.
The Pump-Price Pass-Through Is Already Hitting Consumers
The retail transmission mechanism from wholesale crude to gasoline and diesel is no longer theoretical. UK petrol hit 158.5p per litre on May 19, the highest level since the Iran war began. Diesel reached 185.9p per litre. Every $10 move in Brent translates to roughly a 7p per litre move at the pump — and Brent has moved from $73 to a wartime peak of $126 before settling in the current $110-$113 zone, which means UK motorists are paying roughly £14 more per tank for petrol and £27 more for diesel versus pre-war pricing. The RAC has warned that unleaded could push past 160p without a "dramatic and sustained drop" in the underlying crude print. UK price-gouging investigations cleared retailers, confirming that profit margins were "broadly unchanged" through the disruption — meaning the entire cost increase is being driven by the wholesale market, not retailer behavior.
In the U.S., the same pass-through is hitting harder than the retail print suggests. Auto shops across Central Florida have begun warning customers that oil-change costs are likely to rise meaningfully in the coming months as engine oil distributors stockpile inventory ahead of further wholesale price increases. The downstream supply chain — from motor oil to jet fuel to petrochemical feedstocks — is repricing across the board. The IEA warned on April 16 that Europe had "maybe six weeks of jet fuel left" and the UK government has formally allowed airlines to cancel flights in advance without losing takeoff/landing slots if fuel shortages materialize. IATA flagged higher European ticket prices as "inevitable." These are not forecasts. These are operational decisions being made right now by airlines that see the curve.
WTI vs Brent Spread: The Arbitrage Window Is Open
The WTI-Brent spread at the current $108.21 vs $112.93 prints sits at roughly $4.72, which is wider than the $2-$3 range that defined the 2024 mean. The spread widening reflects two parallel dynamics: U.S. shale production has been less disrupted by the Middle East conflict (the supply-side advantage), while Brent is more directly exposed to physical Strait of Hormuz risk (the demand-pull premium). For producers with WTI-linked sales contracts, the absolute price is still extraordinary, but Brent-linked exporters are capturing the larger premium. The spread also signals that U.S. crude is being preferentially redirected toward export markets, which compounds domestic inventory pressure even as global pricing accelerates.
The Forward Curve Is in Steep Backwardation
The current curve structure shows steep backwardation — prompt-month contracts trading at meaningful premiums to deferred deliveries — which is the textbook signal of physical tightness. Backwardation in this magnitude historically indicates that holders of physical barrels can extract a premium for immediate delivery, and that paper-market positioning is not the primary driver of the rally. When markets are in steep backwardation, dips become structurally difficult to sustain because every drawdown triggers physical buyers to pull forward purchases, which re-tightens the spot market. The curve shape is one of the cleanest endorsements of the bullish thesis available in commodity markets — and it has held this structure consistently since late March.
The Technical Setup Is Bullish Continuation, Not Mean-Reversion
The Brent (BZ=F) chart is in a textbook bull-flag continuation pattern. The base of the rally sits at the $73 February low. The wartime spike high at $126 marked the first major resistance. The current $110-$113 consolidation zone is the flag formation, and a daily close above $115 would project a measured-move target into the $135-$140 range. A push above $126 opens the path to $150, which aligns with the HFI panic-scenario level. Downside risk in the structure is contained at $105 (the 50-day moving average area) and $98-$100 (the major psychological round number and the JP Morgan floor projection).
WTI (CL=F) at $108.21 is mirroring the same pattern with cleaner price action. The breakout above $100 in late March confirmed the new uptrend regime. Support at $98-$100 is now reinforced by both the prior breakout level and the 100-day moving average. Resistance at $112-$115 is the immediate test, and a clean break above that band opens $120 as the next magnet, followed by $130 if the geopolitical risk premium re-expands. The RSI on both Brent and WTI daily charts is sitting in the 58-65 range — overbought enough to demand respect but not yet at the 75+ capitulation-rally levels that historically mark trend exhaustion. The MACD remains in positive territory with the signal line still rising, confirming momentum has not yet rolled over.
OPEC+ Discipline Has Held Through the Disruption
The most underappreciated factor sustaining the rally is OPEC+ production discipline. Saudi Arabia has not opened the taps to capture market share from disrupted Iranian and Iraqi flows. Russia has continued exporting at modeled quota levels despite the broader sanctions overhang. The cartel's compliance through the crisis has effectively turned a supply shock into a structural supply deficit — exactly the opposite of what occurred during the 2014-2016 cycle when Saudi flooded the market to discipline U.S. shale producers. The current OPEC+ posture suggests that Riyadh views the $100+ price regime as both politically acceptable and strategically valuable, which removes the single largest historical mechanism for crude price normalization.
U.S. shale production growth has slowed materially compared to 2018-2019 cycle dynamics. Capital discipline among U.S. independents — driven by shareholder return mandates rather than production-volume targets — has capped the supply response that historically would have followed a sustained move above $90. The DUC inventory has been worked down meaningfully, and rig counts have not expanded to the extent the price signal would have implied in prior cycles. Non-OPEC growth from Brazil, Guyana, and Canada is helping at the margin, but none of those additions are large enough to offset the roughly 4-5 million barrels per day of Strait of Hormuz-exposed barrels currently constrained from global markets.
Demand Destruction Has Not Yet Materialized
The conventional model says that crude above $100 should trigger demand destruction through both consumer behavior shifts and industrial substitution. That has not happened at scale yet. Global jet fuel demand has remained resilient despite the airline cost pressure. Chinese refinery runs have held up better than the consensus feared at the start of the conflict. India continues to import discounted Russian crude where available, but is also paying market price for cargoes from alternative suppliers. The petrochemical complex has absorbed the higher feedstock costs into product pricing without major run cuts. The transport fuel segment — particularly diesel — is showing crack spread expansion that signals refiners can still profitably process expensive crude into expensive products. None of this is consistent with a demand-destruction narrative that would cap further upside.
The risk to the demand picture comes from the second derivative: high prices for long enough begin to feed into broader recession risk through inflation channels. The 30-year Treasury yield at 5.20% — the highest since 2007 — and the 10-year at 4.674% are partly a function of crude pushing the inflation narrative back into the policy debate. If sustained $110+ crude triggers a Fed hawkish pivot, the resulting credit tightening could ultimately produce the demand destruction that current spot pricing has not yet generated. But that is a 2027 problem, not a Q2 2026 problem.
Inventory and Refinery Data Confirm the Tightness
The EIA weekly print showing U.S. crude stocks at 1.6 billion barrels as of May 8, down 67 million since the start of April, is the cleanest physical-market data point in the cycle. That 67 million barrel drawdown over roughly five weeks works out to approximately 13.4 million barrels per week — well above the seasonal norm and consistent with the Strategic Petroleum Reserve being actively used to plug the supply gap. The U.S. holds more than the IEA's 90-day net import obligation, but the buffer is shrinking visibly week-over-week. Once that buffer is exhausted — HFI's late-June estimate — the U.S. shifts from being a source of supply absorption to being a competitor for the same scarce cargoes everyone else is bidding for.
European refinery runs have been forced to draw down feedstock inventories aggressively to maintain product output, particularly for diesel and jet fuel. The IEA's warning about Europe having only six weeks of jet fuel reserves at the April reading is a direct function of refinery throughput capacity being unable to keep pace with consumption against a backdrop of restricted crude inputs. Asian refiners have been more aggressive in chasing alternative supply, but Chinese imports of Iranian crude — historically the largest single source of sanctioned barrels reaching the global market — have been hit hardest by the strait closure.
Strategic Petroleum Reserve Has Limited Remaining Capacity
The SPR drawdown trajectory is the single most underappreciated risk in the U.S. crude picture. The reserve was never designed to be the permanent source of marginal supply for the global market. It is a strategic buffer for short-term emergencies. The current pace of drawdown suggests that decision-makers in Washington have effectively been using the SPR as a price-suppression tool to mask the true severity of the supply disruption. That strategy works until it doesn't. When the SPR hits operational minimums — and the math suggests that point arrives in late June to early July — the suppression mechanism disappears, and the spot market has to bid up to clear at whatever level demand actually requires.
Dollar, Yields, and Fed Policy Are Compounding the Setup
The DXY at 99.30 has broken above the 99.13 pivot and is targeting the 99.40-99.66 Fibonacci extension zone, with 100.60 as the next major level. A stronger dollar typically weighs on dollar-denominated commodities, but in the current cycle, the dollar strength is being more than offset by the physical scarcity premium in crude. The relationship between DXY and oil has functionally broken down since the Iran war started — both are responding to geopolitical risk-off flows simultaneously. CME FedWatch shows 53% probability of a Fed hold and 47% pricing in a hike — a massive reversal from the pre-war expectation of two cuts in 2026. The hawkish repricing in Fed expectations is partly a direct response to oil-driven inflation persistence, which creates a self-reinforcing loop: higher oil → higher rates → stronger dollar → but also continued commodity scarcity premium.
What Would Invalidate the Bullish Case
The bull case on oil is not unbreakable. Three scenarios would force a reassessment. First, a verified, durable ceasefire that includes reopened transit through the Strait of Hormuz — with shipping volumes returning to the 138 vessels per day baseline within two weeks of announcement — would compress the geopolitical premium by $15-$20, sending Brent toward $90-$95 quickly. Second, an OPEC+ decision to release production beyond current quota levels by 1-2 million barrels per day in response to the disruption would offset roughly half of the missing Iranian/Iraqi flows. Third, a synchronized China-Europe-US recession that materially compresses oil demand by 2-3 million barrels per day would shift the balance from deficit to surplus. None of these are imminent. All three would need to land in sequence to fully neutralize the current bullish setup.
Read More
-
The Dividend ETF That Doesn't Act Like One — FDVV Rides Nvidia and Apple to a 20.5% Year and Nears Record Highs
06.07.2026 · TradingNEWS ArchiveStocks
-
XRP's ETFs Are Locking Away Supply Relentlessly — XRPI and XRPR Hold Their Floors as $1.44B in Inflows Await the Catalyst the Price Needs
06.07.2026 · TradingNEWS ArchiveCrypto
-
Heat vs. Supply Keeps Gas Pinned at $3.21 — A 100-Degree Heat Wave and Record LNG Flows Battle a 110 Bcf/d Production Flood
06.07.2026 · TradingNEWS ArchiveCommodities
-
The Yen Grinds to 40-Year Lows as the Carry Trade Overpowers Japan's Warnings — USD/JPY at ¥162 With Goldman Betting on More Upside
06.07.2026 · TradingNEWS ArchiveForex
What Would Confirm the Bearish Case
The bear case requires (a) the strait reopening fully, (b) SPR releases continuing at the current pace through Q3, and (c) China demand actually rolling over. Without all three, the path of least resistance is higher. The single cleanest bearish catalyst would be a surprise OPEC+ meeting announcement of a coordinated production increase — and that probability is currently low given Saudi messaging through the crisis.
The Verdict: Strong Buy on Brent and WTI With $135-$150 as Medium-Term Targets
The setup across the global crude complex is the most asymmetrically bullish it has been since the immediate aftermath of the 2022 Russian invasion of Ukraine. Brent (BZ=F) at $112.93 and WTI (CL=F) at $108.21 are not at exhaustion levels — they are at the consolidation zone of a textbook bull-flag continuation pattern, with the curve in steep backwardation, OPEC+ discipline holding, U.S. inventory drawdowns accelerating, the Strait of Hormuz still effectively closed, and the largest independent energy research firm now openly modeling a panic-buying scenario that could push prices through $150 in the first week of June.
The actionable call is a decisive Buy on both Brent and WTI at current levels. The immediate Brent target is $120, the medium-term target is $135-$140 on a measured-move breakout above $115, and the panic-scenario target is $150-$160 if HFI's tank-bottom thesis plays out by late June. On WTI, the equivalent levels are $115 near-term, $125-$130 medium-term, and $145+ in the panic case. Risk management on long positions should set stops below the $98 WTI and $100 Brent levels — those are the structural breakdown points that would invalidate the bullish setup. Dips into $104-$106 WTI and $108-$110 Brent should be aggressively bought.
Pump prices, jet fuel costs, motor oil distribution chains, petrochemical feedstocks, and global inflation prints will all continue to reflect this dynamic for as long as the Strait of Hormuz remains constrained. Every month of delay in normalizing supply, according to Goldman's Daan Struyven, adds approximately $10 to year-end oil prices — which puts the implied December 2026 Brent print, if the disruption persists through July, somewhere in the $130-$140 zone before any panic-buying overlay. The bullish thesis on crude is not a momentum trade. It is a physical scarcity trade backed by hard inventory math, geopolitical reality, and a producer cartel that has decided $100+ is the new equilibrium. Until at least two of the three invalidation conditions hit simultaneously — durable peace, OPEC+ surge supply, or synchronized global recession — the path of least resistance for Oil, Brent, and WTI is higher, and the asymmetry of the risk-reward strongly favors maintaining long exposure across the curve.