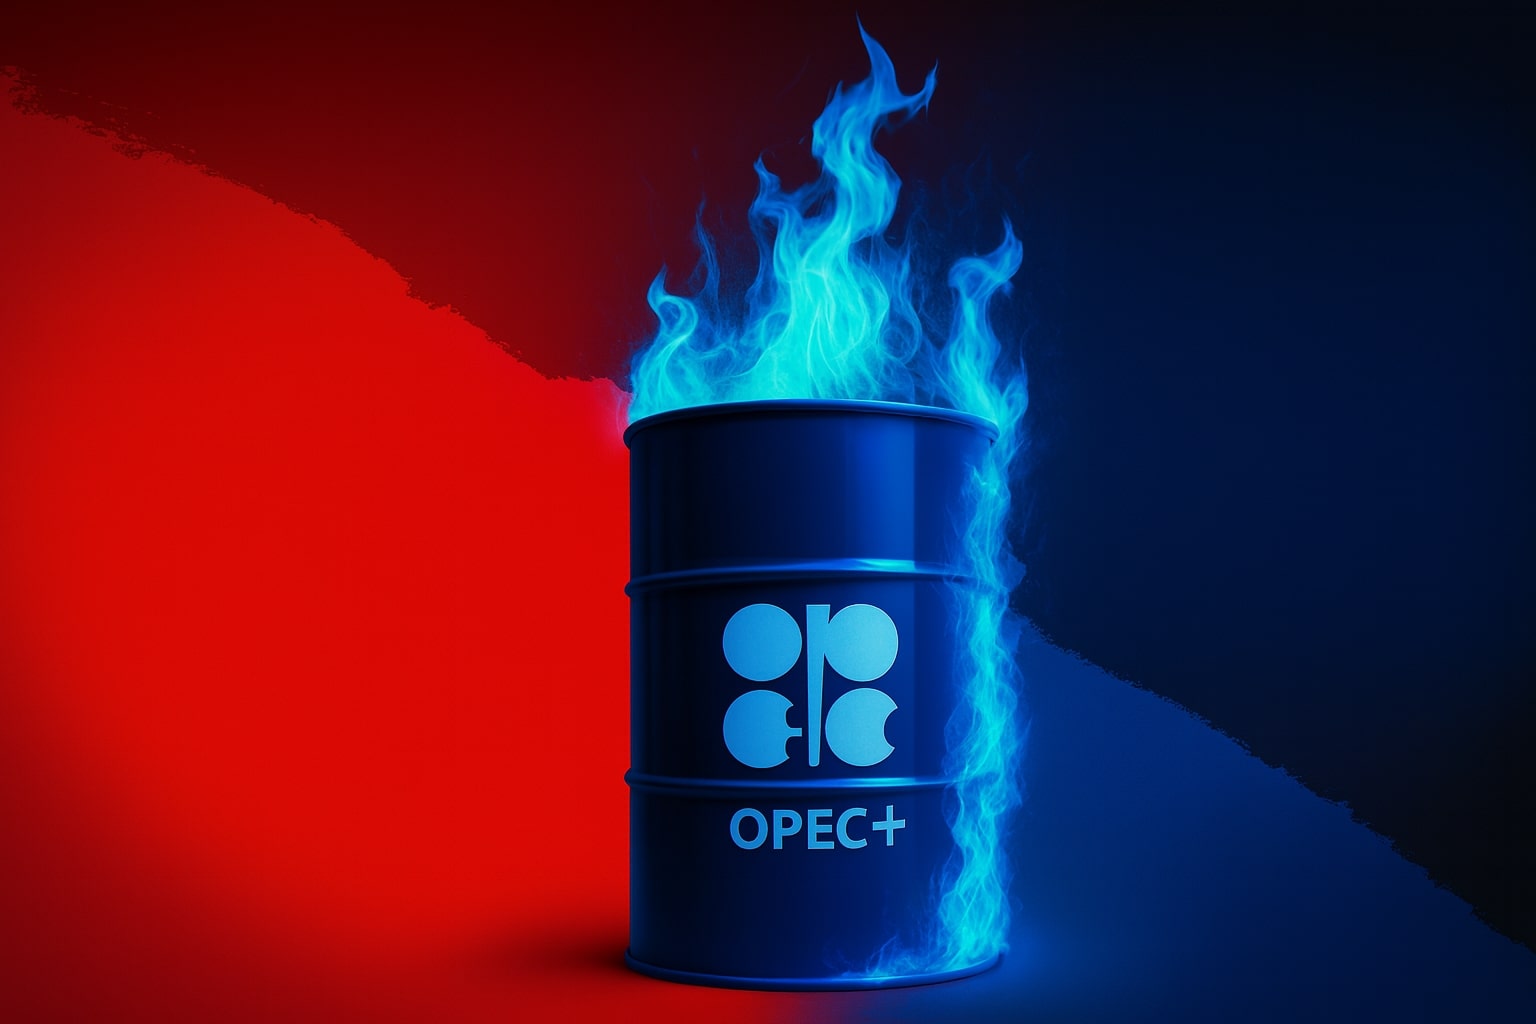
Oil Price Today: WTI Hits $99, Dated Brent at $131.97 — Saudi Output Cut 600K Barrels, JP Morgan Warns $120
The futures market shows $97 Brent — the physical market paid $131.97 for real barrels | That's TradingNEWS
Key Points
- Dated Brent hit a record $144.42 before settling at $131.97 — a 36% premium over futures at $97. The gap between paper oil and real barrels has never been this wide.
- 426 tankers, 34 LPG carriers, and 19 LNG carriers are stranded at Hormuz. Saudi output is down 600K bpd from drone strikes, with the East-West pipeline cut another 700K bpd.
- JP Morgan warns Brent hits $120 if Hormuz stalls through July. WTI is up 53.54% year-over-year from $63.68
WTI Crude (CL=F) is trading at $99.17 per barrel, up 1.33% on the session with a $1.30 gain. Brent Crude (BZ=F) is at $97.03, up 1.16% or $1.11. Those are the numbers that trade on screens, move through ETFs, and get quoted on financial television. They are not the numbers that tell the real story of what is happening in the global oil market right now. The number that tells the real story is $131.97 — the price of Dated Brent, the physical benchmark for real barrels with assigned delivery dates, as assessed by Platts on Thursday afternoon. The gap between $131.97 for a physical barrel and $97.03 for a Brent futures contract is not a rounding error or a technical quirk. It is a 36% premium that the physical market is demanding over the financial market, and it represents the most violent dislocation between paper oil and real oil that energy markets have experienced in modern history. At its peak on Tuesday — the day before the U.S.-Iran ceasefire was announced — Dated Brent hit $144.42 per barrel. A record. Not a record for a specific month or a specific grade — a record for the benchmark that the entire global oil trade uses to price physical cargoes. The futures market has partially corrected on ceasefire optimism. The physical market has not. That divergence is the most important signal in energy markets right now, and every position in oil needs to be calibrated around it.
The Full Oil Price Stack — Every Number That Matters Right Now
Precision on the price context is non-negotiable. At 9 a.m. ET on Friday, Brent was at $97.78 per barrel — a $4.02 gain from Thursday morning's $93.76, representing a 4.28% overnight move. One month ago, Brent was at $108.90 — the current $97.78 represents a 10.21% decline from that level, reflecting the ceasefire-driven selloff from the conflict's peak pricing. One year ago, oil was at $63.68 — the current price is 53.54% higher, a reflection of the war premium that has been baked into crude since the U.S.-Israel attack on Iran in late February. WTI at $99.17 is carrying a premium over front-month Brent futures of approximately $2 per barrel — a complete reversal of the normal relationship where Brent typically commands a $3-$5 premium over WTI. Raymond James senior analyst Pavel Molchanov specifically flagged this as unprecedented: over the past decade, Brent has consistently traded $3-$5 above WTI. During this crisis, WTI briefly surpassed Brent by more than $10 per barrel — a grade relationship inversion that speaks to the complete breakdown of traditional trading patterns. WTI Midland is at $102.60, up 3.58%. The OPEC Basket is at $107.30. The Indian Basket — reflecting the weighted average of crudes imported by India — is at $120.30, up 4.12%. These basket prices reveal the true cost of energy acquisition for different regions and demonstrate that the $97-$99 futures screen price dramatically understates what many real buyers are actually paying for physical barrels right now.
Dated Brent at $131.97 vs. Brent Futures at $96.51 — The Most Important Spread in the World
The $35.46 gap between Dated Brent at $131.97 and front-month Brent futures at $96.51 is the single most analytically important data point in global oil markets and it requires precise explanation to understand why it exists and what it signals. Dated Brent is assessed by Platts based on actual bids, offers, and completed trades in the open physical spot market for North Sea cargoes — specifically barrels with delivery dates from 10 days forward to one month ahead. It is the real-world price of crude oil, the number that refiners actually pay for actual barrels that will actually arrive at their facilities. ICE Brent futures, by contrast, are standardized contracts whose final cash settlement is linked to the forward Brent cargo market through a defined expiry process. Morgan Stanley commodities strategist Martijn Rats put it precisely: these two instruments "are connected, but they do not measure the same exposure in time or at the same point in the chain." When the physical price is 36% above the futures price, it signals that the people who actually need crude oil right now — refiners with tanks to fill, power generators with turbines to run, industrial consumers with production lines to keep moving — are paying dramatically more than the financial market believes the commodity is worth on a forward basis. The futures market is pricing in the ceasefire's potential to normalize supply over weeks. The physical market is pricing in the reality that 426 tankers are stranded at the Strait of Hormuz right now, that not a single barrel from those vessels has arrived at its destination, and that every day of delay represents real product scarcity at real refineries running real production processes. Andrejka Bernatova, founder and CEO of Dynamix Corporation III, framed the $144 Dated Brent peak with precision: "Dated Brent at $144 is not just a price record. It's the physical market telling you that real barrels are becoming scarce. The market is pricing in scarcity, not just risk."
426 Tankers Stranded, 34 LPG Carriers, 19 LNG Carriers — The Scale of the Hormuz Backlog Is Staggering
Standard Chartered has done the physical count that puts a precise number on the supply disruption: 426 tankers, 34 LPG carriers, and 19 LNG carriers are currently stranded at the Strait of Hormuz, unable to transit the waterway that handles roughly 20% of the world's oil and gas supply. These are not ships that have been rerouted or delayed by a few hours. These are vessels that loaded their cargoes — in some cases as far back as late February when hostilities began — and have been sitting, unable to deliver product that has already been sold, for weeks. The LNG situation is particularly acute: two Qatari vessels loaded in late February moved toward the eastern opening of the strait near Oman and were forced to perform a U-turn after Iran denied passage. These would have been the first exports of Qatari LNG in more than a month. The backlog of 426 oil tankers alone, if each vessel carries approximately 2 million barrels, represents somewhere in the vicinity of 850 million barrels of crude oil and petroleum products sitting in floating storage or waiting offshore — a volume that dwarfs the typical 450 million barrel U.S. Strategic Petroleum Reserve. The logistical reality of clearing that backlog, even if Hormuz fully reopened tomorrow, creates what Janiv Shah at Rystad Energy described as "sticky" physical differentials that will persist long after the political agreement is reached. Tanker rates will remain elevated, insurance premiums will stay high, and sour crude buyers will continue paying premiums for supply security from non-Gulf sources.
JP Morgan's $120 Warning — Another Month of Hormuz Closure Keeps Brent Above $100 All Year
JP Morgan issued one of the most significant oil market warnings of the week: if the Hormuz stalemate extends into July, Brent crude will hit $120 per barrel and stay there through the remainder of 2026. That's not a tail-risk scenario — it's the bank's stated base case if the current diplomatic timeline slips by a single month. Goldman Sachs simultaneously argued that even one additional month of Hormuz closure beyond the current timeline means Brent stays above $100 throughout 2026. Both projections are built on the same physical reality: the 426 tanker backlog cannot be cleared quickly, the Saudi production capacity damage from drone strikes is real and persistent, and the market does not have a readily available source of 20 million barrels per day of replacement supply for what Hormuz typically moves. Saudi Arabia's SATORP refinery was shut down after an attack reported in the past 40 minutes — a live, developing event that has direct implications for regional refined product supply. Iran attacked Saudi Arabia's East-West pipeline within the past 48 hours, cutting throughput and reducing the kingdom's ability to export crude through the Red Sea alternative route that it had been using to bypass Hormuz. Saudi production capacity has been cut by approximately 600,000 barrels per day from drone attacks — roughly 10% of normal exports — with the East-West pipeline attacks adding another 700,000 barrels per day of impaired throughput. The Saudi Arab Light crude premium over the Oman/Dubai benchmark has been raised to $19.50 per barrel — a level that Raymond James' Molchanov noted has "never before" exceeded $10. Russian Urals crude, which has traded at steep discounts to Brent since the Ukraine invasion in early 2022, has flipped to trading $30 above Brent in recent weeks — another grade relationship inversion that demonstrates the completeness of the market's breakdown.
Standard Chartered: The Oil Price Correction Is Overdone — $98 Brent Is the Q2 Floor
Standard Chartered's commodity analysts made the most precise institutional call on oil's near-term trajectory: the price correction from the pre-ceasefire highs is likely overdone, and any re-escalation or return of war rhetoric will produce a rapid spike higher. StanChart previously issued a second-quarter Brent forecast of $98 per barrel and WTI at $92.50 — numbers that were established before the ceasefire and that now function as the bank's minimum price expectation even with the truce in place. Their reasoning is structural: Brent is in backwardation along the forward curve with the back of the curve stabilizing at $67-70 per barrel, but the analysts project oil prices will remain $10-20 per barrel above pre-conflict levels even when OPEC attempts to resume maximum production. The specific reasons for this persistent premium are not just geopolitical sentiment — they're operational realities. Transit through Hormuz has not become risk-free simply because a ceasefire was announced. Oil flows remain largely at Iran's discretion, with media reports indicating that ships still require permission from the Iranian navy or risk being destroyed. The Omani Minister of Transport has announced that Oman signed agreements stating no transit fees will be imposed — but the uncertainty about Iran's enforcement of that position keeps vessel spot rates elevated and insurance premiums at crisis levels. StanChart also noted that Iran's level of control over global energy supplies is unlikely to be tolerated indefinitely by other Gulf producers — but "indefinitely" and "immediately" are very different timelines, and in the interim the supply constraint remains physically real regardless of the diplomatic framework around it.
The WTI-Brent Inversion and What Russian Urals at $30 Above Brent Means
The complete inversion of crude grade relationships that Molchanov identified at Raymond James deserves extensive analysis because it reveals how deeply the war has disrupted the fundamental pricing architecture of the global oil market. Brent crude futures trading above WTI by $3-5 per barrel is not a preference — it's the mechanical result of how the two grades are priced relative to their respective baselines, their sulfur content, their API gravity, and their delivery logistics. WTI is a light, sweet crude produced in the U.S. Permian Basin and priced at Cushing, Oklahoma. Brent is a blend of North Sea crudes priced in the European trading hub. For WTI to exceed Brent by $10 per barrel — as it briefly did during the peak of the crisis — requires a complete structural disruption to the normal supply flow that feeds Brent-linked pricing. It happened because Middle East crudes that typically keep European markets supplied were cut off by Hormuz, reducing Brent-linked supply while U.S. WTI supply remained largely unaffected, creating a relative scarcity premium for European-accessible crude. The Russian Urals situation is even more revealing. Urals traded at steep discounts to Brent — sometimes $30 or more below — throughout 2022, 2023, 2024, and into early 2026 because Western sanctions limited the buyer pool for Russian crude, forcing Moscow to offer steep discounts to Asian buyers. Urals flipping to $30 above Brent means something extraordinary: European refiners who cannot source Middle East crude and cannot legally buy Russian crude under sanctions are now paying premiums even for sanctioned barrels because the alternative — shutting down refinery capacity — is more economically damaging than navigating the sanctions regime. The Saudi Arab Light premium to $19.50 over Oman/Dubai is the third grade relationship that has shattered its historical bounds. When every grade relationship that has been stable for decades simultaneously breaks down, the market is communicating a supply shock of unprecedented severity.
Read More
-
VOO ETF Rebounds to $689.80 Toward Its $699 Record as AI Chips Overpower the Iran Shock
09.07.2026 · TradingNEWS ArchiveStocks
-
XRP ETFs Lock Away 970M Tokens With $1.5B of Inflows While the Price Sleeps at $1.09 — The Coiled Spring
09.07.2026 · TradingNEWS ArchiveCrypto
-
Oil Fades to $72.65 WTI Even as the US Strikes Iran a Second Night — The Glut Answers the War Premium
09.07.2026 · TradingNEWS ArchiveCommodities
-
The Yen Sinks to a 40-Year Low Near 162.5 as the Iran Oil Shock Compounds the Widest Rate Gap in Years
09.07.2026 · TradingNEWS ArchiveForex
The Dated Brent Backwardation Structure — $67-70 at the Back of the Curve vs. $131 Spot
The forward curve structure for Dated Brent — from $131.97 at spot to $67-70 at the back of the curve — is in the most extreme backwardation in the instrument's history. Backwardation means near-term prices exceed far-dated prices, which normally indicates tight near-term supply expected to ease over time. But a spot-to-back-of-curve spread of $62-65 per barrel — nearly 50% — is not normal backwardation. It's a market pricing in an acute supply emergency in the immediate term while simultaneously believing that the conflict will eventually resolve and supply will normalize. The back of the curve stabilizing at $67-70 is the market's estimate of what oil is worth in a post-conflict equilibrium — roughly where Brent was trading a year ago before the war began. The front of the curve at $131.97 spot and futures in the mid-$90s is the market pricing in the war premium on actual deliverable barrels. The question of which end of the curve is "right" depends entirely on whether the ceasefire holds, whether Hormuz traffic normalizes, and whether Saudi production capacity is restored. If the Islamabad peace talks this weekend produce a credible pathway to full Hormuz reopening within weeks, the front of the curve collapses toward the back. If talks fail, the back of the curve re-prices toward the front — which is the $120 scenario JP Morgan is warning about.
China's EV Export Surge — Oil Shock Drives 140% Jump and Changes the Long-Term Demand Picture
One of the most consequential long-term implications of the oil price shock is playing out in Chinese electric vehicle export data. The oil price crisis has driven a 140% surge in China's EV exports to record highs — a direct transmission from energy price pain to accelerated adoption of non-petroleum transportation technology. This development matters for long-term oil demand in a way that is structurally different from previous supply shock episodes. The 1970s oil shock accelerated fuel efficiency improvements but not vehicle electrification. The 2008 oil shock produced some hybrid adoption but no wholesale shift. The 2026 Iran conflict oil shock is hitting an EV market that is already at scale in China, already cost-competitive with internal combustion vehicles in many segments, and already capable of rapid production expansion. A 140% surge in exports means the countries receiving Chinese EVs are accelerating their own transitions away from petroleum-dependent transportation. This demand destruction — not just demand deferral — is the structural variable that makes the back of Brent's forward curve sit at $67-70 rather than $90. The market is incorporating the oil shock's own acceleration of its long-term competition. However, that long-term demand erosion doesn't help with the immediate 426-tanker backlog or the $131 Dated Brent print. The market is simultaneously pricing in long-term demand destruction and acute near-term supply scarcity — which is why the forward curve looks the way it does.
China's Refiner Strategy — Buying Iranian Crude at Premium, Redirecting Global Supply
Chinese teapot refiners and state-owned operators are responding to the crisis with the playbook they have refined over multiple sanctions cycles: buying Iranian crude at premium prices and securing supply security through channels that Western buyers cannot or will not use. Reports indicate Chinese refiners are buying Iranian crude at premium — not discount — to the available alternatives. This is a complete reversal of the normal Iran-China trade relationship where China has historically extracted significant discounts from Iranian crude in exchange for being the buyer of last resort under sanctions. Paying a premium means Chinese refiners believe Iranian supply is genuinely scarce and worth the higher price to secure. The SATORP refinery shutdown and East-West pipeline attacks are reducing Saudi refined product availability simultaneously with the Hormuz flow restriction on crude, creating a refined product shortage that is layered on top of the crude supply disruption. Jet fuel supply disruptions are being compared to the 9/11 aftermath — when aviation fuel logistics were disrupted for weeks — and Fortune reports that the supply normalization could take months even after Hormuz fully reopens. The structural reason for this is the refinery proximity problem: refineries optimized for Middle East sour crude cannot simply switch to light sweet WTI or North Sea crude without modifications, meaning the physical supply chain disruption persists even when the diplomatic framework improves.
U.S. LNG Capacity Expansion — The Supply Answer That Arrives in 2027-2028, Not 2026
The natural gas component of the Hormuz disruption is being partially offset by U.S. LNG capacity expansion, but the timing mismatch between the crisis and the supply response is critical. U.S. LNG exports are expected to rise approximately 13% in 2026, driven by Venture Global LNG's Plaquemines facility and Cheniere Energy's (NYSE: LNG) Corpus Christi Stage 3 expansion. Port Arthur LNG in Texas and Rio Grande LNG are scheduled to begin operations between 2027 and 2028, with further projects expected in 2030-2031. Total U.S. LNG export capacity is projected to more than double between 2024 and 2028, rising from 11.9 Bcf per day in 2024 to 21.5 Bcf per day by 2030. The Matterhorn Express Pipeline startup is expected to mitigate takeaway capacity constraints that have historically capped Permian Basin gas production from reaching LNG export terminals. This capacity expansion is structurally bullish for the U.S. position in global LNG markets and represents the answer to the Hormuz-driven Middle East LNG supply disruption — but the answer arrives gradually over 2026-2028, not immediately. The 19 LNG carriers stranded at Hormuz today cannot be replaced by U.S. LNG capacity that doesn't yet exist. StanChart specifically noted that the natural gas market is "coping remarkably well" with the near-term loss of Middle East gas supply because U.S. LNG supply growth is broadly balancing disrupted Qatari and UAE volumes — but "coping" at current prices means the offset is happening at elevated price levels, not at the pre-conflict equilibrium.
The ECB's Impossible Dilemma — Raising Rates to Fight Fossilflation Creates a Perverse Loop
The ECB's policy response to the oil price shock introduces a dimension of the energy crisis that extends well beyond commodity markets into the fundamental architecture of European monetary policy. The ECB is under pressure to raise interest rates in response to energy-driven inflation — but multiple researchers are arguing that doing so would actively harm the long-term solution to the problem it's trying to solve. The mechanism is direct and quantified: a 25-basis-point rate hike by the ECB is associated with a 3.2% decrease in wind turbine installations and a 5.3% decrease in solar panel installations, according to research cited by Antonis Ballis at Aston University. Renewable energy projects require significant upfront capital. When borrowing costs rise, the return hurdle for capital-intensive green projects increases and fewer projects achieve financing approval. The perverse loop that Stanislas Jourdan at the New Economics Foundation identified is devastating in its logic: raising rates to fight fossil fuel-driven inflation delays the renewable energy transition, which extends Europe's dependence on imported fossil fuels, which perpetuates the macroeconomic vulnerability to exactly the type of price shock that triggered the rate hike in the first place. ECB executive board member Frank Elderson acknowledged in the Financial Times that Europe's fossil fuel dependency makes price stability difficult to maintain and that the solution is reducing exposure to imported fossil fuels by accelerating the renewable transition — the exact solution that rate hikes undermine. The alternative being proposed by researchers — a dual interest rate policy offering cheaper financing for green projects while allowing rates to rise for other sectors — has been endorsed by French President Macron and the French national assembly but has not yet been formally proposed by the ECB. The window for implementing it is narrowing as inflationary pressure mounts.
The Strategic Petroleum Reserve Question — Temporary Relief Against a Structural Crisis
Japan announced it will release 20 days of strategic petroleum reserves starting in May — a move disclosed by Prime Minister Sanae Takaichi, with Japan holding 230 days of total reserves as of April 6. The U.S. Strategic Petroleum Reserve exists precisely for supply emergencies of this magnitude. The mathematics of SPR releases against the scale of the Hormuz disruption are sobering. The U.S. SPR holds approximately 450 million barrels. Global oil consumption is approximately 100 million barrels per day. The Hormuz strait, when fully operational, handles approximately 20 million barrels per day — roughly 20% of global supply. Even if the U.S. released the entire SPR contents simultaneously — which it cannot — the reserves would cover approximately 22 days of Hormuz-equivalent supply. The SPR is a bridge, not a solution. It buys time for diplomatic resolution and alternative supply routing to develop, but it cannot substitute for the physical flow of crude through a strategic waterway that handles one-fifth of global energy supply. Japan's 20-day release against its 230-day buffer represents approximately 8.7% of its reserves — a measured, credible commitment that signals coordination among consuming nations without depleting the security buffer that those reserves exist to provide.
The India Factor — Importing Iranian Oil for the First Time in 7 Years
India is set to import Iranian crude for the first time in seven years — a development that reflects how comprehensively the oil crisis has scrambled the geopolitical alignments that had governed energy trade since the 2018 U.S. sanctions regime tightened. India's Oil Minister traveling to Qatar as the LNG supply crisis deepens, combined with the decision to resume Iranian crude imports, signals that Indian energy security considerations are overriding the political cost of sanctions complications. India's oil basket price at $120.30 per barrel — up 4.12% on the day — is the highest benchmark in this analysis and reflects the complex blend of crudes that India sources, which now includes premium-priced alternatives to disrupted Middle East supply. India has more than doubled Russian crude imports to near-record levels simultaneously — running two separate "sanctions-adjacent" supply strategies simultaneously to secure the energy imports that the world's most populous nation requires to sustain its economic growth. The Indian government's willingness to navigate the political complexity of Iranian crude imports while simultaneously deepening Russia exposure demonstrates how comprehensively supply security has overtaken geopolitical alignment in energy policy for major consuming nations facing the Hormuz crisis.
WTI and Brent Are HOLD With Bullish Bias — Here's the Precise Analysis
WTI (CL=F) at $99.17 and Brent (BZ=F) at $97.03 are HOLD with a bullish bias — not an aggressive BUY despite the compelling supply disruption narrative — for one specific reason: the weekend binary risk around Islamabad is enormous and asymmetric in both directions. The bull case is straightforward and supported by every physical market indicator. The Dated Brent premium at $131.97 versus the futures price proves physical scarcity is real. The 426 stranded tankers guarantee the supply disruption persists regardless of what the diplomatic framework says. Saudi production capacity is down 600,000 barrels per day from drone strikes with the East-West pipeline throughput cut by another 700,000 barrels. SATORP refinery shutdown is a live, developing additional supply reduction. JP Morgan's $120 scenario if Hormuz stalls through July is not a stretch — it's the mechanical output of running the supply math. StanChart's $98 Q2 Brent floor with $10-20 above pre-conflict levels as the persistent premium is a credible institutional floor that the market is currently trading through. The bear case rests entirely on the Islamabad talks producing a credible, verifiable, and rapidly implemented Hormuz reopening agreement. If that happens, the front of the futures curve collapses, the Dated Brent premium compresses, and WTI trades back toward $80-85. The physical market backlog clears slowly — the 426 tankers don't move overnight — which means the complete unwind of the crisis premium would take months even in the best diplomatic scenario. The entry point for a long position is any pullback toward $93-95 on Brent (BZ=F) — which is StanChart's Q2 forecast floor — with a target of $105-110 if Islamabad talks fail and JP Morgan's $120 scenario activates as the subsequent extended target. A long position initiated on any dip toward $93 WTI, held with a stop below $88, against a $105-120 target range represents a favorable risk-reward that the physical market data unambiguously supports.