





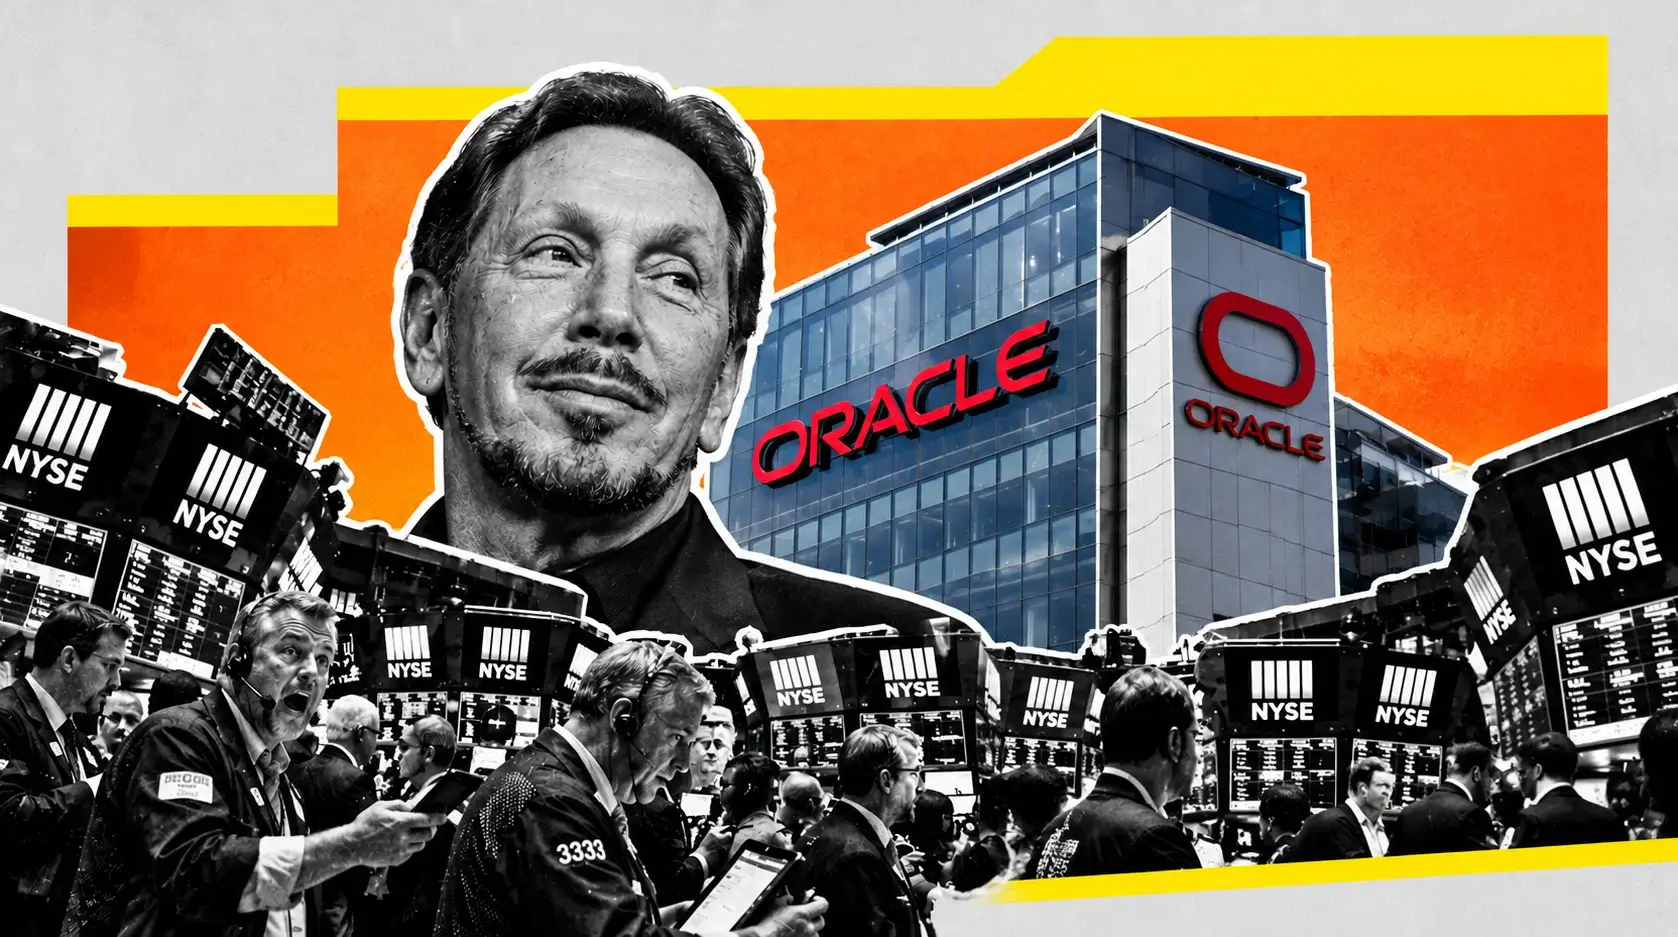
Oracle (ORCL) Sits at $158.78 With $638B Booked and $153 Billion Borrowed — Thursday Settles It
OCI revenue grew 93% and the stock fell anyway, because the market stopped asking whether Oracle can win AI infrastructure | That's TradingNEWS
Key Points
- Oracle closed at $158.78 in a 52-week range of $114.50 to $345.72, below its 200-day average.
- Backlog hit $638 billion, up 363%, with $75 billion prepaid or customer-funded hardware.
- Fiscal 2026 burned $23.7 billion of free cash flow on $55.7 billion of capex.
Oracle closed Friday, September 4, 2026 at $158.78 and added $0.92 in after-hours trade. The stock sits 54.05% below its 52-week high of $345.72, set September 10, 2025, and 38.73% above its 52-week low of $114.50, printed July 28, 2026. Market capitalization is roughly $0.41 trillion.
Shares are trading near the bottom of that 52-week range and below the 200-day simple moving average. The stock has declined roughly a quarter year to date and about a third over the trailing twelve months.
Fiscal first-quarter 2027 results are scheduled for Thursday, September 10, 2026, after the close. Consensus sits at $1.74 in non-GAAP EPS with a range of $1.64 to $1.81, on revenue of $19.13 billion within a range of $18.64 billion to $19.37 billion. The prior quarter delivered $2.11 and $19.18 billion.
The options market is pricing a move of more than 11% on the print.
The thesis for this forecast is that Oracle has already won the argument the market spent two years having, and is now losing a different one that nobody was asking about in 2024.
For two years the bear case was whether a legacy database company could grow cloud infrastructure into the same league as Amazon, Microsoft, and Google. Fiscal Q4 answered it: OCI revenue up 93% to $5.8 billion, total cloud up 47% to $9.9 billion, and remaining performance obligations of $638 billion — up 363% year over year and $85 billion sequentially.
The stock fell anyway.
Investors moved to the one line where Oracle now looks exposed: free cash flow. Fiscal 2026 produced $32.0 billion of operating cash flow against $55.7 billion of capital expenditures, generating negative $23.7 billion of free cash flow. The company raised $43 billion in debt and $5 billion in equity to fund it, and total debt reached a record $153.1 billion.
A backlog of $638 billion is worth nothing if converting it requires more capital than the market is willing to supply.
Thursday's print is the first data point on whether that conversion is working. Everything else is noise until 4:00 p.m. Eastern on September 10.
The Tape: $114.50 to $345.72 and a Stock Below Every Moving Average
The chart describes a collapse rather than a correction.
The 52-week range runs $114.50 to $345.72. At $158.78, Oracle sits 38.7% above the low and 54.1% below the high. The peak was set September 10, 2025 — almost exactly one year before Thursday's earnings date — and the trough came on July 28, 2026.
Between those two points the stock lost more than $200 billion of market value while revenue grew 17% and backlog grew 363%. That divergence is the entire story.
Recent price action has been more constructive. Oracle rose 2.23% on Friday with Cboe data showing mixed options sentiment, and one recent session saw shares gain $2.85 or 1.96% intraday. The stock has been trading below its 50-day moving average since late October 2025 and remains below its 200-day.
Recovery from the July low has been meaningful in percentage terms and unconvincing in structural terms. A 38.7% bounce off a 12-month low that leaves the stock 54% below its peak is a dead-cat pattern until it clears a major moving average, and it has not.
The three-month relative performance has been brutal. Oracle underperformed the technology sector by a wide margin over that stretch, lagging the sector ETF significantly while the broader index held up.
Average daily trading volume runs near 23.7 million shares.
The valuation the stock carried at the peak is worth remembering. In an earlier period Oracle traded at a price-to-earnings ratio above 56 with a PEG near 3.67 and a beta of 1.39, on a market cap that briefly approached $689 billion. That multiple has compressed violently.
On fiscal 2026 non-GAAP EPS of $7.63, the stock trades at 20.8 times trailing earnings. On the fiscal 2027 guide of $8.05, it trades at 19.7 times forward earnings.
Twenty times forward earnings for a company guiding $90 billion of revenue with $638 billion of contracted backlog is not an expensive multiple. It is the multiple applied to a business the market believes cannot fund its own growth.
The 11% implied earnings move tells you how unresolved that question is.
The $638 Billion Backlog and What It Actually Contains
The headline number from fiscal Q4 is unlike anything the enterprise software sector has produced.
Remaining performance obligations ended the quarter at $638 billion, up 363% year over year and up $85 billion sequentially from $553 billion at the end of Q3. That Q3 figure had itself been up 325% year over year, driven by massive AI infrastructure contracts including a $300 billion deal with OpenAI.
For scale, $638 billion of contracted backlog against $67.36 billion of fiscal 2026 revenue represents roughly nine and a half years of current revenue already under contract.
The composition matters more than the total. Most of the RPO increase in both Q3 and Q4 came from large-scale AI contracts where the customer prepaid Oracle for the purchase of GPUs, or where the customer bought and supplied the GPUs to Oracle directly. The prepaid and customer-supplied hardware portions of those large AI contracts now total $75 billion.
That detail is genuinely important and it cuts in Oracle's favor. It substantially reduces the amount of capital Oracle must raise to build out its AI data centers, because the most expensive component — the accelerators — is being funded by the customer rather than by Oracle's balance sheet.
Seventy-five billion dollars of customer-funded hardware inside a $638 billion backlog changes the financing math materially. It does not eliminate the problem; it reduces it.
The trajectory management laid out at its Financial Analyst Meeting frames the conversion path. Oracle guided OCI revenue to grow 77% to $18 billion in fiscal 2026 — a target it hit, delivering $18.1 billion — and then to increase to $32 billion, $73 billion, $114 billion, and $144 billion over the subsequent four years.
Those numbers require Oracle to build data center capacity at a pace no software company has attempted.
Fiscal 2027 revenue guidance was confirmed at $90 billion, with non-GAAP EPS guidance raised to $8.05, representing 18% growth after adjusting for the one-time gains from selling the Ampere chip business and Bloom Energy warrants in fiscal 2026.
Thursday's report has to show RPO holding and conversion accelerating. The full release will be filed at investor.oracle.com.
Negative $23.7 Billion of Free Cash Flow and $153 Billion of Debt
The financing picture is what has taken the stock down 54%.
Fiscal 2026 capital expenditures reached $55.7 billion against $32.0 billion of operating cash flow, producing negative free cash flow of $23.7 billion as Oracle executed on investments to support Cloud Infrastructure growth.
To fund the gap, Oracle raised $43 billion in debt financing and $5 billion in equity financing during fiscal 2026. Total debt increased 60% to a record $153.1 billion in the fiscal third quarter, with $130.9 billion in senior notes and other long-term borrowings outstanding as of February 28.
That is the number that has reframed Oracle from a software company into a leveraged infrastructure developer. Software businesses do not carry $153 billion of debt. Utilities and telecom operators do.
For fiscal 2027, Oracle expects to raise approximately $40 billion through a combination of debt and equity, including a previously announced $20 billion at-the-market equity issuance. An ATM program of that size is a standing dilution mechanism, and equity issued into a stock trading 54% below its high is expensive capital.
The offsetting commentary from the earnings call is the most important thing management said. The CFO stated that Oracle does not expect to raise additional debt funding in calendar year 2026, and noted that reported capex will run $20 billion to $25 billion higher because of customer prepayments and timing effects.
Reported capex rising because customers are prepaying is a very different signal from reported capex rising because Oracle is spending its own money. The first is a working capital timing effect; the second is a cash burn.
Bernstein has since suggested Oracle could be nearing the end of its need to raise cash — the single most bullish analytical view currently in circulation on this name, and the direct counter to the entire bear thesis.
The debt-service arithmetic is unforgiving in the current rate environment. With the two-year Treasury at 4.37%, the 10-year at 4.784%, and a Federal Reserve carrying 60% odds of a hike on September 16, refinancing $153 billion becomes progressively more expensive.
Thursday's cash flow statement and any update on the fiscal 2027 financing plan matter more than the EPS line.
Margin Compression Is Guided, Not a Surprise
Management has already told the market that fiscal 2027 margins go down, which removes one source of surprise and creates another.
The CFO said fiscal 2027 gross margin will step down because of data center ramp timing and mix, with infrastructure margins expected to improve as data centers reach full contractual revenue contribution.
The mechanics are straightforward. A data center under construction generates capital expenditure and depreciation without generating revenue. A data center at partial utilization generates revenue below the level required to cover its fixed cost base. Only at full contractual contribution does the margin profile normalize. Oracle is building at a pace that keeps a large share of its footprint permanently in the first two categories.
One analyst has reaffirmed a Buy rating with an unchanged $240 price target specifically citing IaaS expansion and backlog support despite near-term margin pressures — which is the bull framing of exactly this trade-off.
The second margin variable is component costs, and it connects directly to what is happening in the semiconductor market. During the analyst Q&A, Oracle's president addressed concerns about component cost inflation, particularly in memory and storage. He said Oracle uses fixed-price contracts when costs are known, and when supply-chain or future cost uncertainty is too high, uses mechanisms that can pass costs through — preventing Oracle from absorbing reduced margins when component costs rise.
That answer needs testing against reality. Conventional DRAM contract prices rose 93% to 98% quarter over quarter in the first quarter of 2026 and a further 58% to 63% in the second. NAND contract prices climbed 85% to 90% and then 55% to 60% across the same period. Memory suppliers have exhausted advanced capacity allocation through the end of 2026 and are demanding multi-year commitments.
Micron's gross margin went from 39.0% to 84.9% in four quarters. Somebody is paying for that expansion, and hyperscalers building AI data centers are the somebody.
Pass-through mechanisms work when customers accept them. Whether Oracle's largest AI customers — negotiating from a position of enormous leverage on contracts worth hundreds of billions — accept memory cost pass-throughs is an open question the Q1 gross margin line will begin to answer.
Watch the OCI gross margin disclosure on Thursday. It is the most information-dense number in the release.
Customer Concentration: The OpenAI Problem
The backlog's greatest strength is also its most acute vulnerability.
Because so much of the $638 billion rides on a handful of very large customers — most notably OpenAI, with a reported $300 billion deal — any wobble in their plans could unsettle investors. Morningstar has flagged customer concentration as a real risk given Oracle's outsize exposure to a single counterparty.
The structural issue is credit rather than demand. Oracle is building tens of billions of dollars of physical infrastructure against contracts with a customer whose own funding depends on continued access to private capital markets at valuations that have no historical precedent. If that access tightens, the contract does not disappear immediately, but the conversion timeline extends and Oracle carries the capex in the meantime.
The broader financing backdrop is turning less friendly. Wall Street has embraced the AI rally while showing conspicuously less enthusiasm for the debt financing behind it, and Oracle sits at the center of that distinction as the most levered participant in the buildout.
That is why the stock trades at 19.7 times forward earnings while the backlog implies a decade of revenue visibility. The market is not discounting demand. It is discounting counterparty and funding risk.
The mitigating structure is the prepayment mechanism. With $75 billion of the large AI contracts either prepaid or funded through customer-supplied GPUs, Oracle has already collected cash against a meaningful slice of the obligation. Prepaid customers have a stronger incentive to complete than customers who have committed only on paper.
The comparison worth drawing is Nvidia's own commitment schedule, which allocates $267 billion to memory procurement through fiscal 2029 before dropping to $6 billion in fiscal 2030. Large AI buyers are committing three years forward and no further. Oracle's backlog stretches nine and a half years at current revenue.
Somewhere between those two horizons is the assumption that has to hold.
Thursday's disclosures on RPO composition, customer diversification, and any new multi-billion-dollar signings will inform it. In fiscal Q1 of the prior year, Oracle signed four multi-billion-dollar contracts with three different customers.
Diversification of the backlog would be the most re-rating development available.
Read More
-
Yen Stalls at 160 Despite a 3% JGB and Tokyo Core CPI at 2.0% — Intervention Sits at 164, Friday's Payrolls Decide
02.09.2026 · TradingNEWS ArchiveEnergy
-
QQQ ETF ($706.22) Slides 7.4% Below Its High as the Market Reprices the AI Capex Bill — $686.57 Target if $700 Breaks
22.10.2026 · TradingNEWS ArchiveStocks
-
XRPI ($7.00) and XRPR ($10.74) Slide Toward 52-Week Lows as Spot XRP ETF Flows Stall at $708,510
22.10.2026 · TradingNEWS ArchiveCrypto
-
NG ($2.775) Decoupled From Europe’s €88 Gas Crisis as LNG Feedgas Hits 18.9 Bcf/d — $3.30 Upside on Cold Weather
22.10.2026 · TradingNEWS ArchiveCommodities
-
Dollar-Yen (157.35) Loses 157.65 as the Yen Rallies on Haven Demand — 155 Target if 156 Breaks
22.10.2026 · TradingNEWS ArchiveForex
Analyst Targets: A $110-to-$400 Range on the Same Stock
Sell-side dispersion on Oracle is the widest of any mega-cap in the market.
Forty-four analysts polled carry a Buy consensus with an average price target of $242.69, implying 52.8% upside from $158.78. The low target sits at $110, a 30.7% decline. The high sits at $400, a 152% gain. A separate compilation puts the three-month average at $254.68 across 15 Buy, 4 Hold, and 0 Sell ratings. Two other panels place the average at $261.68 and $267.11.
A $290 spread between the low and high target on a $158 stock is not a disagreement about the quarter. It is a disagreement about whether the business model works.
Individual actions in the past week reflect the split. Morgan Stanley raised its target to $210 from $207 while staying cautious. RBC Capital reiterated a Hold. One firm reaffirmed a Buy with a $240 target citing IaaS expansion and backlog. Jefferies lowered its target to $290 from $320 while keeping a Buy.
Historical target revisions show how violently the range has moved. Royal Bank of Canada raised its target from $145 to $195 at one point with a sector-perform rating, DA Davidson went from $140 to $170 at neutral, BMO moved from $235 to $245 at outperform, Scotiabank initiated at $300 with sector outperform, and Guggenheim raised from $220 to $250 at buy.
The valuation math from spot: at 19.7 times the $8.05 fiscal 2027 EPS guide, Oracle trades at a discount to the S&P 500's forward multiple of roughly 21 despite guiding 18% adjusted earnings growth on $90 billion of revenue.
That is either a mispricing or an accurate reflection of financing risk that earnings multiples do not capture.
The bear framing that has gained traction is blunt: one prominent investor has described the situation as an unwinding that has already begun. The bull framing rests on Bernstein's view that the cash-raising phase may be ending.
Both cannot be right. Thursday's cash flow statement adjudicates.
Fiscal 2026 delivered revenue of $67.36 billion, up 17.35%, with net income of $16.98 billion, up 36.49%. Those are not the financials of a broken company.
What the Options Market Is Pricing
The derivatives market has a clearer view than the sell side.
Options signals point to a potential move of more than 11% on Q1 earnings. On a $158.78 close, an 11% move implies a range of roughly $141.30 to $176.25 in the session after Thursday's report.
That is an enormous implied move for a $410 billion company. Mega-caps typically carry implied earnings moves of 4% to 6%. Eleven percent puts Oracle in the volatility bracket of a mid-cap growth stock, which is itself a statement about how binary the market considers the outcome.
Cboe data showed mixed options sentiment in Oracle on Friday with shares up 2.23% — no directional consensus in the positioning.
The precedent supports the pricing. Oracle has repeatedly delivered violent post-earnings moves in both directions. Fiscal Q2 2026 results included adjusted EPS up 54% to $2.26, revenue up 14% to $16.1 billion, cloud revenue up 34% to $8 billion, a $2.7 billion pre-tax gain from the Ampere sale, and Multicloud database revenue surging 817% — and the stock fell 10.8% the next day.
That reaction is the template. Oracle beats, and the stock falls, because the market cares about a line the beat does not address.
Fiscal Q4 followed the same pattern. Revenue and earnings beat expectations, RPO printed $638 billion, OCI grew 93% — and the stock fell as investors focused on capital spending, financing needs, and the economics behind OCI growth.
Two consecutive quarters of beat-and-drop establishes that the market's concern is structural rather than operational. A third would confirm it definitively.
The practical implication for positioning: an 11% implied move makes outright directional bets expensive and makes premium selling dangerous. Traders expecting a large move are paying up for it; traders expecting a small one are taking unlimited risk into a print that has produced double-digit reactions twice running.
The trade with the cleanest risk profile is a defined-risk structure sized for the implied range rather than a directional stock position.
The report lands Thursday after the close, with Adobe reporting the same day.
Technical Levels: $158.78, the 200-Day Above, and $114.50 Below
The chart offers little support beneath current price and considerable resistance above.
Oracle trades near the bottom of its 52-week range and below its 200-day simple moving average, having traded below the 50-day since late October 2025. Both averages sit overhead as resistance rather than beneath as support.
Recent trading has established a band. Sessions in the past week have ranged $156.71 to $159.70 with an opening print of $159.46 on one of them, and Friday closed at $158.78 with $0.92 added after hours.
Upside references from the recovery: the stock needs to clear the 200-day to change the structure, and the specific analyst target cluster sits at $210 from Morgan Stanley — 32.3% above spot — with $240 to $267 representing the broader consensus band.
Downside references are thinner and more consequential. The July 28 low at $114.50 is the only major structural support, and it sits 27.9% below the current price. Between $158.78 and $114.50 there is limited volume-based structure, because the stock traversed that zone quickly during the summer decline and again during the recovery.
That gap is the reason an 11% implied earnings move is credible. A disappointing print does not find a shelf until well below $145.
The 52-week high at $345.72 requires a 117.7% advance and is not a relevant reference for any near-term framework. What matters is whether the stock can build a base above $150 and clear the 200-day, which would convert the July low into a confirmed bottom.
The catalyst calendar concentrates entirely on Thursday. There is no company news before then, and the macro backdrop — US August CPI on Friday, a Federal Reserve decision September 15-16 with 60% hike odds, and a two-year Treasury yield at 4.37% — is actively hostile to a levered, long-duration equity.
A hot inflation print the morning after Oracle reports would compound any negative reaction and would mute a positive one. That sequencing is unhelpful for bulls.
Position sizing should assume a two-day event risk rather than a one-day one.
The Competitive Position: HPE, Multicloud, and the Sector Read
Oracle's operational momentum is real and it extends beyond the headline backlog.
HPE announced an expanded collaboration with Oracle to help scale Oracle's global AI infrastructure by deploying HPE Juniper Networking across Oracle's AI data centers. Networking partnerships of that scale are signed when buildouts are actually proceeding, not when they are being reconsidered.
The Multicloud database business has been the quietest strong performer, surging 817% year over year in one recent quarter. That business — running Oracle databases inside Amazon, Microsoft, and Google data centers — is the highest-margin growth vector the company has, because it monetizes existing database installed base without requiring Oracle to build anything.
The cloud applications side has been the laggard. Q4 cloud applications revenue increased 10% to $4.1 billion against OCI's 93% growth to $5.8 billion. Infrastructure has overtaken applications as the growth engine and now carries the story.
Oracle's data centers are intended to use clean energy from natural gas fuel cells to generate electricity with minimal emissions — a design choice that connects the company to the power-infrastructure trade and explains the Bloom Energy relationship whose warrants Oracle monetized in fiscal 2026.
The sector context is unfavorable in the near term. AI data center stocks were among the worst performers of a recent week, and the broader concern about debt financing behind the AI rally has weighed on the most levered participants specifically.
Against that, the memory complex ripped on Friday with Micron up 6.10%, SanDisk up 11.17%, and SK Hynix up 8.1%, while Dell reported a $95 billion AI-server backlog and Nebius disclosed $37.49 billion of remaining performance obligations. The infrastructure demand underpinning Oracle's backlog is being independently corroborated across the supply chain.
That is the strongest external validation available for the OCI thesis, and it arrived in the same week Oracle reports.
The distinction the market is drawing: companies selling into the AI buildout with positive free cash flow are being rewarded, while companies funding the buildout with debt are being punished. Micron trades at 8.3 times forward earnings with $24.4 billion of net cash. Oracle trades at 19.7 times with $153.1 billion of debt.
Same theme, opposite balance sheets, opposite treatment.
What Thursday Has to Deliver
Five specific items determine whether the stock re-rates or breaks.
The first is free cash flow. Fiscal 2026 produced negative $23.7 billion on $55.7 billion of capex against $32.0 billion of operating cash flow. Q1 does not need to be positive, but the trajectory needs to show the gap narrowing. A quarter that widens the burn confirms the bear thesis regardless of what revenue does.
The second is the financing update. Management said Oracle does not expect to raise additional debt funding in calendar year 2026, against a fiscal 2027 plan of roughly $40 billion including a $20 billion at-the-market equity program. Reaffirming the no-additional-debt guidance would be materially bullish. Walking it back would be the single most damaging thing management could say.
The third is RPO. The backlog needs to hold near $638 billion and ideally show new signings from customers other than the largest one. Diversification of the backlog addresses the concentration risk that Morningstar and others have flagged, and it is the cleanest path to a higher multiple.
The fourth is gross margin. Management has already guided fiscal 2027 margins to step down on data center ramp timing and mix, so a decline is expected. What matters is the magnitude and whether the memory cost pass-through mechanisms are functioning while DRAM contract prices run at multiples of last year's levels.
The fifth is the fiscal 2027 guide. Oracle confirmed $90 billion of revenue and raised non-GAAP EPS guidance to $8.05 in June. Reaffirming both after one quarter is the minimum acceptable outcome. Trimming either would take the stock through $145 within the session.
Consensus for the quarter sits at $1.74 EPS on $19.13 billion of revenue, against $2.11 and $19.18 billion in the prior quarter. Note that consensus is modelling a sequential revenue decline and a 17.5% sequential EPS decline — expectations have already been reset lower.
That reset is the underappreciated positive. A stock down 54% from its high, trading at 19.7 times forward earnings, into a quarter where consensus expects sequential declines, has a low bar to clear on the operating line.
The bar on the cash flow line remains high.
Scenario Map: Three Paths Out of Thursday
Three outcomes are live and the options market has priced an 11% move to accommodate all of them.
The bull case requires the cash flow trajectory to improve alongside a reaffirmed no-additional-debt-in-2026 stance and RPO holding near $638 billion with evidence of customer diversification. That combination validates Bernstein's view that Oracle is nearing the end of its need to raise cash, removes the financing overhang that has driven a 54% decline, and allows the multiple to expand from 19.7 times toward the market. Targets in that scenario run to Morgan Stanley's $210 — 32.3% above spot — with the $240 to $254 consensus band beyond it. A move of the implied 11% magnitude takes the stock to roughly $176 on the print alone.
The base case is a beat on revenue and EPS with an unchanged financing picture and guided margin compression confirmed. That is the pattern of the past two quarters, both of which produced beats followed by declines — a 10.8% drop after fiscal Q2 and a decline after fiscal Q4 despite $638 billion of RPO and 93% OCI growth. Under this path the stock chops between $145 and $165 with no resolution, and the debate carries to the December quarter.
The bear case begins with widening free cash flow burn, a walk-back on the debt guidance, or any trim to the $90 billion fiscal 2027 revenue guide. Given the thin volume structure between $158.78 and the July low at $114.50, an 11% decline to roughly $141 would find limited support and the $114.50 low would become the operative target. The low analyst estimate of $110 sits just beneath it.
Probability weighting on current inputs: the base case is the favorite based on two consecutive quarters of the same pattern, with the bull and bear cases roughly balanced around it.
The macro overlay applies to all three. Friday's US August CPI lands the morning after the print, with a Federal Reserve decision September 15-16 carrying 60% hike odds and the two-year Treasury at 4.37%. A levered, long-duration equity with $153.1 billion of debt is the wrong asset to hold into rising real rates.
Two events, 48 hours apart, both capable of moving this stock double digits.
Verdict: Range-Bound Into Thursday — Cash Flow Decides, $210 or $114.50
The forecast is neutral into the print with a wide two-sided distribution. Oracle at $158.78 sits 54.05% below its $345.72 high and 38.73% above its $114.50 July low, below both its 50-day and 200-day moving averages, trading at 19.7 times the $8.05 fiscal 2027 non-GAAP EPS guide with $638 billion of contracted backlog — up 363% year over year and equal to roughly nine and a half years of current revenue. The operational argument has already been won: fiscal Q4 delivered revenue of $19.2 billion up 21%, total cloud up 47% to $9.9 billion, OCI up 93% to $5.8 billion, and fiscal 2026 revenue of $67.36 billion up 17.35% with net income of $16.98 billion up 36.49%. The market does not dispute any of it. What the market disputes is funding. Fiscal 2026 burned $23.7 billion of free cash flow on $55.7 billion of capex against $32.0 billion of operating cash flow, financed with $43 billion of debt and $5 billion of equity, taking total debt to a record $153.1 billion — and fiscal 2027 calls for roughly $40 billion more including a $20 billion at-the-market equity program that dilutes into a stock down 54%. Against that, $75 billion of the large AI contracts are already prepaid or funded with customer-supplied GPUs, management says no additional debt funding is expected in calendar 2026, and Bernstein believes the cash-raising phase may be ending. Fiscal Q1 2027 results land Thursday, September 10 after the close, with consensus at $1.74 EPS on $19.13 billion — both sequential declines from $2.11 and $19.18 billion, meaning expectations are already reset. The options market prices an 11%+ move, implying roughly $141 to $176, and the last two quarters both produced beats followed by selloffs, including a 10.8% drop after a quarter with 54% EPS growth. Base case: another beat with an unchanged financing picture and guided margin compression, producing chop between $145 and $165. The bull trigger is narrowing free cash flow burn plus a reaffirmed no-additional-debt stance, which opens $210 and then the $242 to $254 consensus band. The bear trigger is a widening burn, a walk-back on debt guidance, or any trim to $90 billion — and with almost no volume structure between here and $114.50, that path travels fast. US August CPI lands the next morning with the Fed 60% priced to hike five days later. Do not carry an unhedged position through both.
That's TradingNEWS




