Payrolls Print Negative and Wall Street Rips: S&P 500 Back to 7,733, Nasdaq 26,585, Dow 53,952
A 103,000 downward revision and 61.4% participation shoved the Fed hike past December | That's TradingNEWS
Key Points
- July payrolls fell 23,000 vs +83,000 expected; May and June revised down a combined 103,000.
- Atlassian gapped 34% on $1.766B revenue and $1.87 EPS. Doximity ripped 59% to $32.80.
- The Trade Desk collapsed 27% to $12.86 after guiding Q3 revenue to $650M vs $805M consensus.
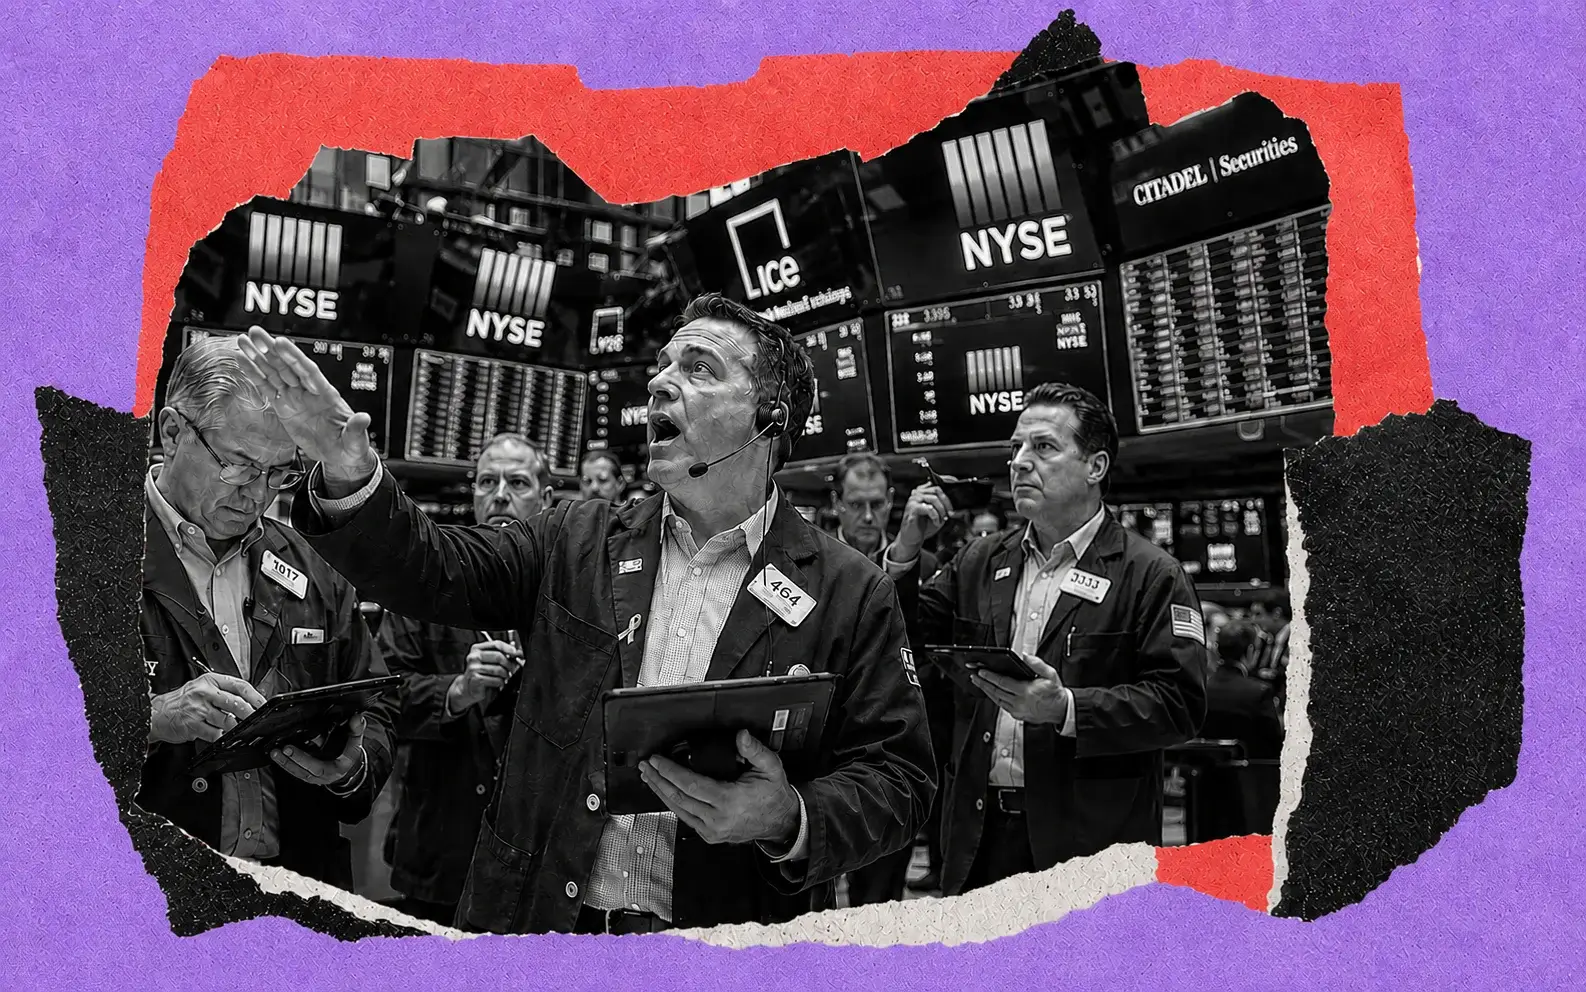
Payrolls came in at minus 23,000 for July and the equity tape did exactly what a market obsessed with one variable does — it ripped. The S&P 500 traded up 0.33% to roughly 7,733, the Nasdaq Composite snapped 0.86% higher to about 26,585, and the Dow Jones Industrial Average tacked on 67 points, or 0.09%, to around 53,952. Those are not spectacular one-day numbers. What matters is the direction of the repricing underneath them, because for six weeks this market has been trading a single fear: that an oil-driven inflation shock would force the Federal Reserve to raise the funds rate off the current 3.50%–3.75% band. One payrolls print took that scenario and shoved it out past December.
The scale of the miss was the story. Consensus sat between 80,000 and 95,000 depending on which survey you read — Dow Jones at 83,000, Econoday at 88,000, Bloomberg at 80,000, Barron's at 95,000. The economy delivered a contraction. Against a prior 12-month average monthly gain of 34,000, per the BLS Employment Situation report, July registered outright job destruction. Stock futures snapped higher within seconds of the 8:30 a.m. ET release, with S&P 500 contracts up 0.5% and Nasdaq 100 futures up 1% before the cash open.
Thursday's session had been ugly. The Dow shed more than 460 points, or 0.85%, to close at 53,885.10, ending a five-session run. The S&P 500 eased 0.18% to 7,709.96 and the Nasdaq Composite dipped 0.06% to 26,348.35. Crude had gapped higher on renewed Strait of Hormuz headlines, bond yields backed up, and the bid faded into the close. Friday erased all of it and then some.
Position the week properly: the S&P 500 is up more than 3% across five sessions, the Nasdaq more than 4%, and the iShares Semiconductor ETF has gained north of 7%. That is the Nasdaq's best week since April. The S&P 500's record close remains 7,736.52 from August 4, which puts the index within four points of a fresh all-time high. The Dow's record close of 54,085.88 sits 134 points overhead. Both are live into next week.
Inside the Payrolls Report: Revisions Did the Real Damage
The headline minus 23,000 was bad. The revisions were worse. Per the BLS release, May was marked down by 66,000 — from a previously reported 129,000 to 63,000 — and June was cut by 37,000, from 57,000 to 20,000. Combined, 103,000 jobs that the market thought existed simply stopped existing. Stack that against July's contraction and the three-month picture collapses to an average of roughly 20,000 per month across May, June and July. That is stall speed for a $30 trillion economy.
The unemployment rate ticked down to 4.1% from 4.2%, which reads bullish until you check the denominator. Labor force participation slid to 61.4% from 61.5%, the lowest reading in more than five years. The jobless rate fell because people left the workforce, not because employers hired them. Temporary layoffs jumped 153,000 to 921,000. Long-term unemployment — 27 weeks or longer — sat at 1.8 million and accounted for 25.5% of all unemployed workers.
Sector detail exposed where the damage concentrated. Local government education dropped 50,000. Retail trade fell 19,000, with warehouse clubs, supercenters and general merchandise accounting for a 21,000 decline on their own. Financial activities lost 14,000, split between credit intermediation at minus 9,000 and insurance carriers at minus 7,000 — that sector is now down 121,000 from its May 2025 peak. Health care added 22,000, well below its 36,000 twelve-month average, with ambulatory services contributing 18,000. Construction added 22,000 and manufacturing added 5,000, the two bright spots tied to data-center buildout.
Wage data cooled alongside. Average hourly earnings rose 2 cents to $37.62, a 0.1% monthly gain and 3.2% year over year — down from the 3.5% pace running through June. Production and nonsupervisory earnings rose 4 cents to $32.40. The average workweek held at 34.3 hours; manufacturing held at 40.4 with overtime edging down 0.1 hour to 3.1.
Layoff announcements had actually improved. July job cuts totaled 33,429, down 27% from June's 45,849 and 46% below the 62,075 announced a year earlier. Firms are not firing aggressively. They have simply stopped hiring. That distinction is the single most important thing in this report, and it is the reason equities rallied rather than got smoked. A preliminary benchmark revision to the establishment survey lands August 28.
The Rate Path Repriced Hard, and Yields Confirmed It
Bonds did the confirming. The 10-year Treasury yield dropped five basis points to 4.63%, extending a move that started the moment the release hit. That is not a growth-scare collapse in yields — it is a policy repricing. Money markets still carry a Fed hike in 2026 on the board, but the timing has been shoved to December at the earliest. The September 15–16 meeting, which had been building genuine hike risk, is now effectively priced as a hold.
Context on where policy sits: the target range is 3.50%–3.75%, midpoint 3.625%, with the effective funds rate at 3.63% and SOFR at 3.64%. The Fed has not cut once in 2026 after three reductions in 2025. At the July meeting the Committee held, and three members dissented in favor of an immediate increase. That dissent count is what had traders nervous. Prediction markets priced roughly 55.5% odds of at least one hike before year-end, driven by June CPI running 3.5% year over year against a 2% target and energy prices refusing to normalize.
Friday's data does not kill that trade. It delays it. Inflation is still the problem — a labor market shedding jobs does not fix crude above $76 or a Strait of Hormuz that has been functionally closed since late February. What changed is the sequencing. A central bank staring at negative payrolls, participation at a five-year low, and wage growth decelerating to 3.2% does not tighten into September. It waits.
Equities read that as pure oxygen, and the reaction function showed up immediately in duration-sensitive names. Software blew through resistance. Semiconductors extended a week that already had the iShares Semiconductor ETF up more than 7%. The Nasdaq 100 outperformed the Dow by roughly 80 basis points on the session.
The VIX sat at 15.11, down 0.26%, which is the tell that nobody is treating minus 23,000 payrolls as a recession signal yet. Volatility does not stay pinned at 15 into a labor market unraveling. Either the vol market is right and this is a soft patch inside an AI-capex boom, or it is badly mispriced. The New York Fed's one-year inflation expectations survey lands Friday as the other data point traders are watching.
Atlassian Gapped 34% and Reclaimed the 200-Day in One Candle
Atlassian was the single biggest large-cap move on the board. TEAM closed Thursday at $110.17, printed $151.57 immediately after the release — a 37.4% pop — and opened Friday around $143.99 for a premarket gain of 30.7%. By mid-session it held a 34% advance. Market capitalization moved to roughly $27 billion. The stock bottomed at $55.97 in April; it is now up 157% from that low.
The print justified the gap. Fiscal Q4 revenue landed at $1.766 billion, up 27.6% year over year and 6.4% above the $1.660 billion consensus. Adjusted EPS came in at $1.87 against a $1.50 estimate — a 24.7% beat. Cloud revenue hit $1.21 billion, up 31%, and contributed 74.6% of the year-on-year quarterly revenue growth. Subscription annual recurring revenue reached $6.606 billion, up 23%. Remaining performance obligations jumped 44% to $4.817 billion.
Margins are where the story turned. GAAP operating margin swung to 12% from negative 2% a year earlier. Non-GAAP margin expanded to 36% from 24%. Operating income flipped positive at $211 million and net profit came in at $139 million. Free cash flow totaled $475 million, a 27% margin. The company also disclosed its largest-ever enterprise agreement.
Guidance beat too. Fiscal Q1 2027 revenue is guided to $1.705 billion–$1.715 billion against a $1.67 billion Street number, roughly 2.8% above consensus at the midpoint. That is the piece that forced the gap rather than a relief bounce — beats on both the print and the outlook change trend structure.
The bear case is in the full-year framing. Fiscal 2027 total revenue growth is guided to about 13%, decelerating hard from 26% in fiscal 2026. Subscription ARR is modeled to rise 18% and cloud revenue 25.5%, but Data Center revenue is forecast to decline 17% on earlier license pull-forwards and migration. Sell-side models now carry roughly 11% revenue growth over the next twelve months.
Technically, TEAM reclaimed its 200-day EMA and blew through $119.27 resistance, the June 1 high. Daily ATR widened to 7.25. Forward P/E of 20 sits below the 24 technology-sector median. Rule of 40 improved to 49. The CEO bought roughly $250 million of stock on the dip.
Doximity Nearly Doubled on an AI Margin Disclosure
Doximity produced the most violent move of the session. DOCS closed Thursday at $20.66, spiked above 130% in premarket trade — touching gains north of 200% at the extreme — then settled to a 59% gain around $32.80 once regular trading absorbed the supply. Roughly 17% of the tradable float was sold short heading into the print. That is the mechanical explanation for the overshoot.
The fundamentals were mixed, which makes the move more interesting. Fiscal Q1 2027 revenue reached $156.62 million, up 7% year over year and 3% above the top end of company guidance, beating the $151.7 million consensus. Adjusted EPS of $0.29 narrowly missed the $0.30 estimate. Adjusted EBITDA hit $74.77 million at a 48% margin, 8% above the high end of guidance. Free cash flow declined 34% as stock-based compensation rose 68%.
What ripped the stock was a single unit-economics disclosure on the call: the AI search product generates more than ten times per search in revenue than it costs to run, with management modeling AI inference costs declining as models improve. That reframed the product from a cost center into a margin engine. Full-year revenue guidance was lifted by $6 million to $671 million–$681 million, with the increase attributed to newly signed AI search contracts rather than the legacy pharma marketing business. Fiscal Q2 guidance came in at $170 million–$171 million against a $171.95 million Street number — 0.8% light.
Engagement metrics carried the narrative. Quarterly active workflow prescribers grew more than 30% year over year. AI prompt volume rose more than 25% quarter over quarter. Scribe note-taking users climbed tenfold in July. Management cited an independent clinical benchmark where the company's assistant recorded a 4.8% error rate — the lowest among 24 clinical models tested, and below the 13.6% attributed to a leading frontier model.
The balance sheet supports the reinvestment. Cash and securities stood at $687.8 million with zero debt, and $91.6 million of stock was repurchased in the quarter. At $32.80, DOCS trades at roughly 33 times trailing revenue. The 52-week range runs $17.15 to $76.51, and the stock had lost 69% of its value over the prior year before this print. Consensus twelve-month price target sits at $30.44 — already 18% below the current quote — with six brokerages hiking targets, the highest to $47 from $42. Fourteen of 23 ratings remain hold or worse.
The Trade Desk Got Smoked: Down 27% to $12.86
The Trade Desk was the disaster of the tape. TTD fell 6.8% during Thursday's regular session, then dropped more than 26% after hours and opened Friday at $12.86 for a 27.2% loss. The stock had already collapsed roughly 78% over the prior twelve months. This is a company that was added to the S&P 500 in 2025 and now trades in the low teens.
Q2 revenue came in at $715.1 million, up 3% year over year against a $752.1 million consensus — a 4.9% miss. Adjusted EPS landed at $0.34 versus $0.40 expected, down 17% year over year and 15.1% below the Street. Adjusted EBITDA hit $241.3 million against $262 million estimated, a 33.7% margin and a 7.9% shortfall. Adjusted net income was $158 million versus $187 million modeled.
Guidance is what broke the stock. Q3 revenue is guided to at least $650 million against an $804.8 million consensus — 19.2% below the Street and a sequential decline from Q2's $715.1 million. That implies a 12% year-over-year contraction. Q3 EBITDA guidance of approximately $160 million sits against a $339.6 million estimate. Put plainly: the company is guiding to its first annual revenue decline since going public, and roughly half the EBITDA the market expected.
Management replaced the CFO, the CMO and the commercial chief in the same announcement. That is not a tweak. That is a reset of the entire commercial organization while guiding revenue down 12%. The company repurchased approximately $78 million of Class A stock during the quarter and had $269 million remaining under authorization as of June 30 — a buyback that has done nothing to arrest the slide.
Growth deceleration in context: Q2 2025 revenue expanded 18.7%. Q2 2026 grew 3%. Q3 is guided negative. The programmatic advertising thesis that carried this multiple for years — that independent demand-side platforms would take share from walled gardens as connected TV scaled — is being repriced in real time. Retail sentiment on social platforms flipped to extremely bullish on the selloff with message volume spiking to extremely high, which is the classic signature of retail catching a falling knife. At $12.86 the stock is priced for structural decline, not cyclical softness. The tape is not arguing with that.
Airbnb, Cloudflare, Lyft and DraftKings: The Rest of the Earnings Board
Airbnb ripped 12%. Q2 EPS came in at $1.37 against a $1.25 consensus on revenue of $3.61 billion versus $3.58 billion expected, up 17% year over year. The stock closed Thursday at $151.64 and traded to $164.48 after hours before extending Friday toward a 19-month high. Adjusted EBITDA expanded 21% with margin up a full point to 35%, and full-year margin guidance moved to a 35.5% floor. Full-year revenue is now modeled to climb at least mid-teens percent.
The cost line carried the print. Sales and marketing spending rose 27% to $875 million against 17% revenue growth — normally a red flag — but customer-support cost per booking dropped roughly 16%, attributed to AI assistant deployment. That is operating leverage showing up in the actual P&L rather than in a slide deck, and it is why the market paid up for a company outspending its revenue growth on marketing.
Cloudflare gained 10% Friday after surging 14.9% after hours. Q2 revenue hit $696.1 million, up 35.9% year over year against roughly $665 million expected. Q3 revenue guidance came in at $736.5 million, 2.1% above consensus, with the full-year outlook raised. NET closed Thursday at $284.43, holding above all major moving averages, and had already carried a valuation near 48 times sales into the print — record-high territory that left no room for error. Record additions across paying customers, large customers and developers delivered the acceleration the multiple required.
Lyft was marginally higher on a split print. Q2 revenue of $1.84 billion beat the $1.81 billion consensus, but EPS of $0.13 missed the $0.14 expected. Beating the top line and missing the bottom line in a business fighting for driver supply gets you nothing in this tape.
DraftKings fell more than 1.5% after missing on both lines. Q2 revenue of $1.44 billion came in against a $1.51 billion estimate, and the company posted a loss of $0.14 per share where the Street modeled a $0.02 profit. Full-year adjusted EBITDA and revenue guidance were reaffirmed, which capped the damage.
Elsewhere on the movers board: PubMatic gained 28.2% to $17.28, FIGS added 28.6% to $14.45, QuidelOrtho dropped 21.6% to $12.80, and Ardelyx fell 21.1% to $3.84. Vistra, Oklo, Under Armour and Wendy's report into Friday's close.
The Consumer Is Cracking and Nobody in Software Cares
Underneath the software melt-up, consumer-facing companies spent the week issuing distress signals. Papa John's cut its outlook and suspended its dividend as North American same-store sales kept sliding, with promotional deals failing to move traffic. Wendy's withdrew its 2026 guidance entirely and slashed its dividend. Under Armour cut its full-year revenue outlook as the turnaround stalled. Four brands, four capitulations, one week.
Sweetgreen was the sharpest cut. The chain slashed full-year same-store sales guidance to a decline of 7% to 8% from a prior 2% to 4% decline — a swing of roughly five percentage points at the midpoint. Full-year adjusted EBITDA guidance moved to a loss of $23 million to $27 million from a prior profit of $1 million to $6 million. Shares fell more than 15% and have dropped nearly 30% since mid-July.
The driver was a multistate cyclosporiasis outbreak that has sickened at least 10,000 people across 15 states and caused two deaths, traced to iceberg lettuce from a supplier facility in central Mexico. Sweetgreen has not been implicated and does not carry iceberg lettuce. It got hit anyway, because consumers stopped buying fresh prepared food category-wide. Chipotle flagged roughly a two-percentage-point sales impact in late July.
Sweetgreen's Q2 numbers showed a business that was actually healing before the outbreak. Same-store sales fell 6.2% — a 2% traffic decline and a 4.2% product mix decline — but that was a sharp improvement from the nearly 13% drop in Q1, which was the worst quarter since the 2021 IPO. Transactions went from down 3% in April and May to flat in June. Revenue rose 3.8% to $192.7 million. Net loss widened to $26.3 million from $23.2 million. Restaurant-level margin compressed 600 basis points to 13.1%. The chain opened four units and closed two, ending at 287.
Read the two tapes together. Enterprise software and AI infrastructure are printing 28% and 36% revenue growth with expanding margins. Restaurants and apparel are pulling guidance and cutting dividends. That is not a broad-based expansion — it is a capital-spending boom sitting on top of a consumer that has run out of room, which is exactly what a minus 23,000 payrolls print with retail trade down 19,000 describes.
Breadth Is the Problem: Russell 2000 Went the Other Way
The Russell 2000 slipped 0.58% in early trading while the Nasdaq climbed 0.86%. That divergence is the most important internal on the board, and it undercuts the clean bullish reading of the jobs report. If the market genuinely believed a shelved Fed hike was the story, small caps — the most rate-sensitive, most domestically exposed, most leverage-burdened cohort in the market — would be leading. They rolled over instead.
Small-cap futures had been up 0.95% premarket at 3,037.70 before the cash session flipped them negative. That reversal happened as traders read past the rate headline into the growth implication. Negative payrolls with participation at a five-year low is not a Goldilocks print for companies that borrow at floating rates and sell to domestic consumers. It is a demand warning.
Look at what actually carried the indexes Friday. Atlassian, Doximity, Cloudflare and Airbnb — four names, three of them post-earnings gaps, all in software or software-adjacent platforms. Semiconductors did the heavy lifting on the week with the iShares Semiconductor ETF up more than 7% across five sessions. The advance is narrow and it is concentrated in the AI capex complex.
That concentration has been the defining feature of 2026. July delivered a brutal momentum unwind — the iShares MSCI USA Momentum Factor ETF fell more than 12% on the month, one of its worst on record, before staging a 5.5% single-day recovery and another 1.1% the following session. The August rebound has been a re-crowding into the same trade that just blew up, not a rotation into anything new.
Sector positioning tells the same story. Through June and July, health care and financials outperformed technology, which kept the Dow pinned near records while the Nasdaq struggled below its early-June high. August reversed that hard — technology is up nearly 7% month-to-date and the Nasdaq roughly 5%. The Dow, with its lower tech weighting, added only 67 points Friday against the Nasdaq's 0.86%.
Earnings season has been genuinely strong: of roughly 300 S&P 500 companies reporting, 85% beat expectations, with aggregate profit growth tracking above 47%. But 47% aggregate growth in a quarter where payrolls printed negative means the earnings are coming from a handful of places, and the equal-weighted economy is nowhere near that number.
Crude, Hormuz, and the Inflation Overhang That Won't Clear
Oil is the reason a Fed hike was ever on the table, and oil did not cooperate Friday. WTI for September delivery traded at $76.82, down $0.47 or 0.61%, while Brent pushed above $83 after climbing more than 4% to $82.80 the prior session. The bid came from renewed Strait of Hormuz tension — an Iranian semi-official outlet reported explosions in the strait tied to intercepting what it described as hostile targets.
The negotiating position hardened. An Iranian parliamentary committee is reviewing a draft proposal that would bar US and Israeli vessels from transiting Hormuz entirely, require countries deemed hostile to pay compensation for passage, and impose penalties equal to 20% of cargo value on violators. Tehran has tied any full reopening to the lifting of the US maritime blockade. A separate temporary shipping arrangement with Oman — expected to run two to four months — is in final drafting, but officials have been explicit that it does not constitute a reopening.
The macro damage is already in the data. Hormuz has been effectively closed since February 28. Brent averaged $85 per barrel in June, down $22 from May, and briefly dropped below $70 on July 1. Per the EIA Short-Term Energy Outlook, global oil consumption is forecast to decline by an average of 1.2 million barrels per day in 2026, with 800,000 barrels of that coming from non-OECD countries — demand destruction from a supply chokepoint, not from weak growth. Consumption is modeled to rebound 2.0 million barrels per day in 2027 to 104.8 million.
Supply-side signals have improved at the margin. US crude inventories rose off their lowest level since 2018, and Saudi Aramco cut its flagship crude price for Asian buyers, which reads as an expectation of improving regional flows. Houthi forces claimed attacks on Saudi positions and threatened additional vessels in the Red Sea, keeping the risk premium intact.
For equities, the arithmetic is straightforward. June CPI ran 3.5% year over year against a 2% target, and energy is the dominant contributor. Crude in the mid-to-high $70s with Brent above $83 keeps headline inflation sticky through the September and December FOMC meetings. A labor market shedding jobs buys the Fed time. It does not resolve the price problem, and it does not clear the path for the cuts equity multiples are ultimately discounting.
Read More
-
Yen Stalls at 160 Despite a 3% JGB and Tokyo Core CPI at 2.0% — Intervention Sits at 164, Friday's Payrolls Decide
02.09.2026 · TradingNEWS ArchiveEnergy
-
FILG ETF — Filecoin Trust ($1.51) Carries a $1.6M Gap Over Its $2.2M in FIL as the Premium Compresses From 2,000%
22.09.2026 · TradingNEWS ArchiveStocks
-
XRP ETF — Spot Funds Hit $1.68B in Inflows While XRPI's CME Futures Structure Bleeds — $1.54 Is the Trigger
22.09.2026 · TradingNEWS ArchiveCrypto
-
NG ($2.84) Fights Record Supply as Cove Point Outage Sinks Appalachian Hubs — $2.75 Next
22.09.2026 · TradingNEWS ArchiveCommodities
-
USDJPY (157.45) Coils Below 157.536 Fibonacci as 275bp Fed-BOJ Gap Keeps Carry Alive — 159.45 in View
22.09.2026 · TradingNEWS ArchiveForex
Cross-Asset Read: Gold Ripped, the Dollar Fell, Bitcoin Held
Gold did what gold does when real rates get repriced lower. December futures traded at $4,429.30, up $129.70 or 3.02% on the session, after earlier printing $4,382.30 for a 1.92% gain — a move that accelerated through the morning. The SPDR Gold Shares ETF gained 1.2% to $394.33. That 3% single-session move in bullion is a bigger signal than the 0.33% in the S&P 500.
Gold has had a difficult 2026. The metal underperformed the S&P 500 by more than 30% since February as a firmer dollar and a hawkish policy stance drove persistent selling. Spot traded near $4,070 in mid-July and around $4,109 in late July. Friday's futures print at $4,429.30 puts it roughly 8.8% above those levels in under three weeks. The bull case has been that the 10-year yield repeatedly peaking between 4.70% and 5.00% would eventually cap the dollar and hand gold the bid. That is what Friday delivered.
The dollar fell alongside yields. Sterling traded at 1.3443, down 0.03%. The greenback had already posted its worst monthly showing since April in July, dropping more than 1% on the month as currency markets absorbed a muddier inflation and policy picture. A softer dollar with gold up 3% and the 10-year down five basis points to 4.63% is a coherent, single-factor repricing of the front end.
Bitcoin held its ground at $65,120.03, up $567.66 or 0.88%, with later prints as high as $65,240.41 for a 1.39% gain and intraday quotes as low as $64,422.04. Crypto's muted response to a dovish repricing is its own data point — this is not the asset class trading as a liquidity proxy the way it did in prior cycles. Bitcoin has retreated from recent highs alongside gold, but only gold caught the bid Friday.
Rates ETFs barely moved. The iShares 20+ Year Treasury Bond ETF sat at $82.46, up 0.07%, which is a modest response to a five-basis-point rally in the 10-year and confirms the move was concentrated at the front end of the curve rather than in duration. SPY changed hands at $769.80, QQQ at $717.81 up 0.44%, and DIA at $537.95 up 0.04% — the ETF complex mirroring the index-level dispersion exactly.
SpaceX: 911.5 Million Shares Unlocked and the Stock Went Up
The largest lockup expiration in recent market history landed Thursday and the stock closed 6.1% higher. SpaceX freed 911.5 million shares — roughly 43% more than the 638.9 million floated in the June IPO — worth approximately $100 billion at current prices. Total tradable share count moved to 1.55 billion from 639 million, lifting the free float to 11.8% of shares outstanding from 4.9%.
The stock dipped to $105.11 in early trading before bouncing to $111.17 and closing up 6.1%. It was up another 1.7% in Friday premarket. That is the opposite of what the supply-demand math predicted, and it happened because the selling was already priced. SPCX had shed more than half its value from the June 16 peak of $225.64 and sat roughly 20% below the $135 IPO price heading in. Massive short interest had built specifically to trade the unlock. When the supply arrived and the price did not break, those shorts got squeezed.
The lockup structure is unusual and matters for the next four months. Rather than a single 180-day cliff, the company adopted a staggered release: insiders could sell up to the first 20% of eligible shares on August 6. Five smaller time-based tranches of roughly 7% each release at days 70, 90, 105, 120 and 135 post-IPO — a steady drip from late August through late October. A second major wave of approximately 28% follows Q3 earnings. The full 180-day expiry hits December 8, 2026. Shares held by insiders in the founding group remain locked until mid-2027.
An additional 455.8 million shares could become available under certain conditions. A separate early-release provision — allowing another 10% if the stock traded 30% above the IPO price during five of ten consecutive sessions before first earnings — did not trigger.
The fundamentals behind the derating are real, not sentiment fatigue. The company posted a $4.9 billion net loss in 2025 and lost another $4.28 billion since. Its first quarterly report as a public company landed August 4 and drove a sharp selloff. The IPO priced at $135, opened at $150 on June 12, and hit $225.64 within a week on more than 500 million shares of day-one volume. From that high the stock has fallen more than 50%. Supply is now a known quantity; the earnings are not.
What the Tape Is Actually Pricing
Strip out the noise and this market is making one specific bet: that the AI capital-expenditure cycle is large enough and durable enough to carry aggregate earnings while the consumer economy contracts. Friday's session was a clean expression of that bet. Software with 28% revenue growth gapped 34%. A salad chain guiding to an 8% comp decline dropped 15%. A pizza company suspended its dividend. Semiconductors added 7% on the week.
The payrolls print supports the bet mechanically. Construction added 22,000 and manufacturing added 5,000 — the two categories most levered to data-center buildout — while local government education shed 50,000 and retail trade shed 19,000. Employment is being reallocated toward AI infrastructure and away from everything the average household touches. That is not a recession signal. It is a composition shift, and equity indexes weighted by market cap capture the winning side of it almost perfectly.
The risk is that the composition shift and the policy path collide. Crude at $76.82 with Brent above $83 and Hormuz functionally closed keeps CPI running near 3.5% against a 2% target. Three FOMC members already dissented for an immediate hike in July. A negative payrolls print buys a pause through September, but it does not resolve an inflation problem sourced from a supply chokepoint that no amount of labor-market softening will fix. If crude re-accelerates and the December meeting delivers, every duration-sensitive name that gapped Friday reprices in the other direction.
Breadth is the tell to watch. The Russell 2000 down 0.58% against the Nasdaq up 0.86% on a session the market read as dovish is not a healthy internal. It says the bid is narrow and mechanical — post-earnings gaps, short covering in Doximity with 17% of the float short, momentum re-crowding after July's 12% factor drawdown. Narrow tapes can run for months. They also break fast.
Valuation offers no cushion. Cloudflare went into its print at 48 times sales. Doximity trades near 33 times trailing revenue after a 59% single-day move. The S&P 500 sits four points from an all-time closing high with payrolls negative and participation at a five-year low.
Levels, Positioning and the Verdict
The technical map into next week is precise. The S&P 500 at roughly 7,733 sits four points below the 7,736.52 record close from August 4 and about 244 points above the 7,489.65 level it closed July at — a 3.25% weekly gain. The Nasdaq Composite at approximately 26,585 has fully recovered the 26,584.99 record-adjacent close from August 4 and is up 4.74% on the week from 25,380.90. The Dow at roughly 53,952 sits 134 points below its 54,085.88 record and is up 2.80% on the week from 52,485.03.
First support for the S&P 500 is Thursday's 7,709.96 close, then the 7,600.50 level from August 3. A break of 7,600 puts the July lows back in play. Resistance is 7,736.52 and then open air — there is no overhead supply above the record. The Nasdaq's structure is identical: 26,348.35 is first support, 26,584.99 is the pivot, and the early-June record roughly 2% higher is the target. The Dow needs 54,085.88 to confirm.
Single-name levels that matter: Atlassian cleared $119.27 and reclaimed its 200-day EMA with daily ATR at 7.25, meaning $7 swings are normal noise; the extension zone runs $144 to $175. Cloudflare needs to hold above $305 to justify 48 times sales. The Trade Desk at $12.86 has no technical support until the market decides what a 12%-declining revenue base is worth. Doximity's consensus target of $30.44 now sits below spot.
The verdict: this is a rally built on a rate-path delay, not a growth improvement, and the two are not interchangeable. Equity buyers got exactly what they wanted from the July payrolls report — a Fed parked through September, a 10-year at 4.63%, and a dollar rolling over — and they paid record multiples for it. The AI capex complex earned its gains this week with genuine acceleration: Atlassian at 27.6% revenue growth with margins swinging 1,400 basis points, Cloudflare at 35.9%, semiconductors up 7%. That is real.
But the same week produced negative payrolls, 103,000 in downward revisions, participation at a five-year low, four consumer brands cutting or pulling guidance, and a small-cap index that went red on the session everyone else celebrated. Own the capex trade, respect the levels, and understand that 15.11 on the VIX is priced for a labor market that just contracted. The mood changed this week. The problems did not.