Solana at $73.25 With TPS Near 1,100 and 7M Active Addresses — Resistance $77, Support $73.21
The category has drawn more than $1.1B since its October 2025 launch while SOL fell roughly 57% over the same window | That's TradingNEWS
Key Points
- SIMD-0286 raised Solana's block compute limit 66% to 100 million units on July 29.
- Spot Solana ETFs posted positive inflows every trading day in July, unlike BTC and ETH.
- SOL trades roughly 75% below its $294.33 peak after nine consecutive red months.
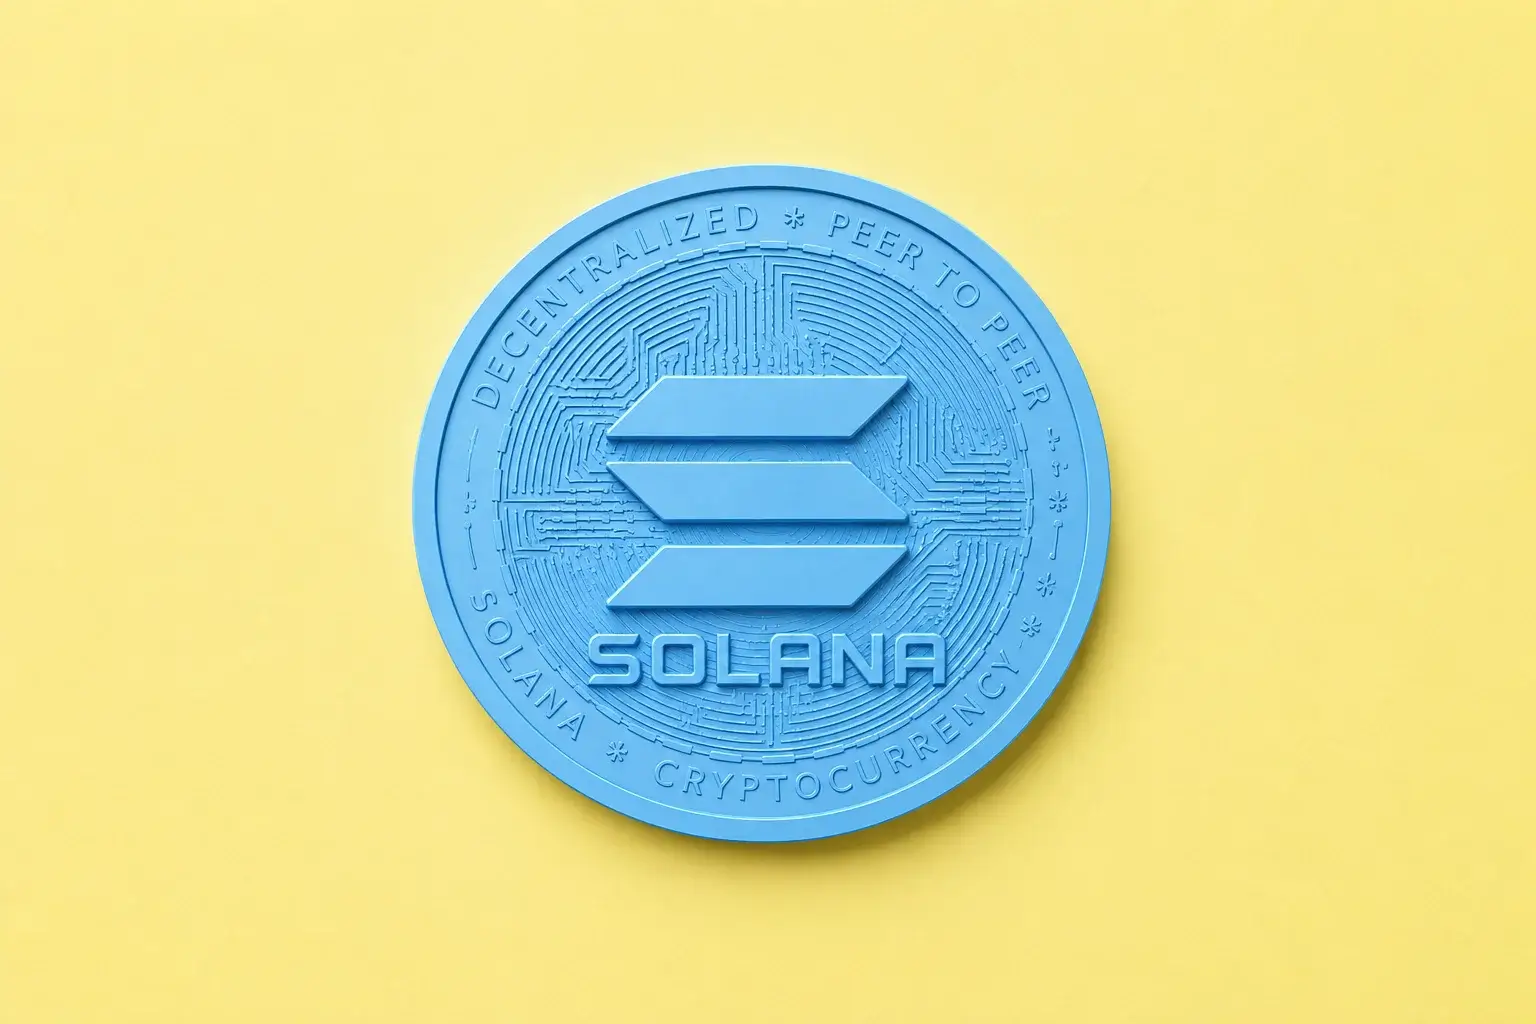
Solana traded near $73.25 into the final session of July, holding a range that has contained it for eight weeks. The daily band ran roughly $74.14 to $75.29 with the weekly range at $72.32 to $77.50, and the token has been boxed between approximately $63 and $80 since early June.
The drawdown is the deepest among the large caps. SOL peaked at $294.33 on January 19, 2025 and trades roughly 75% below it. The token has printed nine consecutive red months — a streak that would stand out in any asset class and is punishing in one where holders are conditioned to expect sharp recoveries. It entered July near $67 and has ground higher without clearing resistance.
Sentiment sits at 29 on the Fear and Greed Index, in fear territory, which is the same reading Ether and XRP carry.
The structural setup is genuinely unusual, and it is the reason this asset is worth analyzing separately from the rest of the complex. On July 29 Solana activated SIMD-0286 at epoch 1009, raising the mainnet block compute limit from 60 million to 100 million compute units — a 66% capacity increase and the single largest throughput expansion the network has made. Active addresses have been retesting yearly highs just below 7 million. Seven-day average transactions per second have trended toward 1,100, approaching an all-time high for network throughput.
The ETF picture is stranger still. U.S. spot Solana ETFs have posted positive net inflows on every single trading day in July 2026, and have accumulated more than $1.1 billion cumulatively since launching October 28, 2025. Over that same window SOL has declined roughly 57% from its launch-period price.
That combination — record throughput, uninterrupted institutional inflows, and a 75% drawdown — is the defining feature of Solana in 2026. Bitcoin funds shed $527 million in a single week during the same period. Ether funds lost $13.67 million. Solana was the only major category where every session closed positive.
The macro wall is identical to every other crypto asset. Bitcoin fell 3% through $63,000 to $62,478 on Friday, the Fed held at 3.50% to 3.75% on a 9-3 vote with September hike odds near 63%, the 10-year Treasury hit 4.731%, and the CLARITY Act's Senate window closed with the August recess days away.
SIMD-0286 Added 66% More Block Capacity in One Step
The largest protocol change Solana has shipped in recent memory went live two days before month-end and moved the price almost not at all.
SIMD-0286 activated on mainnet at the start of epoch 1009 on July 29, 2026, raising the maximum block compute budget from 60 million to 100 million compute units. That is a 66% increase in per-block capacity. The proposal was authored by Lucas Bruder of Jito Labs and first published on GitHub in May 2025.
The upgrade deliberately raised one ceiling and left the others in place. The per-account cap — the maximum compute units any single writable account can consume within one block — holds at 12 million, and the 100 megabyte limit on block account data size is unchanged. The design intent is to widen parallel execution across distinct accounts rather than allow a single hot account to dominate.
That constraint produces a specific improvement in congestion behavior. Under the previous rules a single hot account could consume up to 20% of a block. At 100 million compute units the same account occupies at most 12%, which prevents localized congestion from stalling the entire network during a memecoin launch or a liquidation cascade.
The justification came from live network data. Solana Foundation figures showed 11.2% of all blocks produced under the 60 million regime reached or exceeded 56 million compute units — roughly one block in nine running near maximum operational capacity. Demand arrives in sharp spikes during volatile trading sessions when participants compete for limited block space, and that competition converts into fee escalation for ordinary users.
Core engineers evaluated an intermediate step to 80 million and rejected it in favor of the full jump, citing substantial performance gains across validator client software over the prior twelve months.
The enabling technology is networking rather than execution. Current mainnet bottlenecks are driven primarily by block propagation across thousands of distributed validators rather than by execution duration. Adoption of XDP — kernel-bypass networking available in Agave 4.0.0 and later, and on by default in Firedancer — passed 70% of total stake, which provided the margin required to propagate larger blocks while maintaining 400 millisecond block times. Anza is making XDP the default in Agave v4.2.
The change carries no breaking changes for developers, indexers or exchanges. It activated on testnet at epoch 983 and devnet at epoch 1100 before mainnet.
The prior step, SIMD-0256, moved the limit from 50 million to 60 million and has been live since July 2025. This one moved it four times as far.
1,100 TPS and 7 Million Addresses Against a 75% Drawdown
The usage data underneath the price is running at or near record levels, which produces the cleanest fundamental-versus-price divergence in the crypto market.
Active addresses have been rising sharply and retesting yearly highs just below 7 million. Seven-day average transactions per second have trended steeply higher toward 1,100, approaching a new all-time high for network throughput.
A bearish price structure on higher timeframes now collides with some of the strongest network readings Solana has posted this year. That is the setup in one sentence, and it is the same shape as Ethereum's — usage growing while the token declines — with one important difference in the mechanics.
Ethereum's problem is fee cannibalization: successive upgrades reduced transaction costs so effectively that the EIP-1559 burn stopped supporting the monetary case. Solana never had a burn-driven monetary thesis to lose. Its value accrual runs through staking yield and through the fee and MEV revenue that validators capture, both of which scale with throughput rather than with fee levels.
Raising block capacity 66% increases the number of transactions that can land per slot. If demand fills that capacity, total network revenue rises even as per-transaction cost falls. If demand does not fill it, capacity sits idle and the upgrade produces no economic effect.
The honest framing is that the additional capacity describes what the protocol can accommodate rather than demonstrated growth in usage. Its practical effect depends entirely on how activity uses the available block space, and one block in nine was already running near the old ceiling, which suggests genuine demand pressure rather than speculative headroom.
Firedancer is the other half of the throughput story. Jump Crypto's independent validator client, built in C and C++, went live on mainnet after more than 100 days of controlled testing during which a limited validator group produced over 50,000 blocks without performance issues or downtime. As Firedancer moves toward majority validator adoption through 2026, the throughput ceiling for Solana applications keeps rising.
Client diversity also reduces the single-implementation risk that has historically been Solana's most cited vulnerability after its outage history.
None of it has moved the price. SOL is down 75% from January 2025 with throughput approaching all-time highs.
Every Single Trading Day in July Closed Positive
The ETF flow record is the strongest institutional signal any crypto asset produced this month, and it stands in direct opposition to the price.
U.S. spot Solana ETFs recorded positive net inflows on every single trading day in July 2026. Not a single session closed negative. Cumulative net inflows have passed $1.1 billion since the category launched October 28, 2025, with category assets sitting near $904 million.
The contrast across the complex is stark. Bitcoin spot ETFs registered $527 million of net outflows in one July week, extending an eight-week outflow stretch, and lost over $4 billion across June. Ether funds shed $13.67 million in the comparable week. XRP ETFs drew $17.19 million but broke an eight-week inflow streak with a $7.18 million outflow week and recorded six zero-flow sessions across the month.
Solana was the only major category where every session closed positive.
The daily detail confirms it is real rather than a single large ticket. July 6 produced 103,020 SOL of net inflows across the four active products — 21Shares TSOL, Bitwise BSOL, Grayscale GSOL and Fidelity FSOL. July 21 saw BSOL alone take $2,639,500, lifting its assets under management to $635,063,700 — a single-day inflow representing 0.42% of the fund.
The trajectory has been steady since launch. Cumulative inflows passed $756 million by December 26, 2025, and $900 million by early March 2026. May 2026 produced $115 million of monthly net inflows, the strongest single month since launch.
Institutional names are visible on the register. Dartmouth's endowment disclosed a $3.3 million BSOL position in June. Goldman Sachs disclosed $108 million in SOL ETF holdings as of April 2026. Bloomberg Intelligence's Eric Balchunas noted BSOL recorded the strongest ETF debut of 2025 across any asset class, not just crypto.
That flow pattern runs counter to what typically emerges in retail-driven ETF categories when the underlying declines sharply over several months. Retail flows chase price. These did not.
The Staking Template Is Why the Flows Are Different
The structural reason Solana ETFs behave differently from Bitcoin and Ether products is that they pay yield, and the timing of their launch is why.
Neither spot Bitcoin ETFs nor spot Ether ETFs pay yield to shareholders in their current form. Bitcoin has no native staking mechanism. The Ether ETFs launched in 2024 came without staking after regulatory pushback on the feature. Solana's spot products launched at a moment when the SEC had loosened its posture, giving issuers cover to include the yield inside the fund wrapper.
Bitwise's BSOL stakes 100% of its SOL holdings through Bitwise Onchain Solutions and Helius, a leading Solana validator, targeting average staking rewards above 7% annually with yields varying by network conditions. Rewards pass through to shareholders after the management fee. The REX-Osprey SSK fund also includes staking.
That changes the allocator calculus entirely. A regulated vehicle paying 7% on a volatile asset can be underwritten by a yield-oriented institution in a way a zero-yield vehicle cannot, particularly against a 10-year Treasury at 4.731%.
The fee structure reinforces it. The competitive floor for spot Solana ETFs opened at 0.19% to 0.50% in management fees — a considerably tighter band than the initial Bitcoin ETF launches in early 2024, which ran from 0.20% up to 1.50% before the field compressed. Franklin's product charges 0.19%. BSOL charges 0.20%. Grayscale cut GSOL's annual sponsor fee to 0.19%, its lowest since launch. Canary Marinade sits at the top of the range at 0.50%.
Product expansion continues. Nasdaq filed to list the VanEck JitoSOL Solana Liquid Staking ETF, which would bring liquid staking derivative exposure into a regulated wrapper. There are 23 separate Solana ETF filings pending, which Balchunas described as a land rush, inside a broader backlog of more than 150 crypto ETP filings across 35 digital assets.
Operational maturity is arriving alongside. 21Shares filed an 8-K on July 7 disclosing that TSOL will shift from the CME CF Solana-Dollar Reference Rate to the FTSE Digital Assets Index for daily pricing and NAV calculation, effective August 24, 2026.
The limitation is the same one Ether ETF holders face. A spot Solana ETF gives no access to the application layer — no liquidity provision on Jupiter, no trading on Raydium, no collateral use on Kamino.
$1.1 Billion In, 57% Down — The Same Paradox as XRP
The arithmetic underneath the flow story is uncomfortable and it mirrors what happened to XRP.
Solana ETFs have absorbed more than $1.1 billion of cumulative net inflows. Category assets sit near $904 million. Over the period since the October 28, 2025 launch, SOL has declined approximately 57% from its launch-period price.
That is roughly $200 million of investor capital erased by price depreciation rather than withdrawn — the same mechanism that produced XRP's $507 million gap between $1.49 billion of inflows and $989 million of assets.
The difference is scale relative to the market. Solana ETF assets of $904 million sit against a token that has held roughly 74% of its value away from its peak. XRP's ETF complex holds approximately 1.45% of the token's market capitalization. Neither is large enough to set price.
That is the honest conclusion from both cases. ETF accumulation is a floor rather than a launchpad. Every token locked in a fund cushions the downside by removing float, but the flows have not been large enough to clear the overhang from long-term holder distribution and broad crypto risk-off.
The comparison to Bitcoin puts the scale in perspective. Bitcoin ETFs shed $4 billion in June alone — more than four times Solana's entire cumulative inflow since launch — and Bitcoin fell 50% from its peak while Solana fell 75%.
Higher-beta large caps fall considerably further in percentage terms when liquidity drains from the system, and Solana is the highest-beta major asset in the complex. That relationship works in both directions, which is the bull case: the same beta that produced a 75% drawdown produces outsized recovery when liquidity returns.
The flow data is best read as evidence of who is buying rather than as a price catalyst. Positive inflows every trading day in a month when Bitcoin funds bled and Ether funds were mixed indicates a distinct allocator base with a different mandate — likely yield-seeking rather than momentum-following.
That base is unlikely to sell on a further decline. It is also unlikely to scale fast enough to change the price on its own.
Nine Consecutive Red Months
The monthly candle sequence is the single most damaging statistic attached to this asset.
Solana peaked at $294.33 on January 19, 2025 and has since printed nine consecutive red months. In an asset class where holders are accustomed to violent recoveries inside multi-month downtrends, an uninterrupted nine-month decline represents a regime rather than a correction.
The path was not Solana-specific. Bitcoin fell to roughly $62,500 by late June 2026, approximately half its October 2025 high of $126,198. Ether is down 62% from its $4,951.66 August 2025 peak. XRP sits 71% below its $3.66 July 2025 high. Solana at 75% below its January 2025 top is the deepest of the four, which is consistent with its beta.
The token entered July 2026 near $67 and has recovered to roughly $73 — a gain of about 9% that leaves the monthly candle green for the first time in nearly a year if it holds through the close.
That is the single most important technical fact in this analysis. Breaking a nine-month losing streak is a structural event regardless of the magnitude, because it forces every model built on trend continuation to be re-estimated.
The moving average structure explains why the recovery has been capped. The 20-day EMA sits at $71.97 and price is above it. The 50-day EMA sits at $75.18, the 100-day at $81.59, and the 200-day at $97.17 — all three stacked above the market. That configuration is the textbook definition of a downtrend that has stopped falling without reversing.
Reclaiming $97.17 would require a 33% move from current levels. That is the distance between a bounce and a trend change.
Prediction market positioning quantifies the skepticism. Polymarket data showed a 9.5% probability of SOL reaching $90 by July 2026, with $70 support carrying an 18.5% probability, and overall sentiment reading bearish. The same source placed a 68% probability on $90 by the end of 2026, which implies traders expect the recovery to arrive but not quickly.
Derivatives Positioning Is Crowded Long
The leverage picture is the clearest near-term risk in the setup.
Open interest sits at $1.36 billion with funding at 0.0037% and a long/short ratio of 3.02. That ratio means three dollars of long exposure for every dollar short — crowded long, though not at the euphoric extremes that precede immediate cascades.
The liquidation data shows which side has been paying. Across a recent 24-hour window $16.99 million of positions were wiped out, with longs taking $10.31 million against $6.68 million in shorts. Longs absorbing 61% of liquidations in a sideways market means leveraged buyers are being stopped out on every failed test of resistance.
Funding at 0.0037% is close to neutral, which indicates the long positioning is not being aggressively financed. That is a healthier configuration than a heavily positive funding rate, because it means the crowd is positioned but not paying up to stay there.
The risk is directional. A 3.02 long/short ratio with $1.36 billion of open interest means a break of the $63 to $65 floor triggers forced selling into a market that has already demonstrated it cannot absorb supply. Solana's beta amplifies whatever Bitcoin does, and Bitcoin sits 3.4% above a $1.016 billion Ether liquidation cluster of its own.
The technical scoring adds precision. A 42-indicator composite rates the $74.50 resistance at 76 out of 100, driven by the 50-day simple moving average and the 0.382 Fibonacci retracement. The $73.21 support scores 61 out of 100, supported by Ichimoku Senkou A and an oversold stochastic reading.
Resistance scoring higher than support in a crowded-long market is not a favorable asymmetry.
Longer-horizon holder behavior offers a mixed read. HODL band data has been drifting lower, suggesting patient holders are trimming exposure while the pattern develops, which removes support that was present earlier. Exchange selling is not aggressive, but the investor base is less passive than it was. A move toward new highs would require those cohorts to stop reducing.
The Application Layer Is Where the Value Actually Sits
Solana's economic case runs through what gets built on it, and the build-out has continued through the entire drawdown.
Coinbase and Flipcash launched USDF on Solana, a custom USDC-backed stablecoin and the first live deployment on Coinbase's stablecoin-as-a-service platform. That is the largest U.S. exchange choosing Solana as the settlement layer for a new stablecoin product rather than Ethereum or one of its rollups.
Stablecoin settlement is the highest-value use case available to any chain because it generates persistent, non-speculative transaction volume. Ethereum carries $158 billion of stablecoin float and has struggled to convert that into token value because its fee burn collapsed. Solana's model differs — validators capture fees and MEV, and stakers capture the resulting yield, which flows to SOL holders directly rather than through a supply-reduction mechanism.
The application ecosystem gives holders access an ETF share cannot replicate. Liquidity provision on Jupiter, trading on Raydium, NFT minting on Magic Eden, and collateral use on Kamino all require self-custody. As Firedancer moves toward majority validator adoption and the throughput ceiling rises, that surface expands for direct holders and stays static for fund holders.
The AI agent narrative sits on top. High throughput and minimal transaction costs give Solana structural advantages in consumer applications, payments and machine-to-machine transactions — the specific workloads that require thousands of small transactions per second at negligible cost. That is the argument behind the more aggressive long-term targets.
Longer-dated scenario work produces wide dispersion. An optimistic case built on Solana dominating stablecoin infrastructure and asset tokenization projects $900 to $1,500 by 2031. A conservative case assuming intensifying competitive pressure places SOL at $80 to $150. A probability-weighted average across scenarios centers near $525.
Nearer-term forecasts sit far lower. Models project $72.57 over the next 30 days, a range of $69.00 to $76.14, with 2026 estimates spanning $40.55 to $75.43 on one model and $97.23 to $100 for August on another.
That dispersion — from $40 to $100 inside the same calendar year — reflects how completely the outcome depends on Bitcoin's direction rather than on Solana's own fundamentals.
The Macro Wall Is Identical Across the Complex
Nothing in Solana's setup escapes the same three constraints crushing every crypto asset this month.
The Federal Open Market Committee held at 3.50% to 3.75% on July 29 in a 9-3 vote, with Hammack, Kashkari and Logan dissenting for a hike — the most hawkish dissent since September 2016. September hike odds sit near 63%. The 10-year Treasury jumped to 4.731%, the highest since January 2025, and the 30-year reached 5.263%, a 19-year high.
For an asset yielding roughly 7% through staking, a 4.731% risk-free ten-year is genuine competition in a way it is not for a zero-yield asset. Solana's yield advantage over Bitcoin becomes an argument only when the risk premium for holding a 75%-drawdown token is acceptable, and at current volatility it is not for most allocators.
The CLARITY Act is the second constraint. The Digital Asset Market Clarity Act entered the Senate calendar June 1, 2026 after a bipartisan 15-9 committee vote, and has since gone nowhere. No floor vote, no cloture motion, no scheduled date, with the August recess days away. Polymarket prices 2026 passage at 26% to 28%, down from a February peak of 82%. Senate Majority Leader John Thune does not expect the bill to reach the floor before recess.
Solana's exposure to that outcome is meaningful. The bill resolves SEC versus CFTC jurisdiction, which determines the regulatory treatment of staking, of the tokens issued on Solana, and of the DeFi protocols that constitute its application layer. A smart-contract platform carries more classification risk than a commodity-classified store of value.
The third constraint is Bitcoin. BTC dominance sits at 56.4%, signalling capital gravitating toward perceived safety rather than rotating into altcoins. Bitcoin fell 3% through $63,000 to $62,478 on Friday after a $9.6 billion options expiry cleared. Solana's correlation to Bitcoin in risk-off conditions is high and its beta is higher, which means BTC losing $60,000 takes SOL below $65 mechanically.
The operating layer confirms the retrenchment. Coinbase posted a $359.5 million quarterly loss on revenue down 17% with spot trading volume down 25% — the exchange that custodies most U.S. crypto ETF assets reporting a demand collapse.
Read More
-
Yen Stalls at 160 Despite a 3% JGB and Tokyo Core CPI at 2.0% — Intervention Sits at 164, Friday's Payrolls Decide
02.09.2026 · TradingNEWS ArchiveEnergy
-
ENVA ($173.39) Trades at 10x Earnings After $1.33B Wipeout as Buybacks Accelerate — $167.85 Low Is the Line to Hold
15.09.2026 · TradingNEWS ArchiveStocks
-
IBIT's $134.35M Carries 84% of Monday's Flow as Senate Kills CLARITY Act — $100.09B ETF Complex Now Bitcoin's Last Structural Buyer
15.09.2026 · TradingNEWS ArchiveCrypto
-
NG ($2.908) Holds Above $2.80 Low as LNG Feedgas Hits 18.8 Bcf and TTF Trades 9.2x Henry Hub
15.09.2026 · TradingNEWS ArchiveCommodities
-
Dow Sinks 0.86%, S&P 500 Falls to 7,584, Nasdaq Tests 26,000 as ENVA Craters 24.75%
15.09.2026 · TradingNEWS ArchiveMarkets
-
USD/JPY (155.09) Faces 275bp Policy Gap as BOJ Prepares 31-Year-High Rate — Close Below 154 Opens 153.40
15.09.2026 · TradingNEWS ArchiveForex
The Technical Map: $77 Is the Trigger
The chart is a rising wedge inside a defined box, and the trigger level is well identified.
SOL trades near $73.25 with the daily range at $74.14 to $75.29 and the weekly band at $72.32 to $77.50. Price has been boxed between roughly $63 and $80 since early June, making higher lows while staying capped under resistance near $77 to $80.
Support runs at $73.21, which scores 61 out of 100 on a 42-indicator composite driven by Ichimoku Senkou A and an oversold stochastic. Below that, the 20-day EMA at $71.97 is the next reference. The structural floor is the $63 to $65 zone, and a breakdown there opens the low $50s — a level SOL tested earlier in this downtrend.
Resistance starts at $74.50, which scores 76 out of 100 on the same composite, driven by the 50-day SMA and the 0.382 Fibonacci retracement. Above that the 50-day EMA sits at $75.18, with the $77 to $80 band capping every attempt since June. The zebpay weekly work places immediate resistance at $78.65 with the next key level at $82.30.
The $77 level carries the most analytical weight. Michaël van de Poppe identified it as the trigger, arguing a flip of that price into support opens a path toward $125 to $130. A daily close above $77 to $80 would be the first genuine signal buyers have regained control.
Above that band the 100-day EMA at $81.59 is the next barrier, and the 200-day EMA at $97.17 defines the macro trend. Solana remains $24 below that level, which is why every constructive daily signal exists inside a broader downtrend.
Daily RSI reads 53.86 — neutral, with room in both directions. That combination of a rising wedge, neutral momentum and stacked resistance describes a market compressing toward a resolution rather than trending.
The 52-week context frames the risk. From $294.33 in January 2025 to roughly $63 at the June low is a 79% peak-to-trough decline. The current $73 sits 16% above that trough and 75% below the peak.
Volatility runs near 6% on recent measures, which is moderate for this asset and consistent with a compression phase.
Forecast: $77 Flips or $63 Gets Tested
The base case into August is continued range trade between $65 and $80, with resolution driven by Bitcoin rather than by anything Solana-specific.
The bull path has the clearest catalyst set of any large-cap crypto asset. SIMD-0286 raised block capacity 66% on July 29 with 400 millisecond block times intact. Active addresses are retesting yearly highs near 7 million and seven-day average TPS approaches 1,100, near an all-time high. ETFs recorded positive inflows on every single trading day in July, the only major category to do so, with BSOL staking 100% of holdings at a 7%-plus target yield and 23 further filings pending. A daily close above $77 flips the trigger level and opens $81.59, then the $90 handle where prediction markets place a 68% probability by year-end, and $97.17 at the 200-day EMA. Van de Poppe's $125 to $130 target requires that flip to hold.
The bear path requires only that Bitcoin keeps failing. Open interest at $1.36 billion with a 3.02 long/short ratio is crowded long into resistance that scores higher than support. Bitcoin sits at $62,478 with dominance at 56.4% and a hawkish Fed pricing a 63% September hike against a 4.731% ten-year. Losing $73.21 opens $71.97, then the $63 to $65 floor. A break there targets the low $50s and puts the $40.55 low end of published 2026 ranges in play.
The structural argument stays intact and stays unpriced. Solana runs record throughput on 66% more capacity with Firedancer scaling client diversity, Coinbase selected it for the first stablecoin-as-a-service deployment, Goldman holds $108 million of ETF exposure and Dartmouth's endowment holds BSOL. None of it has closed a 75% gap to the January 2025 peak.
Targets: upside $74.50, then $77, then $81.59 and $90 on a confirmed flip. Downside $73.21, then $71.97, then $65 and $63 on a break.
Solana closes July with the potential to break a nine-month losing streak, a protocol upgrade that added two-thirds more block capacity, uninterrupted ETF inflows across every session of the month, and a price 75% below where it started 2025.