





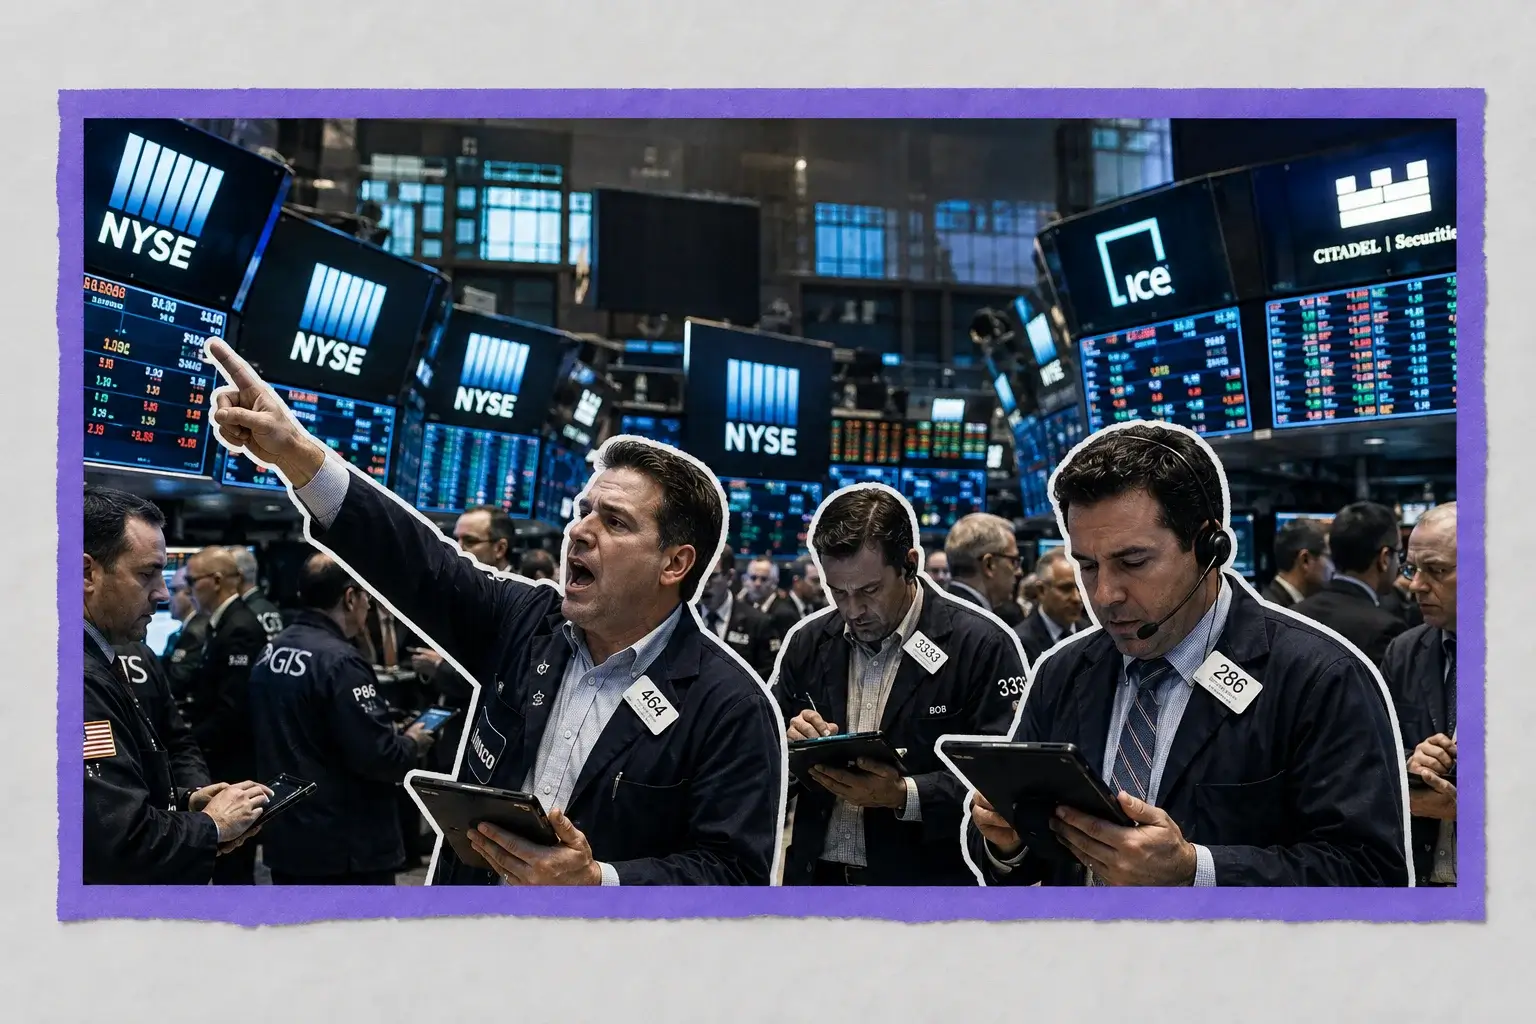
S&P 500 7,672 and Nasdaq 26,085 Go Nowhere, Dow 53,499 Dips as Nvidia Looms After the Bell
July inflation stalled at 3.7% headline and 3.3% core, and money markets now fully price a Fed hike by December | That's TradingNEWS
Key Points
- S&P 500 sat at 7,672.16, down 0.07%, while the Nasdaq slipped 0.25% to 26,084.77.
- Headline PCE held 3.7% against 3.6% consensus; core PCE stuck at 3.3% for a fourth month.
- Nvidia reports at 5:00 PM ET; options price a 5.4% swing worth roughly $280 billion.
The S&P 500 sat at 7,672.16, down 5.12 points or 0.07%, with the Dow Jones Industrial Average at 53,498.61, off 78.79 points or 0.15%, and the Nasdaq Composite at 26,084.77, lower by 66.53 points or 0.25%. The Russell 2000 was the only major index in the green at 3,014.60, up 4.58 points or 0.15%, and it stretched that lead to 0.50% at points in the first hour. VIX printed 15.46. Four indices, four moves smaller than a rounding error, on a Wednesday carrying the July PCE report, the second estimate of Q2 GDP, July durable goods, a $16.68 billion legal settlement from a $1.4 trillion mega-cap, and the largest company on earth opening its books at 5:00 PM Eastern.
That combination does not produce a flat tape by accident. It produces a flat tape because nobody wants to be positioned into it. Every desk that wanted exposure to the AI trade already has it. Every desk that wanted to cut it already did, which is what the seven-session Nvidia losing streak into Monday was. Tuesday snapped that streak with a 2.19% close at $213.05, and Wednesday's session became a holding pattern layered on top of a holding pattern.
The setup coming in was constructive. Tuesday delivered a third straight winning session for the Dow, closing at 53,577.40 after adding 160.24 points, with the S&P 500 up 0.32% to 7,677.28 and the Nasdaq leading at 26,151.30 on a 0.66% gain. That advance ran on falling yields: the 10-year note dropped more than seven basis points to 4.625%, the 30-year eased three basis points to 5.2004%, and the 2-year slipped a single basis point to 4.2166%. Monday's chip purge — Micron down 5.8%, AMD off more than 3%, Broadcom lower by more than 2%, SOXX down 2.7% — had already been mostly repaired.
Wednesday reversed the yield tailwind. Rates ticked higher across the curve immediately after the 8:30 a.m. data drop, S&P futures moved from −0.01% to −0.11% within three minutes, and Nasdaq futures widened from −0.20% to −0.35%. The cash open was mildly red, the S&P trimmed the loss to 0.02% by 9:37, and the Dow briefly flipped 0.05% positive before fading again. The bid never disappeared. It just stopped showing up in size.
Headline PCE Prints 3.7% and the Disinflation Story Officially Stalls
The Bureau of Economic Analysis put the July PCE price index at 0.2% month over month and 3.7% year over year. Consensus wanted 0.1% and 3.6%. Both missed to the upside, and the annual rate held exactly where June left it. That is now three consecutive prints where the headline gauge refused to move down, against a Federal Reserve target of 2%. The gap is 170 basis points wide and has stopped closing.
The composition matters more than the headline. Goods prices actually fell 0.1% on the month, dragged by a 2.7% decline in gasoline and other energy-related goods and a 0.9% drop in furnishings and long-lasting household equipment. Every ounce of the increase came from services, which rose 0.3%, and inside services the damage concentrated in exactly the places that do not respond to rate policy quickly: financial services and insurance up 1.2%, housing up 0.3%.
That split is the problem. When goods deflate and services inflate, the aggregate looks stable while the underlying pressure migrates into the stickiest components of the basket. Energy did the heavy lifting on the downside in July, and energy is the single most reversible input in the index. Crude was above $88 on the WTI front month in mid-August before the Iran de-escalation trade knocked it back. If that reverses, July's goods deflation reverses with it, and the headline goes to 4% without a single services print getting worse.
The market reaction was immediate and modest. The Dollar Index climbed 0.13% to 99.03. Short-dated Treasuries underperformed the rest of the curve, which is the textbook signature of a market repricing policy risk rather than growth risk. Equity futures leaked, then stabilized. Gold, which had been positioned for a soft print with $4,700 as the upside target, slid instead — the front-month contract at 4,679.00, down 15.50 or 0.33%.
Nothing about this print forces the Fed's hand at the September meeting. It also removes any remaining case for the easing bias that equity multiples have been quietly assuming since spring. The next Personal Income and Outlays release covering August is scheduled for September 30, which leaves one CPI report and one employment report between now and the decision that actually matters.
Core PCE Locks at 3.3% for a Fourth Straight Month
Core PCE, stripped of food and energy, rose 0.2% on the month and 3.3% year over year, matching consensus on both lines. That is the number the FOMC actually watches, and it is the number that has gone nowhere.
The sequence: 3.3% in April, 3.4% in May, 3.3% in June, 3.3% in July. Four months of data, net movement of zero. There is no trend to extrapolate in either direction. The economy has settled into a core inflation rate that is 130 basis points above target and shows no mechanical reason to fall further.
That stall is what separates this cycle from the 2023–2024 disinflation. Then, core PCE was grinding lower month after month and the debate was about the pace of descent. Now the descent has stopped, and the debate is about whether the next move is sideways for another six months or up. A Fed that cut its way to 3.50%–3.75% and has now held for five consecutive meetings does not have an obvious next step from here.
The in-line core reading is the reason equities did not break. Had core printed 3.4%, the December hike that money markets are already carrying would have been pulled forward, the 2-year would have gapped, and the multiple compression would have been immediate and ugly. Core holding constant bought the Fed time to sit still, and equities take "sit still" over "hike sooner" every single day.
The Q2 GDP release, published the same morning, complicates the picture further. Inside that report, the quarterly PCE price index was revised up 0.2 percentage point to 5.3%, and the core measure was revised up 0.2 percentage point to 3.6%. Both revisions moved the wrong way. The quarterly figures capture the spring energy spike that the monthly series has since worked past, but upward revisions to already-elevated inflation data are not a detail the bond market ignores.
Put the monthly and quarterly series side by side and the read is consistent: inflation is not accelerating, and it is not decelerating either. It has parked. For an equity market trading near record highs on multiples that assume policy easing arrives eventually, parked is a slow-motion problem rather than an acute one.
The Consumer Went Flat in July While Income Ran 0.4%
Consumer spending rose $36.3 billion, or 0.2%, in July. Adjusted for inflation, real PCE was essentially flat, rising less than 0.1% after a 0.4% gain in June. That is a hard stop in the single largest component of U.S. output.
The internals show where it happened. Services spending climbed $86.2 billion, partly offset by a $49.9 billion decline in spending on goods. Households kept paying for financial services, insurance, healthcare, housing and utilities, and pulled back on physical merchandise. Every nominal dollar of the July increase came from services, which is also where the inflation lives. Consumers are not buying more. They are paying more for the same services and buying fewer things.
Income told the opposite story. Personal income climbed $115.1 billion, or 0.4%, against a 0.3% consensus. Disposable personal income rose 0.5%, the strongest after-tax gain since January. The BEA attributed the increase primarily to compensation, government social benefits, and personal income receipts on assets. Income grew twice as fast as nominal spending during the month.
The residual landed in savings. The personal saving rate rose to 3.0% from the four-year low of 2.6% recorded in June. That is a household sector that got a raise and declined to spend it — the behavioral signature of consumers who expect conditions to get harder rather than easier.
For the market, this is the awkward half of the report. Flat real spending pushes back against the reacceleration case that would justify a hike. Firm income and a rebuilding saving rate push back against the recession case that would justify a cut. The result is a data set that supports the Fed doing nothing, which is precisely what makes the September meeting a coin flip and Friday's Jackson Hole address the most important scheduled event of the week outside of the 5:00 PM earnings print.
Retail confirmed the pinch independently. Dick's Sporting Goods cratered 30.68% on Tuesday after cutting full-year adjusted EPS guidance to $11.00–$12.00 from $13.50–$14.50, torching roughly $4.9 billion in market value. Kohl's fell 4.7% Wednesday on comparable sales down 0.9% against a 0.6% expected decline. The consumer is not collapsing. The consumer is trading down, and the retailers exposed to discretionary goods are absorbing it in margin.
GDP Confirmed at 1.5% and Corporate Profits Ripped $400.9 Billion
The second estimate of Q2 GDP held real growth at a 1.5% annualized rate, unrevised from the advance figure and down from 2.1% in Q1. An upward revision to consumer spending was offset by an upward revision to imports, which subtract from the calculation. The deceleration from Q1 traced to a downturn in government spending and slower investment and exports.
Underneath the flat headline, the private-sector detail was strong. Personal consumption expenditures rose 3.4% in the quarter, the fastest since Q3 2025, driven by a 4.3% jump in goods spending and 3.1% in services. Fixed investment climbed 7.0%, led by an 8.5% surge in nonresidential investment as equipment and intellectual property spending absorbed AI infrastructure demand. Residential investment rose 1.3%, breaking a five-quarter contraction. Government spending fell 1.0% on a 13.2% plunge in nondefense federal outlays.
Strip out inventories and net exports and real final sales to private domestic purchasers rose 3.9%, against 1.7% in Q1. The private economy is running well above the headline. The headline is being held down by government contraction and an import surge, neither of which reflects demand weakness.
Real gross domestic income rose 2.2% in Q2 against 1.2% in Q1. The average of real GDP and real GDI came in at 1.8% versus 1.7%. When GDI runs above GDP, the income-side measurement of the same economy is picking up activity the expenditure side is missing.
Corporate profits from current production increased $400.9 billion in the quarter, against a $74.4 billion increase in Q1. That is a 5.4x acceleration in the profit line, and it is the single most equity-relevant number in the entire release. Whatever tariff and energy cost pressure hit input costs during the spring, corporate America passed enough of it through to expand profits at a rate the top-line growth figure does not remotely suggest.
Durable goods orders for July, released the same morning, ran 1.1% month over month to $339.3 billion against a 0.5% consensus. Capital spending momentum carried into Q3.
Solid expansion, stalled inflation, accelerating profits, flat consumer. That is a data set that gives the hawks and the doves each something to hold, and gives traders no reason to size up before the close.
The Bond Market Is Pricing a December Hike, Not a Cut
Money markets are now fully pricing a Federal Reserve hike by December. Not a pause. Not a slower easing path. A hike.
That repricing has been building for weeks and it is the most under-discussed development in the market. The federal funds target sits at 3.50%–3.75% after a 9-3 hold on July 29, the fifth consecutive meeting without a move. The three dissents — Hammack of Cleveland, Kashkari of Minneapolis, and Logan of Dallas — were not calls for more accommodation.
The long end has been screaming about it. The 30-year Treasury yield topped 5.331% last week, its highest level since June 2007 and a 19-year peak. The 10-year touched 4.724%, and the 2-year reached 4.182%. Those are not levels consistent with an equity index near record highs, which is the tension underneath the entire August tape. Global government borrowing costs hit multi-year highs simultaneously, and the July U.S. fiscal deficit registered the largest monthly total since March 2021.
Two sessions of relief interrupted the selloff. Yields fell Monday and again Tuesday after reports that the Treasury Department could deploy its $1 trillion General Account to fund bond repurchases, pulling the 10-year down more than seven basis points to 4.625% and the 30-year to 5.2004%. Wednesday reversed part of it. Short-dated paper underperformed after the PCE print, which is the curve segment that responds to policy expectations rather than term premium.
The structural bid problem has not been solved. Buybacks funded out of the General Account address the flow, not the stock. Supply keeps coming, inflation refuses to close the gap to target, and the term premium keeps rebuilding. TLT slipped 0.41% on Wednesday's open, extending the pressure on anything duration-sensitive.
Friday brings the Jackson Hole keynote from Chair Kevin Warsh, his first as chair, with the symposium running August 27–29. Every rate expectation currently embedded in equity multiples runs through that podium. A chair who validates the market's December hike pricing puts immediate downward pressure on the 22x-plus multiple the S&P is carrying. A chair who pushes back extends the range. The bond market has already voted. Equities have not caught up.
Nvidia's $92 Billion Print and the $280 Billion Swing Options Are Pricing
Nvidia reports fiscal Q2 2027 results after the close, with the call at 5:00 PM Eastern. The quarter ended July 26. Consensus across forty analysts sits at $91.85 billion in revenue and $2.08 in adjusted EPS, with Visible Alpha compilations at $92.16–$92.2 billion, $2.09 in EPS, and $85.67 billion in Data Center revenue. Company guidance was $91.0 billion plus or minus 2%, putting the Street 0.9% above the midpoint of management's own forecast.
The year-ago comparison is $46.74 billion in revenue and $1.05 in EPS. Consensus asks for the business to roughly double in twelve months, and it asks with a market capitalization above $5.2 trillion already attached, which makes Nvidia the largest S&P 500 constituent by a wide margin. Guidance assumes zero Data Center compute revenue from China. Gross margin guidance sits near 75%.
Options price a 5.4% move in either direction, roughly $11.50 per share against Tuesday's $213.05 close, implying a range of $201.55 to $224.55 and about $280 billion in market value. That is a smaller implied move than the 6.5% priced before the May report and well below the 7.4% average realized post-earnings move across the last twelve quarters. Derivatives desks are explicitly saying the era of 10%, 15%, 20% earnings gaps is finished.
The stock enters the print up more than 13% in 2026 and roughly 8% below its May record above $236. Momentum has been negative: seven consecutive down sessions into Monday, the first such streak since 2022, snapped Tuesday with a 2.19% gain. Wednesday morning it traded down about 1.0% to 1.2%.
The margin question is live. Reports have circulated that customers were notified of potential price increases above 15% on some AI-server systems shipping in early 2027, driven by higher memory costs. Holding 75% gross margin while doubling revenue would settle the pricing-power debate. Slipping below it reopens every question about what happens when the hyperscaler capex cycle matures.
Nvidia has repeatedly delivered numbers without receiving the multiple expansion that would justify buying it into the print. That asymmetry is why the entire index sat still on Wednesday. The Q3 outlook, not the Q2 result, decides what Thursday's tape looks like.
Meta Writes a $16.68 Billion Check and the Stock Round-Trips
Meta Platforms agreed to pay a maximum of $16.68 billion to settle claims brought by 29 states alleging that Facebook and Instagram were designed to addict children, that the company misled consumers about platform safety, and that it improperly collected personal data from minors. The settlement landed mid-trial in the second week of a jury proceeding in federal court in Oakland before Judge Yvonne Gonzalez Rogers. Meta denied liability and denied wrongdoing in the filing.
The company's own accounting frames the number differently. Meta stated the agreement includes a payment of approximately $18 billion distributed in annual installments over ten years, with participating states receiving about $12.7 billion, or 70% of the total, over that period. The larger figure incorporates a settlement of claims tied to the Cambridge Analytica matter and a separate settlement with Texas. Meta expects to accrue a legal expense of approximately $10 billion.
The non-financial terms carry more forward risk than the cash. Meta commits to establishing daily usage limits and nighttime blocks for teenage users nationwide, enhanced age assurance measures to keep children off the platform or away from age-restricted content, restrictions preventing minors from disabling certain safety settings without parental consent, and additional parental control tools. An independent auditor will oversee compliance, issue recommendations, and report findings to the states. A judge still has to approve the agreement.
The price action told the whole story. Shares ripped as much as 4.1% after the open on the removal of a trillion-dollar tail risk, then gave it all back and traded down about 0.8% by 9:46 a.m., changing hands around $563.84 at one point, before stabilizing up 1.15% later in the morning. That round trip is the market pricing a settled liability against a permanently constrained engagement model for the under-18 cohort.
The read-through extends well past Meta. Snap, Alphabet's YouTube, and ByteDance's TikTok still face thousands of pending federal and state suits on substantially similar claims. Meta just established the benchmark: roughly $16.7 billion in cash plus structural product changes plus outside auditing. Every remaining defendant now negotiates against that anchor.
Intuit Gets Smoked on a Guide That Is Half Accounting Change
Intuit closed Tuesday's regular session at $357.46, down 3.37%, then fell as much as 11% after hours and traded at $315.60 in Wednesday's premarket, down 11.71%. The stock has lost close to 47% year to date.
The quarter itself was clean. Fiscal Q4 revenue came in at $4.35 billion against $4.27 billion consensus, up 14% year over year. Adjusted EPS hit $4.03 against a $3.59 estimate. Global Business Solutions revenue rose 14% to $3.4 billion, Online Ecosystem revenue climbed 17% to $2.6 billion. Net income was $363 million against $381 million a year earlier. The board approved a quarterly dividend of $1.38 per share payable October 16, a 15% increase.
The guidance is where it broke. Fiscal 2027 adjusted EPS was guided to $22.88–$23.12 against roughly $27.30 consensus. Q1 FY2027 adjusted EPS was guided to $2.44–$2.48 against $4.02. Revenue was set at $23.3–$23.5 billion, implying 9%–10% growth against $23.77 billion consensus and against 14% delivered in fiscal 2026.
A large piece of the EPS gap is definitional. Effective August 1, adjusted measures no longer exclude share-based compensation, an accounting change worth $5.81 per share of the apparent shortfall. Back that out and the guidance clears prior Street expectations. Mailchimp also moves to a separate reporting segment from Global Business Solutions.
The revenue deceleration is not an accounting artifact. Growth cut from 14% to 9%–10%, TurboTax units down 2% in the quarter, Mailchimp guided from flat to down 1%, and management publicly acknowledging mounting AI-driven competition with the possibility of price reductions to defend share. That last admission is what the 11% is actually paying for.
The balance sheet is not the issue. Intuit held $7.2 billion in cash and investments against $7.7 billion in debt at the end of July, repurchased $5.5 billion of stock across fiscal 2026, and retains $7.9 billion of authorization. It has the capital to fund a transition. What it has not shown is that the transition ends with the same growth rate on the other side.
Abercrombie Rips 29% While Zoom and Kohl's Get Sold
Beneath the frozen index prints, single-stock dispersion was violent. Abercrombie & Fitch ripped 29% after beating Q2 estimates and raising its full-year outlook — the largest move in the S&P universe and a direct contradiction of the discretionary-retail weakness that took Dick's Sporting Goods apart the previous session.
Summit Therapeutics led large-cap gainers on heavy volume, up 12.65% to $15.05 in premarket, delivering a concentrated biotech counterweight to the software selling. J.M. Smucker climbed 5.6% after beating on both sales and profit and raising fiscal 2027 sales and adjusted EPS guidance. SolarEdge added 8.3% on an upgrade to Buy with a price target lift to $42 from $36. The Williams Companies gained 5.6% on surging natural gas demand from AI data centers, solid results, and new power infrastructure projects.
The losers clustered in the same place as Intuit. Zoom Communications fell 6.2% to 7% after Q3 guidance of $1.46–$1.48 in EPS missed the $1.50 consensus, overshadowing what management described as its strongest enterprise growth in years and a Q2 beat. Kohl's sank 4.7% on comparable sales down 0.9% against a 0.6% expected decline, though it raised full-year guidance on $150 million in tariff refunds and restarted buybacks of up to $100 million for 2026. Moderna fell 5%, giving back a slice of a 150% surge tied to landmark oncology trial data.
The pattern across the entire earnings tape this week is one thing: guidance is running the stocks, and results are running nothing. Intuit beat and lost 11%. Zoom beat and lost 7%. Dick's grew its core comps 4.9% and lost 30.68%. Abercrombie raised and gained 29%. Kohl's raised and still fell because the comp missed.
Read More
-
Yen Stalls at 160 Despite a 3% JGB and Tokyo Core CPI at 2.0% — Intervention Sits at 164, Friday's Payrolls Decide
02.09.2026 · TradingNEWS ArchiveEnergy
-
QQQ ETF ($706.22) Slides 7.4% Below Its High as the Market Reprices the AI Capex Bill — $686.57 Target if $700 Breaks
22.10.2026 · TradingNEWS ArchiveStocks
-
XRPI ($7.00) and XRPR ($10.74) Slide Toward 52-Week Lows as Spot XRP ETF Flows Stall at $708,510
22.10.2026 · TradingNEWS ArchiveCrypto
-
NG ($2.775) Decoupled From Europe’s €88 Gas Crisis as LNG Feedgas Hits 18.9 Bcf/d — $3.30 Upside on Cold Weather
22.10.2026 · TradingNEWS ArchiveCommodities
-
Dollar-Yen (157.35) Loses 157.65 as the Yen Rallies on Haven Demand — 155 Target if 156 Breaks
22.10.2026 · TradingNEWS ArchiveForex
Tuesday's sector cash closes framed the rotation: Technology up 0.94%, Communication Services up 0.77%, Staples down 1.06%, Energy down 1.66%. Cyclical leadership with defensive laggards is not a risk-off configuration. It is a market rotating within risk, which is exactly what the Russell 2000's 0.15% to 0.50% outperformance on Wednesday morning confirms.
Nuclear and Uranium Rip on a Canada Trade Fight Nobody Priced
Oklo closed Tuesday at $44.22, up 11.41%, and traded around $45.00 on Wednesday after showing +11.54% to $44.27 in the premarket tape. The catalyst was not company-specific in the usual sense.
Ontario Premier Doug Ford warned that Canada should be prepared to cut off U.S. access to high-grade nickel and refined uranium produced in Ontario, home to Cameco's Blind River facility, the largest commercial uranium refinery in the world. Uranium spot prices jumped to a seven-month high, and a coordinated bid swept the entire domestic nuclear supply chain — Oklo, Cameco, NuScale, and the small modular reactor complex. Investors read a raw-material supply threat as a net positive for U.S.-domiciled SMR developers, which is a specific and somewhat aggressive interpretation of a trade dispute.
The company-level news reinforced it. Oklo's Groves Isotope Test Reactor reached first criticality on privately owned property under the DOE Reactor Pilot Program, arriving in under a year from groundbreaking. The balance sheet holds approximately $3 billion in cash and marketable securities against zero revenue. Roughly 14 GW of customer agreements, secured fuel, and a site use permit sit behind it. The stock was still down 44.69% year to date heading into Tuesday's move, and 52-week range runs from $36.61 to $193.84 against a market cap near $8.2 billion.
The trade backdrop escalated properly on Tuesday. Canada announced retaliatory tariffs covering roughly $20 billion in U.S. goods, effective September 8, hitting more than 700 product lines at rates from 15% to 50%, targeting steel, aluminum, dairy, and seafood. That followed additional 50% U.S. tariffs on Canadian motor vehicles, alcohol, and dairy.
Copper responded to the same pressure, surging to an all-time high of $6.71 with 675,185 tons sitting immobilized in U.S. warehouses on the tariff trade. Commodity dislocation driven by trade policy is now producing equity moves in supply-chain-adjacent names that have nothing to do with the underlying earnings, and it is happening in metals, uranium, and industrial inputs at once.
Crude Rolls Over Under $81 as the Iran Premium Bleeds Out
WTI front month traded at 81.39, down 0.97 or 1.18%, extending a slide that has become the cleanest directional trade on the board. Tuesday delivered the damage: WTI settled at $82.36 after losing 3.1%, and Brent dropped 3.9% to close at $88.58. Prices fell more than 5% across the week.
The driver is a shift in U.S. posture from military escalation toward economic pressure on Iran. Fresh sanctions landed on Iran and on so-called enablers that continue trading with Tehran. Simultaneously, Iran and Oman held talks about establishing a temporary joint shipping route through the Strait of Hormuz. That combination — sanctions instead of strikes, plus a negotiated shipping corridor — removes the tail risk that has been embedded in crude since spring.
The reversal is substantial. Oil climbed more than 20% in July alone as the Iran conflict flared, and that spike is the single largest reason headline PCE inflation ran 4.6% in Q1 2026 and 5.1% in Q2 2026 versus the 2.7%–2.9% range that prevailed through late 2025. Energy pushed inflation up, then relief pulled it down, which is exactly the goods deflation showing up in the July PCE detail as a 2.7% decline in gasoline and energy-related goods.
Brent slipping below $90 with WTI under $82 mechanically pulls the next two headline inflation prints lower if it holds. It also removes the strongest hawkish argument the December hike camp has been running. The catch is that the Hormuz situation remains contested and a single headline can reprice the entire complex overnight.
The equity read-through was immediate. Energy was the worst-performing S&P sector on Tuesday's cash close at −1.66% while Technology led at +0.94%. Cheaper crude compresses energy earnings, expands margins across transports and industrials, and takes pressure off the household spending line that just printed flat in real terms. The Energy Select complex is paying for a macro benefit that accrues to everyone else.
Bitcoin Holds $78,000 After a 23.6% Week and Gold Slips Under $4,680
Bitcoin traded at $78,541.25, down $691.48 or 0.87%, after showing $78,078.34 and −0.71% in the premarket. The consolidation follows the strongest weekly rally since March 2023 — a 23.6% surge that blew through $80,000 for the first time since mid-May.
The mechanics of that rally deserve scrutiny. Bitcoin advanced because investors positioned for financial conditions to become more supportive, and that positioning was heavily levered. If the assumption breaks, the same leverage that accelerated the move runs it in reverse with equal force. Wednesday's PCE print is precisely the kind of data that undermines the easier-conditions thesis: sticky inflation, a fully priced December hike, and short-dated Treasuries underperforming. That crypto held $78,000 against that backdrop is the constructive read. That it could not extend above $80,000 is the cautionary one.
Crypto-adjacent equities carried the same signal last week. Robinhood jumped almost 14% and Coinbase added 8% on Friday's session as bitcoin logged a 22% weekly advance and financials outperformed. Ethereum traded near $2,479.68.
Gold moved the opposite direction. The front-month contract sat at 4,679.00, down 15.50 or 0.33%, having earlier shown 4,682.80 and −0.25%. The setup into the data was explicit: a soft print sends gold toward $4,700, a hot print triggers profit-taking toward $4,600. The print came in hot on the headline, and gold took the downside path. The Dollar Index firming 0.13% to 99.03 did the rest.
Both moves are consistent with one macro conclusion. Sticky inflation with no policy response is not the same as sticky inflation with an easing bias. The first regime is bad for gold and bad for levered crypto because it means real yields stay elevated and the 30-year sits near 5.2%. The second regime is good for both. The July data pushed the market toward the first.
Broad Participation Is Better Than the Index Prints Suggest
The headline numbers say a flat, slightly negative session. The internals say something more constructive, and the divergence is the most useful thing on the tape.
The Russell 2000 outperformed all day, printing +0.15% at 3,014.60 against the S&P's −0.07%, and running as high as +0.50% in the first hour. Small caps outperforming on a day when yields ticked higher and a mega-cap tech event dominates positioning is not the behavior of a narrow, index-carried market. IWM ran +0.18% at the open against SPY at +0.12%, QQQ at +0.10%, and DIA flat.
Tuesday's advance was broad in the same direction: the Dow's third consecutive winning session on a 160.24-point gain, driven by falling yields rather than a handful of mega-caps, with the Nasdaq's 0.66% led by a semiconductor rally that repaired Monday's damage rather than extending a narrow leadership trade. The prior Friday saw the Dow add 517.80 points, or 0.98%, on healthcare strength with materials up 2% and financials contributing.
The dispersion within the session confirms it. Abercrombie +29%, Summit Therapeutics +12.65%, SolarEdge +8.3%, Williams +5.6%, Smucker +5.6%, Oklo +11.5%, against Intuit −11.71%, Zoom −6.2%, Moderna −5%, Kohl's −4.7%. Winners and losers of that magnitude on a session where the S&P moved five points means capital is rotating aggressively underneath a stationary surface. That is a functioning market, not a stalled one.
Where it gets uncomfortable is concentration risk in the one name nobody can hedge around. Nvidia at $5.2 trillion is the largest S&P constituent, and options price $280 billion of market value swinging on a single report. A 5.4% move in Nvidia alone moves the S&P 500 meaningfully regardless of what the other 499 names do. Breadth can be excellent and the index can still gap on Thursday because of one print.
That is the structural condition of this market. It is broad enough to survive a bad quarter from most companies, and not broad enough to survive a bad quarter from one.
Verdict: A Coiled Tape With Every Risk Stacked Behind the Close
This is a mixed session with a bearish macro undercurrent and a constructive market structure, and the verdict has to hold both.
The bearish case is in the data. Headline PCE at 3.7% missed to the upside and has not fallen in three months. Core at 3.3% has gone nowhere across four months. Real consumer spending went flat. Quarterly PCE price indexes were revised up 0.2 percentage point on both headline and core. Money markets fully price a Fed hike by December, the 30-year hit a 19-year high above 5.33% last week and still sits near 5.20%, and the July fiscal deficit was the widest monthly total since March 2021. An S&P 500 at 7,672.16 near record highs is not priced for a hiking cycle, and Friday's Jackson Hole keynote from Kevin Warsh is the event that either validates or defuses that repricing.
The constructive case is in the internals and the earnings. Corporate profits ripped $400.9 billion in Q2 against $74.4 billion in Q1. Real final sales to private domestic purchasers ran 3.9%. Nonresidential fixed investment climbed 8.5% and durable goods orders beat at 1.1% against 0.5%. Personal income rose 0.4% with the saving rate rebuilding to 3.0%. Crude rolled over with Brent under $90 and WTI at 81.39, which mechanically pulls the next two inflation prints lower. Small caps outperformed. Dispersion was wide in both directions.
The session verdict is mixed and coiled. The tape did not go anywhere because it cannot go anywhere until Nvidia posts against $91.85–$92.2 billion in revenue, $2.08–$2.09 in EPS, and $85.67 billion in Data Center revenue, and until the Q3 outlook lands. Options are underwriting a 5.4% move worth $280 billion, below the 6.5% priced in May and well under the 7.4% twelve-quarter realized average — which means the derivatives market is betting on a smaller move than history says is coming.
Levels to watch: 7,652.86 as the week's floor and 7,708 as the intraday ceiling from Monday's failed rally. A break below the first with a soft Nvidia guide opens the August range. A hold above the second with a beat and a raise puts the record high back in play by Thursday's open. Nothing between those two prints resolves anything.




