S&P 500 Ends 7,718.60, Nasdaq 26,50, Dow 53,414 — Wall Street Dark for Labor Day as Brent Hits $97.27
Friday's blowout jobs report flipped September from hold to hike | That's TradingNEWS
Key Points
- S&P 500 closed Friday at 7,718.60, down 0.38%, before Monday's full Labor Day closure.
- August payrolls hit 162,000 against 53,000 expected, pushing Fed hike odds to 58%.
- Brent traded $97.27 Monday, up 1.0%, after a 7.6% weekly gain on Iran tanker strikes.
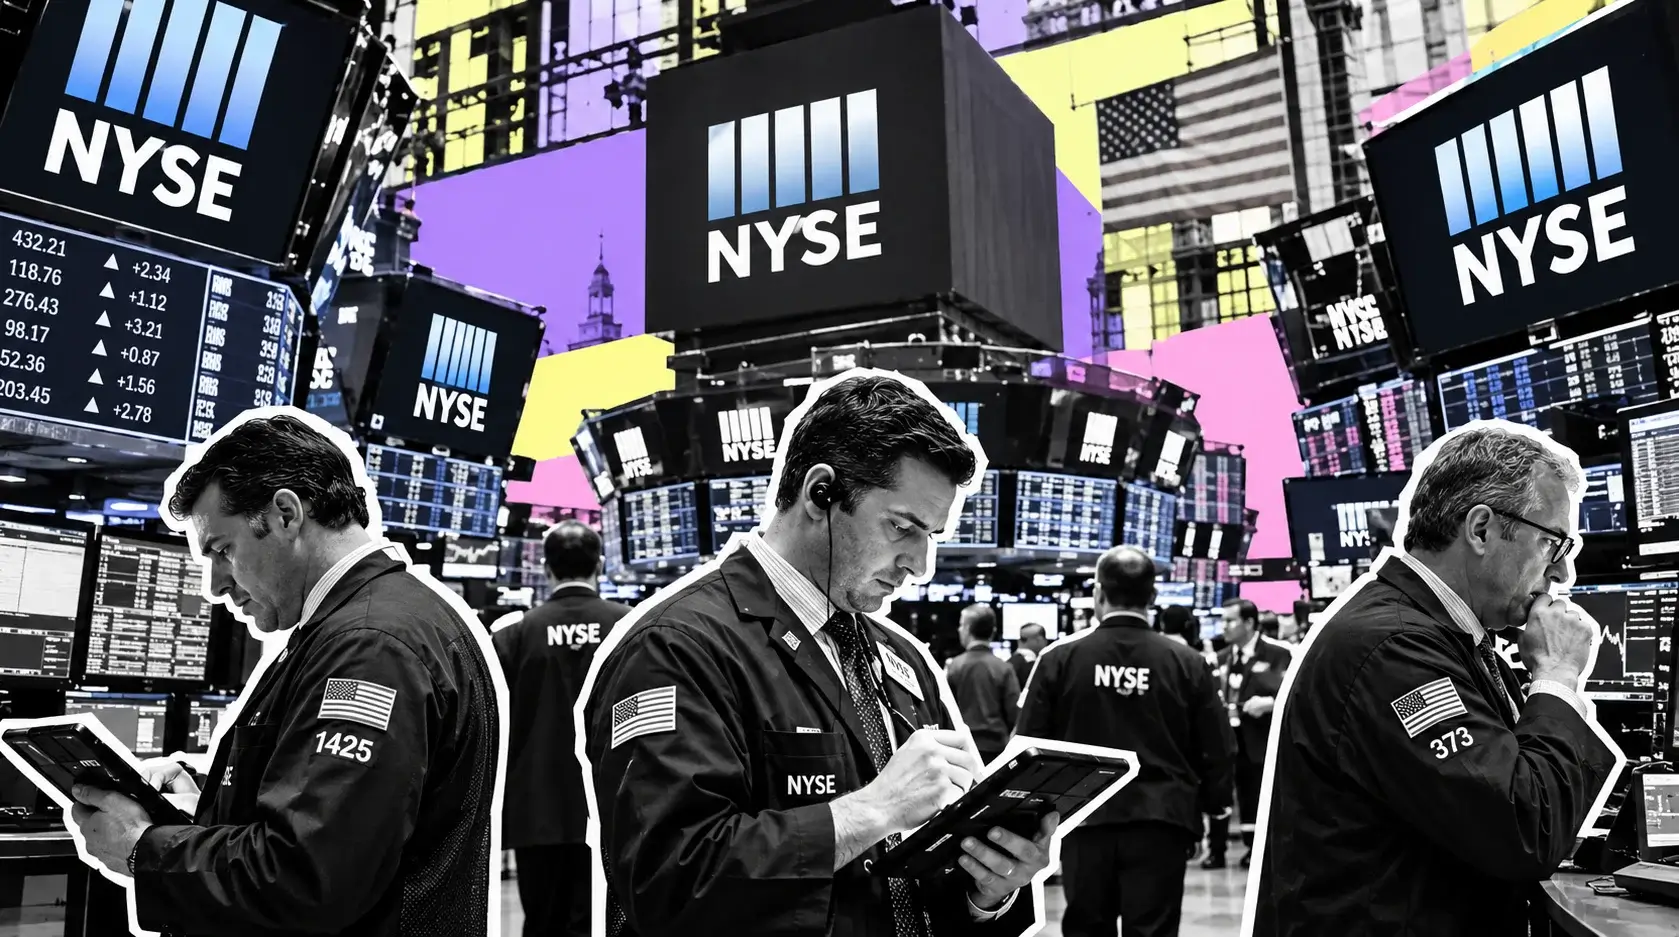
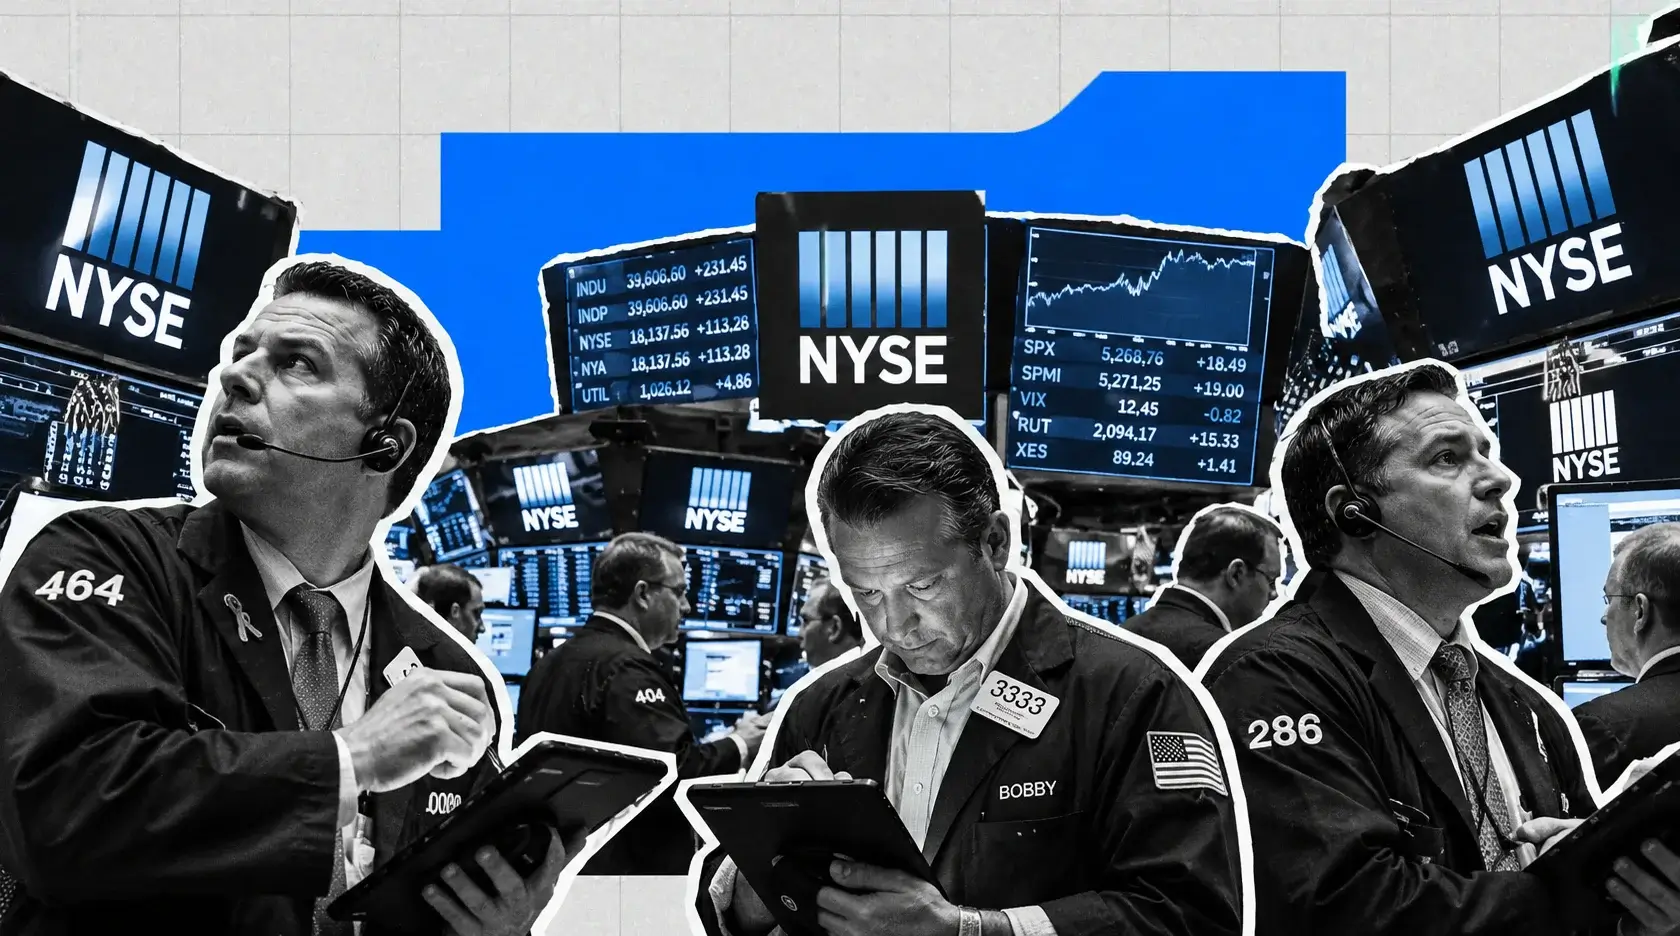
The opening bell never rang. The New York Stock Exchange and Nasdaq are shut Monday, September 7, 2026, for Labor Day, and the US bond market is closed alongside them, handing traders a three-day weekend before regular equity trading resumes Tuesday at 9:30 a.m. Eastern. That leaves Friday's tape as the last live read on American equities: the S&P 500 at 7,718.60, the Nasdaq Composite at 26,506.99, and the Dow Jones Industrial Average at 53,414.25 after a 271.86-point slide.
The pause lands at an awkward moment. A blowout August payrolls report dropped Friday morning and immediately rewrote the September playbook, flipping the argument from whether the Federal Reserve holds to whether it hikes. Yields ripped. Rate-sensitive corners of the tape rolled over. Then the market shut for three days with the repricing only half finished.
The thesis for this session is simple: the closure is not a break in the story, it is a delay in the settlement of it. Every input that moved Friday kept moving over the weekend without a US cash market to absorb it. The United States struck three Iranian oil tankers Saturday in retaliation for ballistic missile attacks on American warships. Iran hit back at US-linked vessels and signaled a restricted maritime zone beyond the Strait of Hormuz. Brent pushed to $97.93 at one point, its highest since July 24. Asian equities exploded higher on a semiconductor bid with no American counterpart to confirm it.
All of that has to discharge somewhere, and the only venue left is Tuesday's open.
The S&P 500 contract-for-difference proxy printed 7,712 on Monday, down 0.08% from Friday's settlement. That flat number badly understates the dispersion sitting underneath it. Holiday-thinned books do not price risk. They park it.
What makes this closure unusual is the calendar behind it. A four-session week runs straight into Friday's August CPI report, the last inflation read before the Federal Reserve decides on September 16. Fed funds futures put September hike odds at 58% after the payrolls print, up from 49.4% the prior day. The Fed is inside its pre-meeting blackout, so no official can steer the reaction. Four trading days, one inflation print, zero central-bank guidance, and a war premium rebuilding in crude — that is the setup traders walked away from Friday and walk back into Tuesday morning.
Friday's Close: S&P 500 Down 0.38%, Dow Off 271.86 Points, Nasdaq Holds Best
The final session before the long weekend was an orderly retreat, not a rout. The S&P 500 lost 29.11 points to finish at 7,718.60, a decline of 0.38%. The Nasdaq Composite gave back 0.29% to close at 26,506.99. The Dow took the worst of it, shedding 271.86 points, or 0.51%, to end at 53,414.25. The small-cap Russell 2000 was the lone holdout, adding 3.28 points for a gain of 0.1%.
That ranking matters more than the magnitude. On a day when the two-year Treasury yield hit its highest level since January 2025, the index most exposed to floating-rate debt and refinancing costs was the only one that closed green. Small caps are supposed to get smoked when the front end backs up. They didn't. That inversion of the expected reaction is the single most interesting structural detail in Friday's tape, and it deserves more attention than the headline percentages.
Weekly performance told a different story than the daily prints. The Dow finished the holiday-shortened week down 0.3%. The S&P 500 eked out a 0.1% gain. The Nasdaq added 0.4%. Three sessions of gains built on falling yields got mostly handed back in one session when the labor data hit.
The context leading in: the S&P 500 closed September 1 at 7,631.47 after a 0.71% drop, rebounded to 7,666.60 on September 2, then ran higher Thursday when Fed Governor Christopher Waller said he would be inclined to support keeping rates at the current 3.50% to 3.75% target range. Friday erased the enthusiasm without erasing the level.
Year to date the picture stays constructive. The S&P 500 is up 873.10 points, or 12.8%. The Dow has added 5,350.96 points for an 11.1% gain. The Nasdaq is higher by 3,265.00 points, or 14%. The Russell 2000 leads them all at 19.9%, up 493.74 points.
A 19.9% year-to-date gain in small caps against 12.8% in the S&P 500 is not the signature of a narrow, mega-cap-only market. It is the signature of a broadening tape that has been quietly rotating underneath the index headlines for months. Friday's session, where small caps held and mega-cap tech got sold, was that rotation showing up in a single day rather than a quarter.
The 162,000 Payroll Print That Flipped September From Hold to Hike
August nonfarm payrolls grew 162,000. Economists had penciled in 53,000. The unemployment rate held at 4.1%, matching expectations. Both June and July were revised upward, with July flipping from negative to positive.
The miss was not marginal. Actual job creation came in more than triple the consensus estimate. For a labor market that has spent most of 2026 described as low-hire and low-fire, a print of that size does not fit the narrative of gradual cooling. It fits the narrative of an economy that never actually slowed enough to justify the easing path that had been priced into the front end of the curve.
Fed funds futures reacted instantly. Odds of a September rate hike jumped to 58%, up from 49.4% the day before. Some measures put the number at 60% by Sunday. The Federal Reserve's next decision comes September 15-16, with the current target range at 3.50% to 3.75%.
The mechanics of why strong jobs data sank stocks are worth walking through, because the reflex reaction runs the other way. The Fed operates under a dual mandate: maximum employment and price stability. When the employment side is delivering 162,000 jobs a month and unemployment sits at 4.1%, the committee has room to lean on the price side. Chairman Kevin Warsh spent his Jackson Hole keynote in late August committing publicly to fighting inflation, and that speech alone moved hike probabilities from under 30% to the high forties. Friday's payrolls handed him the labor-market cover to follow through.
Thursday's rally on Waller's dovish comments now reads as a positioning error. Traders bought the idea that the September meeting was a hold. Friday's data made that a coin flip at best.
One demographic detail from the report stands out: women accounted for 158,000 of the 162,000 net positions added, with men contributing the remaining 4,000. The composition of hiring is skewed to a degree that raises questions about the durability of the headline, and it is the kind of internal that gets picked apart in the weeks between the print and the meeting.
The full data set is published by the Bureau of Labor Statistics at bls.gov/news.release/empsit.nr0.htm. The next employment report does not land until October, which leaves Friday's CPI as the last meaningful macro input before the committee votes.
Treasury Yields: 2-Year at 4.37%, 10-Year at 4.784%
The bond market did the actual work Friday. The two-year Treasury yield climbed to 4.37%, its highest level since January 2025. The 10-year finished at 4.784%, up from 4.762%. Both moves came directly off the payrolls print, and both are the reason equities closed red on a day when the economic news was objectively strong.
A two-year yield at 4.37% against a fed funds target of 3.50% to 3.75% is the front end pricing meaningful tightening ahead. That is not a market hedging a possible hike. That is a market positioning for one and building in the risk of a second.
The 10-year at 4.784% carries different information. Long rates have been elevated all summer, and the yield touched roughly 4.79% on September 1 during a global bond slide that dragged gold down 2.86% in a single session. The 10-year has been the binding constraint on equity multiples since Warsh's Jackson Hole speech, and every attempt to break decisively below 4.70% has been sold.
The curve dynamic is the part that gets under-discussed. With the front end at 4.37% and the belly at 4.78%, the spread has compressed but stays positive. If the Fed hikes in September and the long end refuses to follow, that spread flattens toward zero and the historical playbook for late-cycle equity performance turns unfriendly fast. Some strategists have argued the Fed should be willing to invert the curve deliberately, hiking above 5% to break inflation expectations before they de-anchor. That is a minority view, but it is being voiced openly, which is itself a signal about how far the debate has shifted since spring.
The international dimension adds pressure. Japan's 10-year government bond yield crossed 3% on September 1 for the first time in three decades, driven by fiscal concerns, a weak yen, and Bank of Japan tightening expectations ahead of the September 18 policy decision. When the world's largest source of carry-trade funding repricing higher, it pulls capital home and removes a bid from US duration.
The Treasury publishes daily par yield curve rates at home.treasury.gov. With the bond market closed Monday alongside equities, Tuesday's reopening carries two full sessions of accumulated geopolitical and energy news to price at once.
Lululemon Gets Smoked 17.38% After the Second Guidance Cut of the Year
Lululemon Athletica closed at $100.61, down 17.38% on the session. Intraday the stock traded as low as $100.55, a decline of 19.5% from Thursday's close. Volume hit 37.1 million shares against a three-month average of 3.37 million — more than eleven times normal turnover.
The catalyst was a guidance cut, the second consecutive quarter the company has lowered its outlook. Full-year revenue is now projected at $10.35 billion to $10.5 billion. Third-quarter guidance came in at $0.93 to $0.98 per share on revenue of $2.29 billion to $2.32 billion. Analysts had modeled $2.40 per share on $2.53 billion. The revenue miss against consensus is over $200 million at the midpoint, and the earnings gap is more than 60 cents.
The number that will define the story is the comparable-sales figure. Lululemon reported its first decline in comps since the pandemic. For a brand whose entire valuation premium rested on pricing power and full-price sell-through, a negative comp is a structural signal, not a quarterly stumble.
The stock's collapse pulled the athletic apparel complex into focus without dragging it down uniformly. Nike closed at $38.40, off 0.95%. Deckers Outdoor finished at $85.81, up 1.55%. That split is instructive: the market treated Lululemon's problems as company-specific rather than category-wide. Deckers rallying on a day its closest premium-brand comparable dropped 17% is the tape saying share is being taken, not that demand has evaporated.
Lululemon went public in 2007 and has returned 704% since the IPO. Friday's session erased a meaningful chunk of that on a single print, and the shares now sit near the century mark after trading above $120 the day before.
The turnaround now falls to a new CEO. The question the market will be asking through the fourth quarter is whether the guidance reset is conservative enough to be beaten or whether the second cut is simply the second of several. Retailers who cut twice in two quarters have a poor track record of stopping at two.
For the broader index, Lululemon is a small weight. For the read on the American consumer heading into the holiday quarter, it is a data point that arrived on the same day the labor market printed 162,000 jobs — strong employment, weakening discretionary spend at the premium end. Those two facts sit uncomfortably together.
Fair Isaac Drops 15.97% as Washington Turns on Credit-Score Pricing
Fair Isaac closed at $940.20, down $178.73 for a loss of 15.97%. The trigger came from Washington, not from the company: the Federal Housing Finance Agency publicly criticized FICO's pricing on social media, and the stock fell apart within hours.
The move is a reminder of a risk that does not show up in a discounted cash flow model. Fair Isaac operates something close to a regulated monopoly on consumer credit scoring in mortgage underwriting. That position has generated extraordinary pricing power and margins for years. It also makes the company permanently exposed to a single counterparty risk — the federal government deciding the pricing is excessive.
A 15.97% single-day drop on a regulatory comment rather than an earnings miss tells you how much of the equity value was riding on the assumption that the arrangement stays untouched. When a $178 move happens on a tweet, the market is repricing the durability of the moat, not the next quarter's numbers.
The two largest single-name declines in the S&P 500 on Friday were Fair Isaac at -15.97% and Lululemon at -17.38%. One got hit by consumer weakness, the other by regulatory attention. Neither had anything to do with the payrolls report that supposedly drove the session. That is the kind of dispersion that shows up when the index-level move is small but the underlying tape is churning.
Outside the large caps, the extremes were wider. CDTG ripped 43.27% to lead all US-listed gainers. BANL was the worst performer, down 39.47%. Small-cap percentage moves of that size on the Friday before a holiday weekend usually reflect thin liquidity as much as news flow, and both names carry the volume profile to support that reading.
Adobe also sold off after announcing that Anil Chakravarthy will take over as president and chief executive effective December 1, succeeding Shantanu Narayen. The transition arrives while the company faces open questions about whether generative AI erodes the value of its creative software suite. A CEO handoff in the middle of a strategic threat is not the timing shareholders would have chosen, and the stock's reaction reflected that. Adobe reports earnings Thursday, which puts the new leadership question directly in front of the market this week.
Memory and AI Silicon Ripped While Mega-Cap Tech Rolled Over
Underneath a 0.29% Nasdaq decline, the semiconductor complex had one of its better sessions of the quarter.
Sandisk ripped 11.17%, adding $173.62 to close at $1,728.61. Micron Technology gained 4.74%, up $45.46 to $1,003.62 and holding above the four-figure mark. Cerebras Systems jumped 11.89%, adding $22.63 to finish at $213.08. Bloom Energy, a power-infrastructure play increasingly traded as an AI derivative, rose 7.35% to $252.87 on a $17.32 gain.
Memory pricing has been the strongest fundamental story in semiconductors this year, and Friday's move extended it. High-bandwidth memory demand tied to AI accelerator builds has tightened supply across DRAM and NAND, and both Sandisk and Micron are direct beneficiaries. A double-digit percentage move in Sandisk on a red tape day is the market paying up for the cleanest exposure to that shortage.
The mega-caps went the other way. Apple fell 2.55%, Alphabet dropped 2.10%, and Microsoft lost 2.05%. Those three names carry enough index weight that their combined drag explains the bulk of the S&P 500's 29.11-point decline on its own. Strip them out and the broad market closed close to unchanged.
On the Dow side, the industrials held up. Caterpillar rose 1.65%, Honeywell added 0.95%, and Home Depot gained 0.88%. The index still lost 271.86 points, which tells you the damage came from its tech-adjacent components rather than the cyclical core.
The split is the same one that has defined the tape since June. The PHLX Semiconductor Index remains far higher on the year but well below its June peak, while software names like Snowflake, Palantir, and Salesforce have rebounded since July from sharp losses earlier in 2026. Capital has been rotating within technology rather than out of it, and Friday was another clean example: memory and AI infrastructure bid, platform mega-caps sold.
That rotation has a rates component. Long-duration platform equities carry the most sensitivity to a 10-year at 4.784%. Semiconductor names with visible near-term pricing power carry less. When the two-year backs up to its highest level since January 2025, the market discriminates between growth you get in 2027 and revenue you can see in the next two quarters. Friday's dispersion was that discrimination in action.
Brent Near $97 and WTI Near $92 as the War Premium Rebuilds
Crude is where the weekend actually happened.
The United States targeted three Iranian oil tankers over the weekend in retaliation for ballistic missile attacks on US Navy warships. Tehran responded by striking oil tankers and other vessels linked to the United States and signaling it will introduce a restricted maritime zone beyond the Strait of Hormuz in the coming days. Energy Secretary Chris Wright said the US will maintain its naval presence in the region, including the blockade designed to curb Iranian oil exports.
Prices moved accordingly. WTI traded at $91.98 per barrel Monday morning against Friday's official settlement of $91.48, a gain of 50 cents or 0.5%. The front month is the October 2026 contract. Brent traded at $97.27 versus Friday's $96.28 settlement, up 99 cents or 1.0%. Brent touched $97.93 overnight, its highest level since July 24.
Last week alone WTI gained close to 10% and Brent added 7.6%, the strongest weekly performance since July. Over the past four weeks Brent is up 10.63%. Over twelve months it has climbed 46.99%.
OPEC+ offered no relief over the weekend, leaving October output policy unchanged while members work toward new production quotas. With the cartel standing pat and Hormuz transit under active threat, the supply side has no obvious release valve.
The forecast range is unusually wide. Goldman Sachs has flagged $120 per barrel if attacks on Middle Eastern shipping intensify, against roughly $80 if regional exports normalize. That is a $40 spread on the same commodity depending entirely on naval outcomes, which is not a variable any energy analyst can model.
The Energy Information Administration's August Short-Term Energy Outlook projected Brent averaging $85 per barrel in the third quarter, falling to $78 by the fourth quarter and $69 across 2027, on the assumption that Hormuz traffic gradually increases and shut-in production restarts. Brent at $97.27 is running $12 above that third-quarter forecast. The next STEO update publishes September 9 at eia.gov/outlooks/steo, and a revision higher is the base case.
The inflation transmission is already visible. Diesel has hit a record $5.85 per gallon. That feeds directly into transportation costs, food prices, and the goods componentof CPI — three days before the August CPI report lands.
Read More
-
Yen Stalls at 160 Despite a 3% JGB and Tokyo Core CPI at 2.0% — Intervention Sits at 164, Friday's Payrolls Decide
02.09.2026 · TradingNEWS ArchiveEnergy
-
QQQ ETF ($706.22) Slides 7.4% Below Its High as the Market Reprices the AI Capex Bill — $686.57 Target if $700 Breaks
22.10.2026 · TradingNEWS ArchiveStocks
-
XRPI ($7.00) and XRPR ($10.74) Slide Toward 52-Week Lows as Spot XRP ETF Flows Stall at $708,510
22.10.2026 · TradingNEWS ArchiveCrypto
-
NG ($2.775) Decoupled From Europe’s €88 Gas Crisis as LNG Feedgas Hits 18.9 Bcf/d — $3.30 Upside on Cold Weather
22.10.2026 · TradingNEWS ArchiveCommodities
-
Dollar-Yen (157.35) Loses 157.65 as the Yen Rallies on Haven Demand — 155 Target if 156 Breaks
22.10.2026 · TradingNEWS ArchiveForex
Asia Explodes Higher and Europe Drifts: The Tape Without America
With Wall Street closed, the rest of the world traded the weekend news on its own.
Asia went risk-on hard. South Korea's Kospi surged 4.61%, opening up 3.09% and extending through the session. Japan's Nikkei 225 closed 2.12% higher. Mainland China's CSI 300 gained 0.59% to finish at 4,575.02. Australia's S&P/ASX 200 ended marginally higher at 9,010.90. Hong Kong's Hang Seng was the outlier, down 0.85% in late trade.
The leadership was almost entirely semiconductors. Samsung Electronics rose 5.68% and SK Hynix jumped 8.26%, the two heavyweights that drove the Kospi's outsized gain. In Japan, SoftBank advanced 11.22% and Advantest added 4.20%. The same memory and AI-infrastructure trade that lifted Sandisk and Micron on Friday in New York went vertical in Seoul and Tokyo on Monday with no American market to arbitrage against it.
An 8.26% move in SK Hynix and an 11.22% move in SoftBank are not incremental repricings. They are the kind of gaps that force US-listed comparables to open away from Friday's close, whether or not any American news justifies it.
Europe was flat and directionless by comparison. The pan-European Stoxx 600 traded just below the flatline in early afternoon dealings. Germany's DAX led the declines, sliding 0.38%. The UK's FTSE 100 reversed morning losses to trade 0.18% higher. France's CAC 40 sat just above unchanged, and Italy's FTSE MIB was down close to 0.1%.
Sector positioning in Europe followed the crude bid precisely. Oil and gas stocks led early gains, rising 1.14%, while technology names added 0.55% and utilities lagged. That is the energy-inflation trade expressed cleanly: producers bid, rate-sensitive defensives sold.
The divergence between Asia's 4.61% Kospi rally and Europe's flat Stoxx 600 is the informative part. Asian markets traded the semiconductor cycle. European markets traded the energy shock and the European Central Bank's rate decision Thursday, where policymakers are widely anticipated to hike as the Middle East war keeps imported inflation elevated. Two continents, two entirely different readings of the same weekend.
American investors get to reconcile both at Tuesday's open.
Futures at 7,712 and the Gap Risk Into Tuesday's Reopen
The S&P 500 proxy contract printed 7,712 on Monday, down 0.08% from Friday's cash close of 7,718.60. Six and a half points. On a day when Brent added a dollar, the Kospi gained 4.61%, and the US Navy engaged Iranian shipping, a 0.08% move in the equity proxy is not a signal. It is an absence of participants.
Holiday sessions in index futures run on skeleton liquidity. Bid-ask spreads widen, depth thins out, and a modest order can move the screen more than the underlying news warrants. The 7,712 print should be read as a placeholder rather than a forecast.
Volatility gives a cleaner read. The VIX finished at 14.52, up 1.40% from 14.24. That is elevated relative to the prior session but remains firmly inside a low-volatility regime. Traders bought a modest amount of downside protection ahead of the three-day gap and stopped there. Nobody paid up for crash insurance.
That combination — flat futures, contained volatility, and a genuinely active geopolitical situation — describes a market that has decided the Iran conflict is a commodity story rather than an equity story. That framework has held since the war began in late February. It has been tested repeatedly and has not broken. The risk is that it is a framework rather than a hedge, and frameworks fail without warning.
The specific gap risk into Tuesday concentrates in three places. Semiconductors have to reconcile with an 8.26% move in SK Hynix and a 5.68% move in Samsung. Energy equities have to price Brent 1% higher with a restricted maritime zone pending. And rate-sensitive sectors have to absorb two full sessions of accumulated positioning with the bond market reopening at the same moment.
Cyclicals carry the widest potential dislocation, because they sit at the intersection of the crude bid and the yield backup. Higher energy input costs compress margins. Higher funding costs compress multiples. Both arrive Tuesday morning simultaneously.
The Bitcoin tape, which never closed, offers a partial read on weekend risk appetite. Bitcoin traded at $79,333 Monday, up 1.25%, after finishing Friday at $80,076.08 with a 0.76% gain. Ethereum closed Friday at $2,479.28, up 1.38%. XRP finished at $1.42, higher by 1.81%, and Solana at $103.85, up 2.56%. Crypto held its bid across the weekend strikes without extending. That is a market absorbing news, not fleeing it.
Gold Near $4,500 With a Hawkish Fed Capping the Safe-Haven Bid
Gold traded near $4,500 an ounce Friday after rising for two consecutive sessions, having climbed to around $4,470 on Thursday as the dollar and Treasury yields retreated on Waller's dovish comments.
The metal's behavior this week captures the tension defining the entire macro setup. Gold has every geopolitical reason to run: an active naval conflict in the Persian Gulf, a chokepoint threat on 20% of global seaborne oil, and energy prices feeding straight into inflation expectations. It also has every monetary reason to stall: a Fed with 58% odds of hiking, a two-year yield at its highest since January 2025, and real rates grinding higher.
Those forces have been fighting to a draw. On September 1, the rate side won decisively — gold fell 2.86% to $4,325 while silver dropped 3.73% to $64.13, both crushed by a global bond slide that pushed the 10-year toward 4.79% and by hike odds that briefly reached 70%. By Thursday the safe-haven side had clawed back to $4,470. Friday's payrolls print pushed hike probability back toward 60% without knocking gold off the $4,500 handle.
That resilience is the interesting part. Bullion holding near $4,500 while the front end prices tightening suggests structural demand that is not rate-sensitive. Central banks across Asia and the Middle East have been diversifying reserves into physical gold and reducing dollar-denominated holdings, a multi-decade allocation shift that does not react to a 25-basis-point meeting. That bid puts a floor under corrections that technical models built on real yields alone will keep missing.
The dollar side reinforces the setup. The greenback and Treasury yields fell sharply after Waller's remarks Thursday, supporting bullion, then reversed Friday when payrolls hit. The currency has become a pure function of the September meeting.
For Tuesday, gold's reopening carries the weekend's escalation with no dollar move to offset it, since the currency market's holiday liquidity was as thin as everything else. The immediate question is whether $4,500 holds as support or acts as resistance. If crude keeps pushing toward $100 Brent and CPI runs hot Friday, the inflation-hedge argument and the rate-hike argument both strengthen at once — and gold has to pick which one it believes.
Breadth, Leadership, and the Small-Cap Tell
Friday's internals contradicted the headline in a way that changes the read on the session.
Three mega-caps — Apple down 2.55%, Alphabet down 2.10%, Microsoft down 2.05% — accounted for the overwhelming majority of the S&P 500's 29.11-point decline. Two single names, Lululemon at -17.38% and Fair Isaac at -15.97%, delivered idiosyncratic damage that had nothing to do with macro. Outside of those five, the tape was close to flat.
The Russell 2000's positive close is the load-bearing detail. Small caps carry the highest exposure to floating-rate debt and near-term refinancing. A move in the two-year to 4.37%, the highest since January 2025, should have hit them hardest. Instead they finished up 3.28 points while every large-cap index closed red. The index is also up 19.9% year to date against the S&P 500's 12.8%, so this is not a one-session anomaly — it is a trend that has been running for months.
Two explanations compete. The first is that small caps are being bought as a domestic-revenue hedge against a war-driven energy shock and a strong dollar, both of which hurt multinational earnings more than domestic ones. The second is that the market is pricing an economy strong enough to support small-cap earnings growth even at higher funding costs, which is exactly what a 162,000 payroll print implies.
Both readings point the same direction: the market is not treating a potential September hike as a growth threat. It is treating it as a valuation adjustment concentrated in long-duration mega-cap equities.
Sector leadership backs this up. The industrial complex held firm, with Caterpillar up 1.65%, Honeywell up 0.95%, and Home Depot up 0.88%. Capital spending tied to electricity capacity, AI infrastructure buildout, defense, and energy has been supporting industrials and materials all year, and none of that spending gets cancelled by a quarter-point move in fed funds.
Financials have been seeing upward earnings revisions from a steeper yield curve and solid net interest income. Utilities have started to underperform after a strong run pushed valuations higher. Consumer discretionary remains the weakest sector year to date, which Lululemon's collapse only underscored.
Breadth this constructive under a red index print is a bullish structural signal disguised as a losing session.
August CPI on Friday Is the Only Print That Matters
Everything this week routes through one data release.
August CPI publishes Friday, September 11, at 8:30 a.m. Eastern. It is the last inflation read before the Federal Reserve decides on September 16, and the committee is inside its blackout period, so no official can shape expectations between now and then. The report lands with unusual weight because the market's hike probability sits close to a coin flip at 57% to 60%, meaning a surprise in either direction moves rates hard.
The print itself is split by construction. Headline inflation is expected to run hot at 0.4% month over month, driven by energy, against a benign core reading of 0.2%. Which line the market chooses to trade decides the week. A market focused on headline sees crude at $97 Brent, diesel at a record $5.85 per gallon, and an energy shock feeding through — and prices a hike. A market focused on core sees underlying pressures contained and prices patience.
Producer prices land Thursday, September 10, alongside core PPI and August existing home sales, and function as the preview. Pipeline pressure showing up at the producer level ahead of Friday would front-run the CPI reaction and put yields under pressure a day early.
The European Central Bank decides Thursday as well and is widely expected to hike, with policymakers watching a war that began with the joint US-Israeli assault on Iran in late February and has driven energy prices sharply higher across the continent. A European hike hours before US PPI adds a second transmission channel into Treasury yields.
The Fed's current target range is 3.50% to 3.75%. Warsh has been explicit that delivering stable prices is the central bank's job, a position he reinforced at Jackson Hole and one that Chicago Fed President Austan Goolsbee has publicly agreed with, identifying inflation as the primary problem. Against that, Waller said Thursday he would favor holding if price pressures continue easing. The committee is genuinely split, and Friday's data decides the argument.
The FOMC calendar and post-meeting materials are published at federalreserve.gov/monetarypolicy/fomccalendars.htm. Four trading sessions separate the reopen from the print, and positioning into it will dominate flows Tuesday through Thursday.
Oracle, Adobe and Apple: Corporate Catalysts in a Four-Day Week
The earnings calendar is light but concentrated in names that carry outsized narrative weight.
Casey's General Stores reports Tuesday. Chewy follows Wednesday. The week's substance arrives Thursday, when Oracle, Adobe, and Macy's all report, and closes Friday with Kroger.
Oracle is the marquee event. Consensus sits at $1.74 per share on $19.13 billion in revenue. The stock enters the print down close to 20% in 2026, with the decline driven less by execution than by balance-sheet anxiety over the debt the company has taken on to finance aggressive data-center expansion. The bull case is that Oracle has secured a durable position in AI infrastructure capacity. The bear case is that it has levered up to rent out compute at margins that compress as supply arrives. Thursday's report, and specifically the commentary on capital expenditure and backlog conversion, adjudicates between them.
Adobe reports the same day, days after announcing Anil Chakravarthy takes the CEO role December 1. The company faces open questions about whether generative AI erodes demand for its creative suite, and a leadership transition mid-threat gives the market one more variable to discount.
Apple holds its annual product event Wednesday. The company is expected to unveil the iPhone 18 Pro and Pro Max along with what could be its first foldable device, under new chief executive John Ternus. Reports point to a significant form-factor change and meaningful price increases. Apple fell 2.55% Friday, the largest drag on the S&P 500, which sets a low bar for the event to clear.
The macro-corporate interaction is what makes this week tricky to position. If Apple announces price hikes on Wednesday and CPI runs hot on Friday, the market gets a consumer-electronics inflation story and a data confirmation within 48 hours. If Oracle's capex guidance runs above expectations Thursday, the AI infrastructure trade that lifted Sandisk 11.17% and SK Hynix 8.26% gets validated at the exact moment rates are pressuring long-duration growth.
Two catalysts pulling in opposite directions inside four sessions, with the Fed silent throughout.
Verdict: A Holiday Pause Inside a Hawkish, Energy-Driven Tape
The session verdict is mixed with a hawkish tilt, and the underlying structure is more constructive than the headline numbers admit. There is no US close to grade today — the NYSE and Nasdaq were dark for Labor Day, the bond market with them, and the S&P 500 proxy's 0.08% drift to 7,712 carries no information. What can be graded is the tape traders left behind and the one they are walking into. Friday closed red across the majors: S&P 500 at 7,718.60 down 0.38%, Nasdaq at 26,506.99 down 0.29%, Dow at 53,414.25 down 271.86 points. But the damage was narrow. Three mega-caps and two blown-up single names did nearly all of it, while the Russell 2000 closed green with the two-year at 4.37% and industrials held firm. That is not distribution. That is rotation out of long-duration mega-cap equity into everything else, and it has been running all year — small caps up 19.9% against the S&P 500's 12.8%. The bearish inputs are real and they are concentrated in two places: rates and crude. A 162,000 payroll print against 53,000 expected pushed September hike odds to 58%, the front end is pricing tightening, and Brent at $97.27 with diesel at a record $5.85 per gallon is an inflation impulse the Fed cannot ignore three days before CPI. Tuesday's reopen carries genuine gap risk, with SK Hynix up 8.26% and the Kospi up 4.61% forcing US semiconductors to mark higher while energy costs and funding costs squeeze cyclicals from both sides. The equity market has spent six months treating the Iran conflict as a commodity story rather than an equity story, and that framework has held through every escalation including this weekend's tanker strikes. Until it breaks, the base case into Friday's CPI is a choppy, dispersed tape with strong internals, contained volatility at a 14.52 VIX, and leadership rotating hard between memory semiconductors and industrial capex names. Bulls own breadth, earnings, and a labor market printing triple the expected job creation. Bears own the two-year yield, a $97 barrel, and a central bank that has told the market plainly it intends to fight inflation. Friday's 8:30 a.m. print decides which side gets paid.