





The XRP Fund Complex Has Taken $1.51B And Holds $964M
Monthly flows fell 79% from $131.94M in May to $27.29M in July while 3 funds hold 82% of assets | That's TradingNEWS
Key Points
- XRPI at $5.87 and XRPR at $8.75, both through their June floors; XRPC $11.36, GXRP $20.73
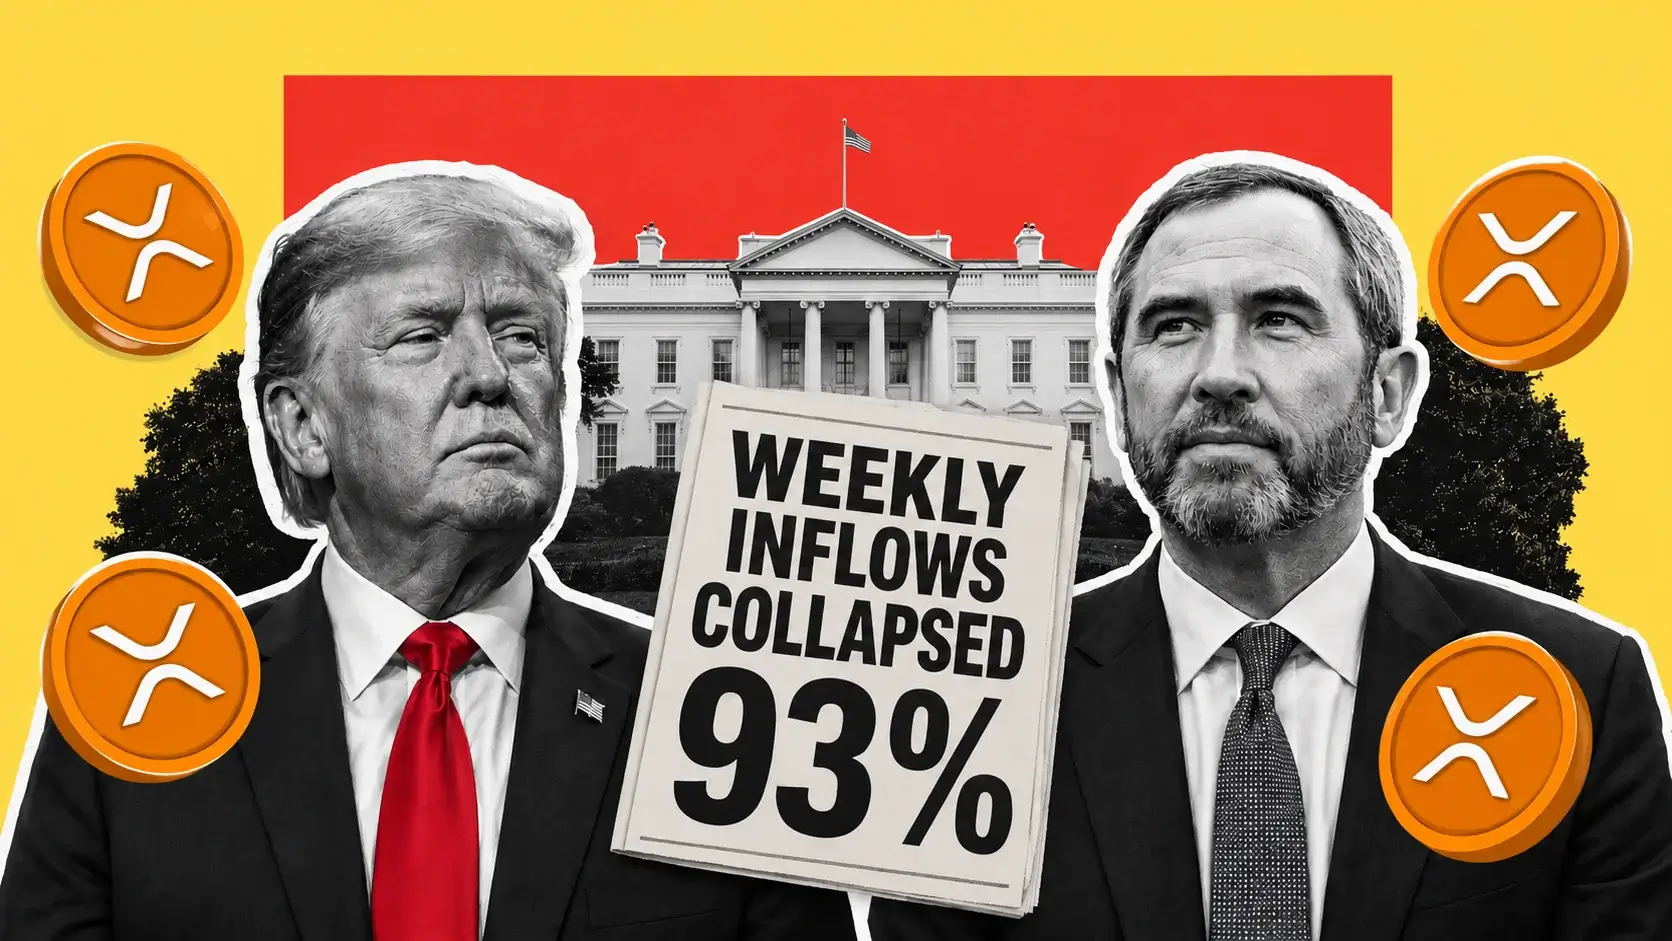
- Weekly inflows collapsed 93% to $1.01M; net assets fell to $964.21M from $988.78M
- Cumulative inflows hit $1.51B, meaning $546M of investor capital was erased by price
The XRP fund category has become the clearest demonstration in crypto that inflows and price are separate variables. XRPI trades at $5.87 after breaking its $6.50 June floor and losing 23% across four months on daily-reset drag. XRPR trades at $8.75 against a prior close of $8.63, having gone through its $9.50 floor.
The rest of the roster: XRPC at $11.36, XRPZ at $11.62, GXRP at $20.73. Every product in this complex sits at or near its all-time low.
Those quotes were set against a token at $1.07 to $1.08. XRP has since fallen further, printing a low near $0.99 on August 11 — the first sub-dollar trade in two years — before recovering to $1.0211 with a market capitalization of $64.00 billion.
The macro print supplied nothing. Headline CPI slowed to 3.4% year-over-year with core at 2.5%, both matching consensus, per the July 2026 CPI release. XRP held close to $1.02 with minor fluctuation through the release.
The thesis is a category that has done everything right operationally and been destroyed by the underlying. US spot XRP ETFs took in only $1.01 million over the week ending August 8 — a 93% collapse from the $14.86 million the funds pulled the prior week — with net assets sliding to $964.21 million from $988.78 million. The complex is the weakest performer among major crypto fund categories tracked this month.
Cumulative net inflows since the November 2025 launch stand at a record $1.51 billion. Net assets sit at $964.21 million.
That gap is $546 million of investor capital erased by price while sitting inside a regulated wrapper. Money kept arriving while the asset kept falling.
The reference levels: XRPI's path back to $7.60 and XRPR's to $11 both require the token reclaiming $1.11 at the 50-day moving average and then $1.36 at the 200-day. Below $1.00, both funds set fresh lows.
The 93% Collapse And What Came Before It
The weekly flow print is the most damning single datapoint available on this category.
Inflows totaled $1.01 million for the week ending August 8 against $14.86 million the prior week. Net assets slipped to $964.21 million from $988.78 million.
Technically that was the fourth consecutive week of net inflows, which is the only positive framing available. The daily breakdown shows how thin it was: a $3.58 million outflow on August 5, zero net flow on August 4, and a $3.45 million inflow on August 6 — the strongest day of the run.
The comparison across the crypto fund complex on the same week is brutal. Bitcoin ETFs swung from a $61.53 million outflow to a $754.69 million inflow — an $816 million turnaround. Ethereum funds pulled in $195.34 million, close to seven times the prior week's $27.42 million.
XRP took $1.01 million. Against Bitcoin's $754.69 million, that is 0.13% of the flow going into the largest category.
The monthly trajectory frames the deterioration properly. Flows have decelerated from $131.94 million in May to $59.46 million in June to $27.29 million in July — a 79% decline from the peak. July's three final weeks delivered $6.78 million, $8.15 million and $14.86 million, and the month ranked as the second-weakest since January.
May was the strongest month of 2026 and produced no single outflow day across the entire month. That display of persistent demand coincided with XRP falling 7% to $1.20.
The 2026 contribution to cumulative flows measures $329 million, averaging $55 million monthly across six months. Everything else was raised in the first two months after the November 2025 launch, when products came to market on the back of the resolved SEC case and generic listing standards issued in September 2025.
December 2025 was the peak of the divergence: XRP funds absorbed roughly $483 million while Bitcoin and Ethereum ETFs suffered large net redemptions. That is when the category was called crypto's new darling.
The first stress event landed January 7, 2026 with a $40 to $41 million net outflow day, nearly all from a single product taking a $47.25 million redemption.
$1.51 Billion Went In And $964 Million Is Left
The arithmetic of this category is the cleanest illustration of what a falling underlying does to a fund complex.
Cumulative net inflows across the seven funds stand at $1.51 billion. Total net assets sit at $964.21 million. Net flows have been positive on the vast majority of sessions since launch.
That is not capital that left. It is capital that entered, stayed, and lost about a third of its value inside a regulated wrapper.
The funds collectively hold approximately 978 million XRP — under 2% of total supply. At an earlier measurement the complex locked more than 800 million tokens with $1.4 billion in assets, and at the peak more than 500 million XRP sat inside ETF structures representing roughly 1.16% of the token's market cap.
At $964.21 million against a $64.00 billion market capitalization, the complex now holds 1.5% of XRP's value.
Compare that penetration across the asset class. Bitcoin's ETF complex holds $77.6 billion against a $1.33 trillion market cap — 5.8%. Ethereum's holds roughly $18 billion against $233 billion — 7.7%. Solana's holds $906 million against $44 billion — 2.1%.
XRP's wrapper is the shallowest relative to its own market among the four, despite $1.51 billion of cumulative creations.
The structural change that made the category possible was regulatory. The long-running SEC case was dropped in August 2025, removing the single largest binary risk that kept large capital pools away from the asset. Within three months, spot XRP ETFs listed in the US and other major venues, giving institutions a regulated way to hold exposure in size without touching wallets, exchanges or custody workflows.
Investors are no longer being paid to take legal risk. They are being paid to take market, volatility and product-structure risk.
That trade has not worked. XRP was down 41.51% year-to-date at $1.07 to $1.08 and roughly 70.55% beneath its all-time high before falling to $1.0211.
Seven products now trade in the United States. Six offer spot exposure — the NYSE Arca-listed Bitwise fund under the XRP ticker, XRPC on Nasdaq, XRPZ, GXRP, XRPR and TOXR — alongside a broader index vehicle. Custody sits with two institutional providers.
Three Funds Hold 82% Of The Assets
Concentration defines this category and it is worse than the headline suggests.
Bitwise leads with $510.21 million of cumulative inflows and $312.82 million of assets — 33% of the category total. Canary's XRPC holds roughly $250 million on $468.12 million of inflows, or 31%. Franklin Templeton's XRPZ carries roughly $254 million on $426.53 million of inflows.
Three funds hold 82% of assets.
The remaining four products divide 18% of $964.21 million — approximately $173 million across GXRP, XRPR, TOXR and the index vehicle. That is an average of $43 million per fund, well below the threshold at which an ETF is economically viable for its issuer.
The failures inside the roster are specific. Grayscale's GXRP has given back more than half its $131.46 million of cumulative inflows. The 21Shares TOXR has never been cumulatively positive.
A product that has never recorded positive cumulative flows nineteen months after launch is a candidate for closure. The Bitcoin category already produced its first casualty, with the smallest US spot product winding down and a final trading day of August 17 — the first closure of its kind.
That precedent applies directly here. Issuers who cannot differentiate on liquidity or brand find the path to scale increasingly narrow, and XRP's tail products are smaller in absolute terms than the Bitcoin fund that just failed.
The flow concentration is more extreme than the asset concentration. The category's flow direction is a function of two allocators.
That dependency is the fragility. If either Bitwise or Canary stops allocating, the aggregate weekly number goes negative regardless of what the other five products do. The August 6 session demonstrated it: two funds took seven figures combined and five took nothing.
Volume tells the same story. Average daily volume on XRPI has run as high as 530,930 shares while XRPR has traded as few as 21,820 to 26,370. A fund turning over 22,000 shares daily at $8.75 is moving $192,000 per session.
XRPI Is A Trading Instrument, Not An Investment
The structural distinction between the products in this complex matters more than the flow data, and most holders do not understand it.
XRPI carries daily-reset leverage. It sits at $5.87 against $7.63 on April 1, 2026 and $7.64 at a close on April 6 — a decline of roughly 23% across four months while the underlying token fell from the $1.40 area to $1.07, or approximately 24%.
Read that comparison carefully. A leveraged product declined 23% over four months while its unleveraged reference declined 24%. A 2x vehicle should have fallen roughly 48% on a 24% underlying move in a trending market. It fell half that — because the token did not trend. It chopped.
Daily-reset leverage in a volatile, range-bound asset erodes value even when the underlying ends flat, and XRP's summer has been precisely that: a $1.05 to $1.16 band with repeated failed breakouts.
The compounding drag works in both directions. In a sustained rally the product delivers more than 2x. In a chop it delivers less than 1x. The current 23%-versus-24% outcome is the chop scenario.
XRPI's daily reset makes it a trading instrument only. Holding it across weeks or months in a range-bound market guarantees underperformance versus spot exposure.
The 52-week range on the fund runs $6.50 to $23.53 — a 262% band capturing both launch-window enthusiasm and subsequent compression. Spot at $5.87 has broken beneath the low end of that range entirely.
The reference points across the year map the collapse. XRPI traded $11.77 near launch, $7.94 on March 2, $7.91 on May 9, $7.76 on May 18, $7.58 on May 19, near $7 in June with a $6.50 floor, $6.24 by July 22, and $5.87 now.
That is eight consecutive lower reference prints across nine months with no durable bounce.
For anyone considering exposure, the spot vehicles — XRPC, XRPZ, the Bitwise fund, GXRP — deliver clean tracking. XRPR sits in between.
XRPR Broke Its $9.50 Floor And Liquidity Is The Problem
The REX-Osprey product occupies the middle ground structurally and the bottom rung on liquidity.
XRPR trades at $8.75 against a prior close of $8.63, having broken through the $9.50 floor that held through June. The 12-month band stretched from $9.50 to $25.99 before the break, which means the fund is now trading below the bottom of its own annual range.
The reference sequence: $16.59 near launch, $13.36 in an early-2026 session, $11.54 on May 9, $11.49 on March 2, $11.32 on May 18, $11.07 on May 19, near $10 in June with a $9.50 floor, $9.27 by July 22, and $8.75 now.
From $16.59 to $8.75 is a 47.3% decline. The underlying token fell from roughly $2.00 to $1.02 over a comparable window — 49%. Tracking is close, which is what a spot-like vehicle should deliver.
The liquidity profile is the operational risk. Average daily volume on XRPR sits at roughly 21,820 to 26,370 shares, reflecting the lower-liquidity character typical of newer ETF products. At $8.75, 26,370 shares is $230,738 of daily turnover.
An institution attempting to build or exit a $5 million position in that vehicle would represent 22 days of average volume. That is not a tradeable wrapper for size, and it explains why the fund has attracted so little of the category's cumulative flow.
By contrast, XRPI has run 201,700 to 581,000 shares of average daily volume and Bitwise's fund has run 179,840. Those two are where institutional execution actually happens.
The share-price ledger across the complex reinforces the uniformity of the damage. XRPC trades at $11.36, XRPZ at $11.62, GXRP at $20.73, and XRPR at $8.75. In June, XRPI sat near $7 with a $6.50 low and XRPR near $10 with a $9.50 floor. By July 22 XRPI had fallen to $6.24 and XRPR to $9.27, with share prices down roughly 43% on the year.
Both have since broken through those June floors.
Every product in this complex is at or near its all-time low, which is the correct outcome for funds tracking an asset at its 52-week low.
The Token Broke $1.00 And That Is The Only Input
These funds are pass-throughs, so the analysis resolves into a call on the underlying.
XRP fell below $1 for the first time in two years on August 11, touching a low of nearly $0.99 with a recorded print at $1.0049 — the lowest level since the final quarter of 2024. That capped a weekly loss of roughly 7%. Price rebounded to $1.0211, up 1.06% over 24 hours, with a market capitalization of $64.00 billion.
The technical structure is compressed and overhead. The 20-day EMA sits at $1.0843, the 50-day at $1.1165, and the 100-day at $1.1972. Price sits below all three.
The immediate barriers: $1.03, then $1.05 — the floor that broke on August 6 and has not been reclaimed — then $1.06, where roughly 3 billion XRP previously changed hands. Then $1.09 and the $1.11 to $1.12 region at the 50-day EMA.
Support runs $1.00, then $0.99, with the strongest at $0.9715. Below that, $0.95, then a gap to $0.75.
Momentum reads neutral-to-weak. The relative strength index sits at 38.44 on one calculation and 36.6 on the 14-day measure, neither reaching the sub-30 oversold territory that typically marks a durable bottom. Across 22 technical indicators the short-term reading splits 3 buy, 13 sell and 6 neutral.
Weekly momentum has fallen to levels last seen in the 2022 bear market when XRP traded near $0.29.
The on-chain picture is the counterweight and it is genuinely constructive. Wallets holding at least 1 million XRP added 32 new addresses during the dip. Whales are accumulating more than 10 million XRP per day and have absorbed over 380 million tokens. The 100 million to 1 billion cohort lifted its supply share from 10.6% to 11.99%. Large-holder outflows from the dominant exchange reached 91% of total exchange outflows, the highest concentration since 2024.
Ripple returned 700 million XRP to escrow out of the 1 billion released in August, leaving 300 million in circulation from that tranche.
The network data cuts the other way hard. Monthly active addresses fell 9.4% recently and are down 73% from the December 2024 peak of 654,200, now at 175,100. Monthly volume is down 38.7% to $29.6 billion. Ledger fees fell from $111,387 a year ago to about $10,000.
Breadth Has Collapsed From Four Funds To Two
The internal composition of the flow data has deteriorated faster than the headline number.
The January 6 session had four funds each taking eight figures. The August 6 session had two funds taking seven figures combined and five taking nothing.
That is the metric to track. Four allocators each committing $10 million-plus in a single session describes a category with institutional breadth. Two allocators splitting under $10 million while five print zero describes a category kept alive by two relationships.
A genuine turn shows GXRP, TOXR, XRPR and the index vehicle participating consistently rather than printing zero. Until then, the category's flow direction is a function of two allocators.
The second marker is monthly flows above $150 million. May's $131.94 million was the best month of 2026 and it did not stop the price from falling.
Read that carefully. The category's strongest month of the year, with zero outflow days, coincided with a 7% price decline to $1.20. From $1.20 the token has fallen another 15% to $1.0211.
If $131.94 million of monthly inflow cannot hold the price, the flow threshold required to move it is substantially higher than anything the category has demonstrated.
The scale problem is arithmetic. Reaching a $10 billion cumulative threshold from $1.51 billion requires $8.49 billion of new money. At $150 million monthly that is 57 months. At $500 million monthly it is 17 months.
The category needs a step change, not an improvement.
Against the current run rate of $55 million monthly averaged across 2026, or $27.29 million in July, or $1.01 million in the most recent week, that step change is not visible in any dataset.
One additional seller sits inside the structure. A trust vehicle disclosed 103.41 million XRP — worth about $180.78 million — in net outflows during the first half of 2026.
CLARITY Slipped To September And The Market Prices 21%
The regulatory catalyst that anchors every bull case on this category has been pushed out and discounted.
The US Senate postponed a vote on the CLARITY Act — legislation designed to establish clearer rules for digital assets — pushing deliberations into September. The delay weighed on price, which slipped to $1.02 within a whisker of breaching the $1 floor.
Prediction market pricing on CLARITY passing in 2026 sits at 21% yes against 79% no, unchanged since August 10.
The mechanics make the delay worse than a schedule slip. Ethics and divestiture language, stablecoin reward structures and illicit-finance protections all remain unresolved, and none of them get negotiated while the chamber is out of session. No floor action can move the bill regardless of what any economic release shows. Markets pricing crypto legislation risk are frozen at the same starting line until mid-September.
CLARITY passage would replace March 2026's interpretive guidance with law, which is the precondition for the institutional allocation channel to open substantially.
The earlier framing of the trade was explicit: the complex functions as a binary option on CLARITY passage. If the legislation clears the Senate floor, the institutional allocation channel opens and a projected $4 to $8 billion inflow wave produces structural price discovery toward higher levels. If it stalls, the existing institutional flow pace is the realistic continuation case — meaningful but not transformational.
The legislation stalled. The flow pace collapsed to $1.01 million weekly.
A failed vote removes the catalyst for 2026 and probably 2027, and at 21% implied probability the market is not paying for the option.
The precedent from the last regulatory win should temper expectations. XRP surged more than 23% to $3.38 within days when the securities appeals were dropped in August 2025. By the end of December it had retreated to $1.87. By early February 2026 it was at $1.11.
Regulatory wins have produced spikes, not trends. Each one has been sold.
Read More
-
Yen Stalls at 160 Despite a 3% JGB and Tokyo Core CPI at 2.0% — Intervention Sits at 164, Friday's Payrolls Decide
02.09.2026 · TradingNEWS ArchiveEnergy
-
QQQ ETF ($706.22) Slides 7.4% Below Its High as the Market Reprices the AI Capex Bill — $686.57 Target if $700 Breaks
22.10.2026 · TradingNEWS ArchiveStocks
-
XRPI ($7.00) and XRPR ($10.74) Slide Toward 52-Week Lows as Spot XRP ETF Flows Stall at $708,510
22.10.2026 · TradingNEWS ArchiveCrypto
-
NG ($2.775) Decoupled From Europe’s €88 Gas Crisis as LNG Feedgas Hits 18.9 Bcf/d — $3.30 Upside on Cold Weather
22.10.2026 · TradingNEWS ArchiveCommodities
-
Dollar-Yen (157.35) Loses 157.65 as the Yen Rallies on Haven Demand — 155 Target if 156 Breaks
22.10.2026 · TradingNEWS ArchiveForex
The Category Is Losing The Competition For Crypto Allocation
The relative flow data across wrappers shows exactly where institutional money is choosing to go.
On August 10, Bitcoin ETFs shed $144.67 million and Ethereum products lost $14.59 million while Solana funds added $8.83 million. On August 11, Bitcoin took $4.8862 million with only one fund attracting capital and Ethereum bled $1.7644 million.
Across the week, Bitcoin ETFs delivered an $816 million turnaround and Ethereum pulled in $195.34 million. XRP managed $1.01 million.
Solana's August 10 print was its strongest single day since May 12, lifting Solana ETF net assets to roughly $906 million with cumulative inflows past $1.15 billion.
That comparison is the one that should concern XRP holders most. Solana's complex launched later, holds $906 million against XRP's $964.21 million, and has drawn $1.15 billion cumulative against XRP's $1.51 billion — but Solana's flow is accelerating while XRP's has collapsed 93%.
The differentiator is yield. Solana staking offers 5% to 7% and a staking ETF filing is under review with periodic reward distributions to shareholders. Ethereum products distribute staking yield with a base APR of 2.78% plus MEV. Bitcoin generates nothing but carries $77.6 billion of assets and unmatched liquidity.
XRP offers neither yield nor scale. Its wrapper delivers pure directional exposure to a token down 41.51% year-to-date with ledger fees down 91% and active addresses down 73% from peak.
Every dollar flowing into spot Bitcoin ETFs is a dollar that did not enter XRPI, XRPR, or any other altcoin product.
Bitcoin dominance previously broke out to 60.66%, the highest reading since April 2021, ending an eight-month accumulation range. That rotation dynamic has not reversed.
For an allocator building crypto exposure today, the decision tree runs: Bitcoin for liquidity and scale, Ethereum or Solana for yield, and XRP for a regulatory bet priced at 21%.
What The Funds Do If The Token Recovers
The upside case is mechanical and it requires specific levels on the underlying.
XRP reclaiming $1.11 at the 50-day moving average and targeting $1.36 at the 200-day would re-rate the funds directly: XRPI toward $7.60 and XRPR toward $11.
From $5.87, a move to $7.60 is 29.5% upside. From $8.75, a move to $11 is 25.7%.
The token move required is $1.0211 to $1.36 — 33.2%. XRPR capturing 25.7% on a 33.2% underlying move reflects the small tracking drag and fee load. XRPI capturing 29.5% on the same move demonstrates the leverage working, though below the 2x it advertises, because the path matters more than the endpoint.
The intermediate gate is $1.05 and $1.06, where roughly 3 billion XRP previously changed hands. Clearing that supply wall is the precondition for anything above it.
The $8 end-2026 target that has circulated on this category requires both CLARITY passage and $10 billion of flow. Neither is close: passage sits at 21% implied probability and reaching $10 billion cumulative requires $8.49 billion of new money against a current run rate that would take 57 months at $150 million monthly.
The three markers that would signal a genuine turn are specific and trackable. Breadth returning, with GXRP, TOXR, XRPR and the index vehicle participating consistently rather than printing zero. Monthly flows above $150 million. And statutory clarity replacing interpretive guidance with law.
None of the three is currently present.
The asymmetry argument on the other side is that capital deployed into these wrappers at depressed levels offers meaningful upside optionality if the legislation passes, with downside contained by the persistent institutional flow architecture and the existing cumulative capital base.
That framing was written when the complex held $1.4 billion in assets and was taking $95.5 million across nine consecutive inflow days. It now holds $964.21 million and took $1.01 million in a week.
The flow architecture that was supposed to contain the downside has thinned to two allocators.
Which Product To Own If You Own Any
The structural differences across the seven products determine outcomes more than timing does.
For clean spot tracking, the vehicles are XRPC at $11.36, XRPZ at $11.62, the Bitwise fund, and GXRP at $20.73. Those deliver the token's move less fees with minimal structural drag.
Bitwise carries the deepest asset base at $312.82 million and 33% of cumulative inflows, with average daily volume around 179,840 shares. That combination — largest assets, adequate liquidity, clean tracking — makes it the default institutional choice within the category.
XRPC holds roughly $250 million on $468.12 million of inflows at 31% of the category. XRPZ carries roughly $254 million on $426.53 million.
Those three funds hold 82% of assets, which means the other four carry execution risk on top of price risk.
XRPR sits in between structurally and at the bottom on liquidity, with 21,820 to 26,370 shares of average daily volume. It tracks reasonably but cannot absorb size.
XRPI is a trading instrument only because of its daily reset. Holding it through a range-bound market destroys capital independent of direction — the 23% four-month decline against a 24% underlying move proves the drag is live.
GXRP has given back more than half its $131.46 million of cumulative inflows. TOXR has never been cumulatively positive and is the most likely candidate for the category's first closure.
The practical guidance is narrow. If the view is directional on XRP over weeks, use Bitwise or XRPC. If the view is a tactical trade over days around a specific catalyst, XRPI's leverage is appropriate and its drag is tolerable. If the view is nothing in particular, the category offers no yield, no scale advantage, and a 93% weekly flow collapse.
Custody across the complex sits with two institutional providers, which concentrates operational risk at a level most holders never examine.
Verdict: Avoid The Category Until Breadth Returns — Trade XRPI Only Above $1.00 Spot
The honest call is that this complex is uninvestable at present and tradeable only on a specific catalyst.
Cumulative inflows of $1.51 billion have produced $964.21 million of assets — $546 million erased by price. Weekly flows collapsed 93% to $1.01 million. Monthly flows fell 79% from $131.94 million in May to $27.29 million in July. Three funds hold 82% of assets and two allocators supply the entire flow direction. Five of seven products printed zero on the most recent measured session. Every share price in the complex sits at or near an all-time low. The CLARITY vote slipped to September at 21% implied passage odds. Ledger fees fell 91% to $10,000 monthly and active addresses are down 73% from peak.
For a tactical trade, the structure exists. Long the Bitwise fund or XRPC with the token above $1.00, stop on a daily close below $0.9715 on spot, targeting XRP at $1.11 for a 8.7% underlying move and $1.36 for 33.2%. That translates to roughly 25.7% on XRPR from $8.75 to $11 and 29.5% on XRPI from $5.87 to $7.60.
Risk on the underlying to the $0.9715 stop is 4.9%, which gives 5.3 to 1 on the $1.36 target if the token cooperates. Use the spot vehicles rather than XRPI unless the horizon is measured in days.
The bull case rests entirely on whales being right. They added 380 million tokens, lifted the 100 million to 1 billion cohort share from 10.6% to 11.99%, and accounted for 91% of exchange outflows — the highest concentration since 2024. Ripple locked 700 million tokens back into escrow. Those cohorts selected the $1.00 to $1.02 band deliberately.
The bear case requires no forecast. The category's own flow data is the evidence, and the price of every product in it is the verdict.
The three signals that change the call: monthly flows above $150 million, four or more funds each taking eight figures in a session, and CLARITY clearing the Senate. Two are flow metrics published weekly. The third is priced at 21%.
Until at least two of the three appear, this is a category holding $964.21 million of capital that entered at $1.51 billion, tracking a token 70.55% below its high with network usage in freefall.



