





XRP Defends $1.00 As Institutions Flee And Whales Buy — The Widest Flow Divergence Since Launch
The $1.05 floor broke on August 6 and has not been reclaimed, with 3B XRP of prior volume sitting at $1.06 as the next barrier | That's TradingNEWS
Key Points
- XRP-USD at $1.0211, up 1.06%, after an $0.99 print; market cap $64.00B, down 69.4% in 2026
- Weekly ETF inflows fell 93% to $1.01M while BTC took $754.69M and ETH $195.34M
- Whales added 380M tokens; 91% of exchange outflows were large holders, most since 2024
Ripple's token did the one thing it had to do. XRP trades at $1.0211, up 1.06% over 24 hours, carrying a market capitalization of $64.00 billion and holding sixth place in the asset class. The recovery came off a break that had not happened since late 2024.
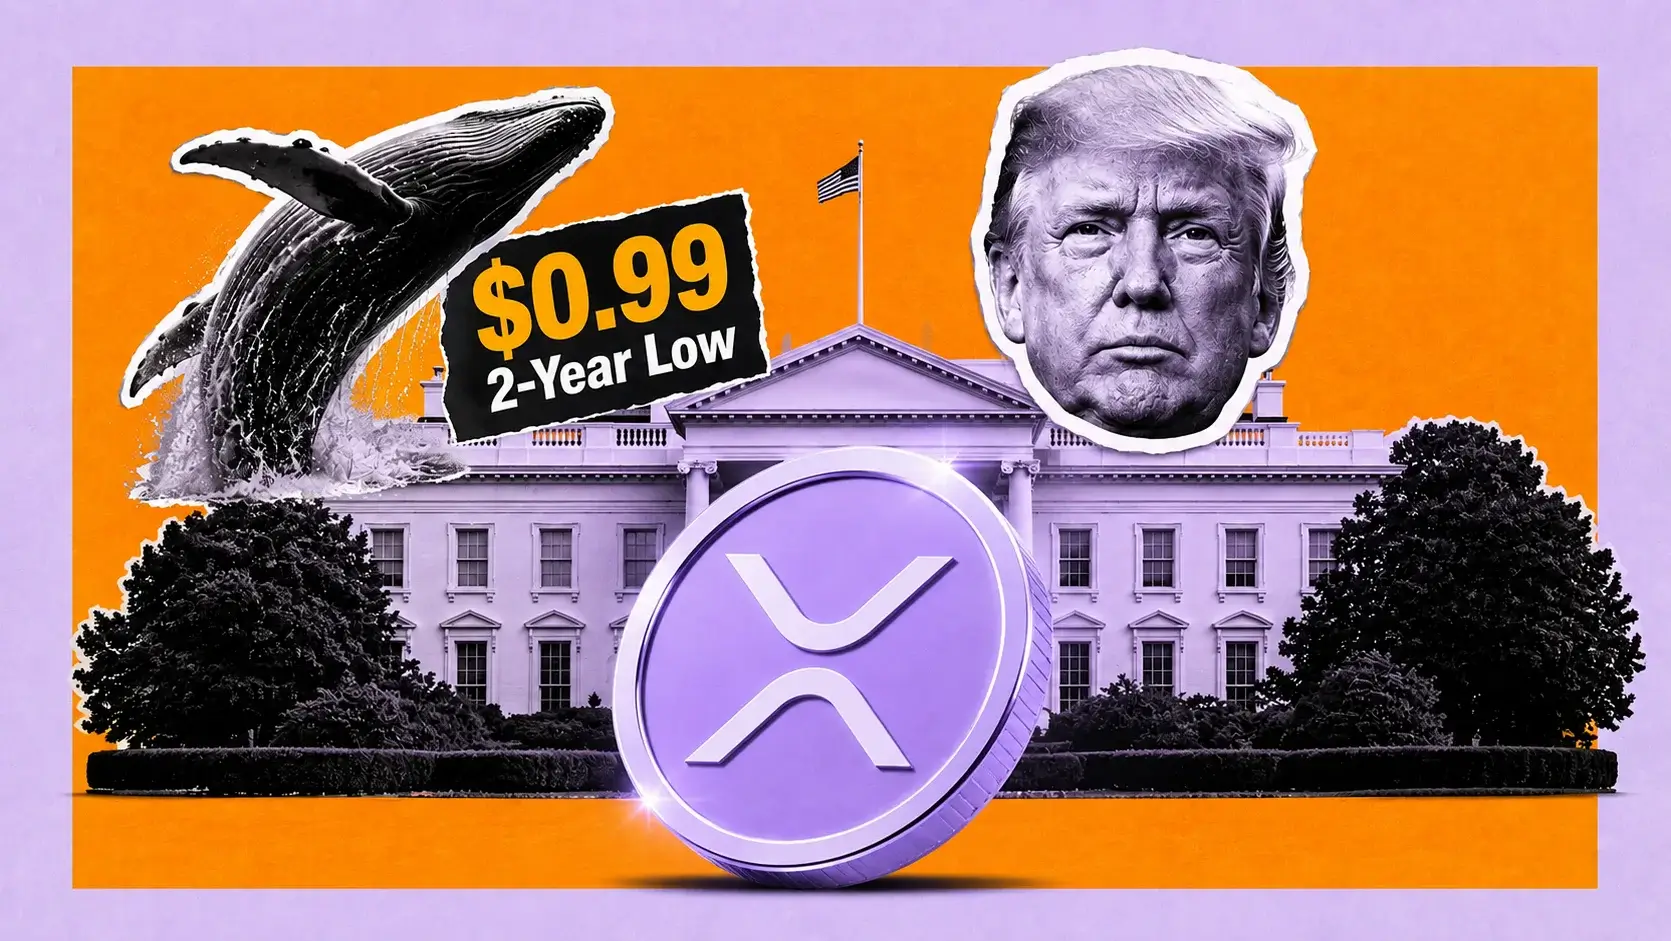
XRP fell below $1 for the first time in two years on August 11, touching a low of nearly $0.99 with a recorded print at $1.0049 — the lowest level since the final quarter of 2024, when the token was preparing to break above the dollar for the first time in years. That capped a weekly loss of roughly 7%. Price rebounded to $1.02 and has held there through the CPI release.
The macro print did nothing. Headline CPI slowed to 3.4% year-over-year with core at 2.5%, both matching consensus, per the July 2026 CPI release. XRP remained close to $1.02 with only minor fluctuation, staying inside its pre-release range while Bitcoin held $64,000 and Ether reclaimed $1,900.
The damage year-to-date is severe. XRP is down 69.4% in 2026, more than 65% below the January high of $3.40, and 73% below the July 2025 high of $3.65 against an all-time high of $3.84. Total market value fell roughly 29% over the past three months alone.
The thesis is a divergence trade, and it is the widest divergence in the asset class right now. Weekly ETF inflows collapsed 93% to $1.01 million for the week ending August 8, down from $14.86 million the prior week, while Bitcoin and Ethereum funds pulled in more than $1 billion combined over the same stretch. At the same time, whale wallets are accumulating more than 10 million XRP per day, wallets holding at least 1 million XRP added 32 new addresses during the dip, and large-holder outflows from the dominant exchange reached 91% of total exchange outflows — the highest concentration since 2024.
Collapsing institutional demand against accelerating whale accumulation is the widest that gap has been since the post-listing launch, and that divergence has historically preceded significant moves in both directions.
The trade is $1.05, the floor that broke on August 6 and has not been reclaimed. Above it, $1.06 and 3 billion XRP of prior volume. Below $1.00, the tape opens toward $0.92.
The $1.05 Floor Broke And Nothing Above It Has Been Reclaimed
The technical break that defines the current structure happened six days ago and the market has not repaired it.
XRP entered August at $1.06, down approximately 43% from a January high, with the $1.00 support level functioning as the only demand zone bulls had successfully defended across the entire calendar year. The $1.05 floor broke on August 6 and has not been reclaimed since. Price dipped to $1.01 on Friday, defended the $1.00 psychological level, and recovered toward $1.02 to $1.04 — still trapped beneath the broken floor.
Then Tuesday took out $1.00 entirely with a print near $0.99 before the bounce.
The immediate structure: the classical pivot sits at $1.02, exactly where price trades. Support levels run $1.00, then $0.99, with the strongest at $0.9715. Resistance runs $1.03, then $1.05, then $1.06.
That is a 4-cent band containing six defined levels. XRP is not trending. It is compressed against the round number that has defined its entire 2026 range.
The resistance at $1.06 carries weight beyond the round number. Roughly 3 billion XRP previously changed hands at that level, which makes it a genuine supply overhang rather than a chart line. Clearing it requires absorbing three billion tokens of break-even sellers.
Above $1.06, the next barriers sit at $1.09 — 6.7% above spot — then $1.12, then the $1.12 to $1.15 resistance zone that has capped every attempt inside the descending channel that has contained the token all year.
Downside structure below $1.00 is thinner and it matters. A close below the dollar opens a drop toward $0.92, identified as the next support area. Beneath that, the demand structure runs $1.00 to $0.95, then $0.75, then $0.60 to $0.52.
The distance from $1.0211 to $0.75 is 26.6%. That is the air pocket underneath this token if $0.95 fails, and it is the reason position sizing matters more than direction here.
The Moving Average Stack Is Entirely Overhead
Every meaningful average sits above price, and each one is declining.
XRP trades below the 50-day EMA at $1.1165, which makes the $1.11 to $1.12 region the first meaningful upside resistance zone. The 100-day EMA at $1.1972 caps any extended recovery. Sustained trading above the 20-day EMA at $1.0843 would strengthen the case for a base.
Read the distances. The 20-day EMA sits 6.2% above spot. The 50-day sits 9.3% above. The 100-day sits 17.2% above. Price is below all three, and $1.04 remains the key downside support.
The simple moving averages tell the same story. Price remains below both the 50-day and 200-day SMAs, which keeps the downtrend intact. The 50-day SMA is estimated to reach $1.05 by September 10 and the 200-day SMA to fall to $1.24 over the same window.
That second figure is the more useful one. A declining 200-day average approaching $1.24 means time is working in the bulls' favor mechanically — the wall gets lower every session even if price does nothing. But $1.24 is still 21.4% above spot on September 10.
Momentum reads neutral-to-bearish without capitulation. The relative strength index sits at 38.44 on one calculation and 36.6 on the 14-day measure. Neither has reached the sub-30 oversold territory that typically marks a durable bottom.
The aggregate signal count is unambiguous. Across 22 technical indicators — oscillators, moving averages and trend measures — the short-term reading is bearish: 3 buy signals at 14%, 13 sell signals at 59%, and 6 neutral.
Weekly momentum is the alarming part. Weekly readings have fallen to levels last seen in the 2022 bear market, when XRP traded near $0.29. That comparison does not imply a $0.29 target — it says the momentum structure is as damaged as it was at the prior cycle trough.
Two constructive signals cut the other way. The MACD ticked higher for the first time since late July even as price ground lower, which indicates selling pressure losing force. And a monthly TD Sequential buy signal has appeared.
One analyst who has called the downtrend for close to a year pointed to a recent lower low alongside a momentum measure showing early stabilization — a pattern described as tentatively bullish but requiring several more days of price action to confirm.
ETF Inflows Collapsed 93% While Bitcoin And Ether Took A Billion
The institutional story is the clearest fundamental failure in the asset class this month.
US spot XRP ETFs took in only $1.01 million over the week ending August 8, a 93% collapse from the $14.86 million the funds pulled the week before. Net assets slipped to $964.21 million from $988.78 million. Seven spot XRP ETFs hold a combined total near $1 billion.
The comparison is what makes it damning. Over the same week, Bitcoin ETFs swung from a $61.53 million outflow to a $754.69 million inflow — an $816 million single-week turnaround. Ethereum funds pulled in $195.34 million, close to seven times the prior week's $27.42 million. XRP's complex was the weakest performer among all major crypto fund categories.
The daily breakdown shows where the damage happened. XRP ETFs took a $3.58 million outflow on August 5 and posted zero net flow on August 4. By August 6 the institutional side flipped, drawing a $3.45 million inflow — the strongest of the run. The weekly total read soft because the late bounce could not erase the midweek bleed.
That was technically the fourth consecutive week of net inflows, which is the only positive framing available.
The trajectory over months is worse than the week. Weekly inflows ran over $100 million in late 2025. July closed with $27.29 million in net inflows across weeks of $6.78 million, $8.15 million and $14.86 million — and July still ranked as the second-weakest month for XRP ETF demand since January.
The holdings scale explains the limited price impact. The funds hold approximately 978 million XRP combined, which is under 2% of total supply. Against a $64 billion market capitalization, $964 million of ETF assets represents 1.5% of the network.
Compare that penetration to Bitcoin at 5.9% and Ethereum at 7.7%. XRP's regulated wrapper is a quarter as deep relative to market size, which means the ETF channel has neither the flow nor the float impact to move price.
One additional seller sits inside the structure. A trust vehicle disclosed 103.41 million XRP — worth about $180.78 million — in net outflows during the first half of 2026.
Four consecutive weeks above $10 million in net inflows would signal a trend reversal. Four consecutive weeks below $5 million would confirm the August collapse is structural.
Whales Bought 380 Million Tokens While Retail Sold
The on-chain picture inverts the flow picture completely, and it is the strongest argument the bulls have.
Wallets with at least 1 million XRP added 32 new addresses during the recent dip — large holders buying as smaller retail investors sold. Whale wallets are accumulating more than 10 million XRP per day. On-chain data shows whales accumulated over 380 million tokens across the recent stretch.
The cohort share data quantifies it. Wallets holding roughly 100 million to 1 billion tokens increased their supply share from 10.6% to 11.99% — a 139 basis point gain in concentration. At a 58.7 billion circulating supply, that shift represents roughly 816 million tokens moving into the largest non-exchange cohort.
Smaller whales holding 10 million to 100 million XRP sold earlier in the week before turning back to buying on August 6.
The exchange flow data confirms the direction. Tokens flowed onto exchanges for most of the week, a common sign of selling that aligned with the institutional bias. More than 2 million tokens then left those venues on August 6 — a shift that usually points to accumulation.
Three separate reads landed on the same date. ETF flow turned positive day-on-day, smaller whales resumed buying, and coins started leaving exchanges, all on August 6.
The concentration detail is the most striking figure in the dataset. Large-holder outflows from the dominant exchange reached 91% of total exchange outflows — the highest concentration since 2024. When nine of every ten coins leaving an exchange belong to a large wallet, the accumulation is not retail dip-buying. It is size.
Sustained accumulation above 10 million XRP per day indicates large holders maintain conviction. A slowdown below 5 million per day would suggest even whales are losing confidence.
Supply management adds to the picture. Ripple returned 700 million XRP to escrow out of the 1 billion tokens released under its scheduled August allocation, leaving just 300 million in circulation from that tranche. That lock-up reduces near-term float by 700 million tokens — worth $715 million at current prices.
Against that, liquidation data shows the leveraged side got cleared out. Roughly $9.48 million in XRP liquidations were recorded, with almost 98% coming from long positions.
Network Activity Has Collapsed 73% From Its Peak
The fundamental case for XRP rests on ledger usage, and the usage data is the worst thing on the board.
Monthly active addresses on the XRP Ledger fell 9.4% recently and are down 73% from the December 2024 peak of 654,200, now sitting at 175,100. Monthly volume is down 38.7% to $29.6 billion. Fees earned on the ledger dropped from $111,387 a year ago to about $10,000 now.
A 91% decline in ledger fee revenue is the number that matters. XRP has no burn mechanism comparable to Ethereum's, but fee generation is the direct measure of whether the ledger is being used for anything. Ten thousand dollars in monthly fees on a $64 billion asset is a usage-to-valuation ratio that cannot support a fundamental thesis.
Stablecoin activity on the network has shrunk as well. The market capitalization of stablecoins on the XRP Ledger fell 14.8% to $855.6 million.
That last figure sits in direct tension with the company's flagship product success. RLUSD, the regulated stablecoin, reached $1.6 billion in market cap, making it the third-largest US-regulated stablecoin. But if XRPL stablecoin market cap is $855.6 million while RLUSD totals $1.6 billion, the majority of RLUSD supply lives somewhere other than the XRP Ledger.
That is the crux of the bridge-currency question. If RLUSD volume shifts toward the XRP Ledger, the bridge mechanism begins generating real XRP demand. If volume remains concentrated on Ethereum, RLUSD growth continues to be XRP-neutral.
The infrastructure buildout is stalled elsewhere too. Ripple's lending protocol sits at 20% validator support, well short of the 80% needed to launch.
Twenty percent against an 80% threshold is not close. That amendment does not activate on the current trajectory, which removes a demand catalyst the 2026 thesis was built on.
The structural question is whether the 2026 bull case — built on ETF inflows, regulatory clarity and institutional adoption — can survive contact with the data now available. Two of those three pillars have measurably weakened: ETF inflows collapsed 93%, and the regulatory catalyst has been postponed.
The CLARITY Act Slipped To September And Nobody Believes It Passes
The regulatory catalyst that anchored the bull thesis has been pushed out, and the prediction markets have written it off.
The US Senate postponed a vote on the CLARITY Act — legislation designed to establish clearer rules for digital assets — pushing deliberations into September. The delay weighed directly on price, which slipped to $1.02 within a whisker of breaching the $1 floor.
Market-implied odds are grim. Prediction market pricing on CLARITY passing in 2026 sits at 21% yes against 79% no, a level unchanged since August 10.
The mechanics of the delay make it worse than a schedule slip. Ethics and divestiture language, stablecoin reward structures, and illicit-finance protections all remain unresolved, and none of them get negotiated while the chamber is out of session. No floor action can move the bill in either direction regardless of what CPI, PPI or any other release shows in the meantime. Markets pricing crypto legislation risk are effectively frozen at the same starting line until mid-September.
A failed vote removes the catalyst for 2026 and probably 2027.
That framing matters for XRP more than for any other major token. Bitcoin and Ethereum have functioning ETF complexes with $78 billion and $18 billion in assets respectively and do not require new legislation to attract institutional capital. XRP's institutional case has always run through regulatory certainty, and the 2025 resolution of the securities litigation was supposed to be the unlock.
The token surged more than 23% to $3.38 within days when the securities appeals were dropped in August 2025. By the end of December it had retreated to $1.87. By early February 2026 it was at $1.11.
That sequence is the honest history. Regulatory wins have produced spikes, not trends. Each one has been sold.
Whether a CLARITY passage would be different depends on whether it unlocks bank and asset-manager balance sheets in a way the litigation resolution did not. At 21% implied probability, the market is not paying for the option.
The 2026 Price History Is A Series Of Failed Bases
Understanding where this token sits requires the full year, and the year is a stair-step lower with no durable base.
XRP entered 2026 above $3.30 and is down 69.4%. The decline began in January following a brief rally to $2.41. By early February the price had fallen to $1.11. From mid-February to mid-May it consolidated within a narrow range of $1.27 to $1.67. At the end of May the decline resumed and the price reached $1.05 amid a broader crypto downtrend.
August 1 opened at $1.06. Price traded $1.07 through the first week, dipped to $1.02 on August 7, broke the $1.05 floor on August 6, hit $1.0049 on August 11, and sits at $1.0211 now.
Read that sequence as ranges: $2.41 to $1.11, then $1.27 to $1.67, then $1.05 to $1.07, then $0.99 to $1.06. Each consolidation zone is narrower and lower than the last. Four progressively tighter ranges in seven months is a compression pattern that resolves with a directional break, and three of the four broke lower.
The token is 72% below its cycle peak, and one analyst who published a bearish call in July 2025 above $3 has watched that thesis play out almost in full.
The comparative underperformance is the tell that matters most right now. Bitcoin, Ethereum and Solana all bounced during the recent week while XRP fell about 5%, despite continued ETF inflows. Bitcoin sits 49% below its October 2025 high. Ethereum sits 61% below its August 2025 record. XRP sits 73% below its July 2025 high.
XRP is the worst performer among the majors from cycle peak, and it is the only one that broke a two-year support level this month.
The withheld part of the setup: the token everyone expects to bounce is instead grinding against the floor while its peers rally. Something has to break, and the direction of that break decides whether XRP is setting up a recovery or another leg down.
Where The Upside Targets Actually Sit
The bull roadmap requires a sequence of levels that spot is nowhere near, and the honest read is that the first two are what matter.
The immediate requirement is reclaiming $1.05 and then $1.06 with the 3 billion XRP of prior volume at that level absorbed. Above that, the next resistance runs $1.09, then $1.12, then the $1.12 to $1.15 zone. If the asset holds above $1.15 it may climb to $1.20.
The 100-day EMA at $1.1972 caps any extended recovery. A sustained breakout above the $1.19 to $1.20 region would improve the medium-term outlook.
Beyond that, the wave-based framework requires clearing $1.30 to $1.60, then $1.96, to validate a move toward $3.00 to $3.60. Intermediate upside targets are stacked at $1.35 and $1.64 if momentum shifts.
Put those distances in context. Reclaiming $1.06 is 3.8% upside. Clearing $1.12 is 9.7%. Reaching the 100-day EMA at $1.1972 is 17.2%. Getting to $1.35 is 32.2%. The $3.00 target is 193.8% away.
The forecast distribution reflects the skepticism. One model puts the remaining 2026 range at $1.04 to $1.28 with an August target of $1.12. Another projects a monthly average of $1.0186 with a range of $0.9480 to $1.0893 — effectively flat — and a twelve-month average of $1.2274 for 20.2% upside. A third places the 2026 year-end base case at $0.8757, with a bear case of $0.5254 and a bull case of $4.34.
The consensus range for 2026 spans $1.05 to $1.72. Some analysts anticipate growth by autumn, others predict a decline by year-end.
Scenario probabilities from one framework: 50% chance of consolidation with a close between $1.05 and $1.15, 25% chance of a bullish breakout toward $1.20 to $1.35, and 25% chance of a bearish breakdown producing a close between $0.85 and $0.98.
The most useful of those numbers is the 50% consolidation weighting. The base case for August is a $1.05 to $1.15 chop, and spot at $1.0211 sits below the bottom of that band.
Analysts flagging XRP as a key altcoin to watch point to potential 20% to 40% downside with an accumulation range between $0.85 and $0.65.
The Three Conditions That Have To Be Met
Recovery in this token requires specific, observable events rather than sentiment improvement, and all three are trackable weekly.
First: ETF flows have to return. The threshold is four consecutive weeks above $10 million in net inflows, which would signal a trend reversal. Four consecutive weeks below $5 million confirms the collapse is structural. Weekly flow reports publish every Monday. Current run rate: $1.01 million.
Second: RLUSD transaction volume has to shift onto the XRP Ledger. The stablecoin has reached $1.6 billion in market cap as the third-largest US-regulated stablecoin, but XRPL stablecoin market cap sits at $855.6 million and fell 14.8%. If volume migrates to the ledger, the bridge-currency mechanism begins generating real XRP demand. If it stays concentrated on Ethereum, RLUSD growth remains XRP-neutral regardless of how large it gets.
Third: whale accumulation has to hold above 10 million XRP per day. That is the current rate, tracked through daily exchange outflow data. A slowdown below 5 million per day would indicate even large holders are capitulating.
A fourth variable sits outside the token's control: whether Bitcoin holds $60,000. BTC trades at $64,000 with the $62,662 early-August low as the operative support and $59,300 as the June low beneath it. XRP has an elevated beta to Bitcoin drawdowns and has underperformed on every recent bounce, which means a Bitcoin break of $60,000 takes XRP through $0.95 regardless of its own flow data.
The escrow schedule is the supply variable. Ripple returned 700 million of 1 billion released tokens to escrow in August, leaving 300 million in circulation. Watching whether that pattern holds in September determines whether the float expands or contracts into the CLARITY vote.
The legislative timeline is fixed. No floor action can move the bill while the chamber is out. Deliberations resume in September at 21% implied passage odds for 2026.
That gives four to six weeks of pure technical trading with no fundamental catalyst available in either direction. In that environment, the $1.00 line and the $1.05 broken floor are the entire market.
Read More
-
Yen Stalls at 160 Despite a 3% JGB and Tokyo Core CPI at 2.0% — Intervention Sits at 164, Friday's Payrolls Decide
02.09.2026 · TradingNEWS ArchiveEnergy
-
QQQ ETF ($706.22) Slides 7.4% Below Its High as the Market Reprices the AI Capex Bill — $686.57 Target if $700 Breaks
22.10.2026 · TradingNEWS ArchiveStocks
-
XRPI ($7.00) and XRPR ($10.74) Slide Toward 52-Week Lows as Spot XRP ETF Flows Stall at $708,510
22.10.2026 · TradingNEWS ArchiveCrypto
-
NG ($2.775) Decoupled From Europe’s €88 Gas Crisis as LNG Feedgas Hits 18.9 Bcf/d — $3.30 Upside on Cold Weather
22.10.2026 · TradingNEWS ArchiveCommodities
-
Dollar-Yen (157.35) Loses 157.65 as the Yen Rallies on Haven Demand — 155 Target if 156 Breaks
22.10.2026 · TradingNEWS ArchiveForex
The Divergence Is The Setup And It Cuts Both Ways
Strip everything else and one fact defines this trade: retail and institutional money are leaving while the largest holders are buying, and the gap between those two flows is the widest since the token's post-listing launch.
The institutional side: $1.01 million of weekly ETF inflows against $754.69 million for Bitcoin and $195.34 million for Ethereum. Net assets falling to $964.21 million. A trust vehicle bleeding 103.41 million tokens in the first half. Monthly active addresses down 73% from peak. Ledger fees down 91% year-over-year. Monthly volume down 38.7%.
The whale side: more than 10 million XRP accumulated daily. Over 380 million tokens absorbed. Thirty-two new addresses above the 1 million XRP threshold added during the dip. The 100 million to 1 billion cohort lifting its supply share from 10.6% to 11.99%. Ninety-one percent of exchange outflows attributable to large holders — the highest concentration since 2024. Seven hundred million tokens returned to escrow.
Divergence of that magnitude has historically preceded significant price moves in both directions. It does not tell you which direction.
What tips the probability is which cohort has better information. Whales accumulating at $1.00 to $1.02 have selected that band deliberately, and it corresponds precisely to the level the entire 2026 range has defended. Institutions withdrawing are responding to a legislative delay and a usage decline that are both documented.
Both readings can be correct simultaneously. Whales can be right about a bounce from $1.00 and institutions can be right that the fundamental case has deteriorated. That combination produces a range, not a trend, which is exactly what the 50% consolidation probability for August describes.
The resolution mechanism is the monthly TD Sequential buy signal alongside the MACD ticking higher for the first time since late July. Those are the first constructive momentum readings this token has produced since the $1.05 break. Both need multiple sessions of confirming price action.
For the trade, the divergence has one practical implication: the $1.00 level is defended by size, which makes a stop below it high-probability rather than arbitrary. Whales bought there. If price closes decisively beneath it, the cohort that has been accumulating has stopped, and that is the cleanest exit signal available.
Verdict: Long Above $0.99, Target $1.0843 Then $1.1165 — Stop Below $0.9715
The trade is a range long with tight risk, and the justification is the whale bid at the level rather than any improvement in the fundamentals.
XRP reclaimed $1.00 after printing $0.99, the first sub-dollar trade in two years. Whales are absorbing more than 10 million tokens daily, 91% of exchange outflows belong to large holders, the 100 million to 1 billion cohort lifted its share from 10.6% to 11.99%, and Ripple returned 700 million tokens to escrow. A monthly TD Sequential buy signal has printed and the MACD has ticked higher for the first time since late July. Leveraged longs were cleared with 98% of $9.48 million in liquidations coming from that side.
Entry at $1.0211 with a stop on a daily close below $0.9715 risks 4.9%. First target is the 20-day EMA at $1.0843 for 6.2%. Second target is $1.12 for 9.7%. Third is the 50-day EMA at $1.1165 — effectively the same level — and then the 100-day EMA at $1.1972 for 17.2%.
Risk-reward to $1.12 runs 2.0 to 1. To $1.1972, 3.5 to 1.
The gate is $1.05 and $1.06. Until the broken floor is reclaimed with the 3 billion XRP of prior volume at $1.06 absorbed, this is a bounce inside a descending channel and nothing more. Two daily closes above $1.06 changes the character of the trade and justifies holding for the 100-day EMA.
The bear case is stronger on fundamentals than the bull case is on flows. ETF inflows collapsed 93% to $1.01 million while Bitcoin and Ether took over $1 billion combined. Ledger fees fell 91% to $10,000 monthly. Monthly active addresses are down 73% from peak to 175,100. Monthly volume is down 38.7% to $29.6 billion. The lending protocol sits at 20% validator support against an 80% threshold. The CLARITY vote slipped to September at 21% implied passage odds. Weekly momentum sits at levels last seen when the token traded near $0.29. Thirteen of 22 technical signals read sell.
A daily close below $1.00 opens $0.92. Below $0.95, the structure has no defined support until $0.75, a 26.6% decline, and the deeper zone runs $0.60 to $0.52.
Size accordingly. The base case for August is a $1.05 to $1.15 chop at 50% probability, with 25% assigned to a $1.20 to $1.35 breakout and 25% to a $0.85 to $0.98 breakdown. Spot sits below the base-case band, which is why the long is worth taking — and why it is worth taking small.
The next scheduled catalyst is Monday's ETF flow report. Above $10 million and the institutional narrative turns. Below $5 million and the collapse is confirmed structural.



