


USD/JPY Price Forecast - USDJPY=X Slides, BoJ 0.50% Hike, Fed Cut and NFP Set the Next Big Move
With USD/JPY trapped between 154.50 and 158.90 as BoJ–Fed divergence, 3.6% Japan CPI, 2.9% US CPI and 64k–150k NFP forecasts collide | That's TradingNEWS
12/16/2025 9:03:33 PM
USD/JPY Trading Zone, Recent Highs And The 160.00 Question
USD/JPY has shifted from a one-way march higher into a compression phase just below the extremes. After peaking near 158.90 in early January and trading as high as 158.05, roughly 13.25% above the late-September low, the pair has slipped back toward the mid-150s, with recent prints around 154.90–155.90. The structure is no longer a clean breakout; price has spent days oscillating between support around 155.00 and resistance in the 158.00–159.00 band. The earlier push through the 78.6% Fibonacci retracement of the prior downswing and the move above the 50-day moving average created a textbook bullish flag and put the psychological 160.00 level on the table. That target is still visible if the Bank of Japan stands aside, but repeated failure to clear the 158–159 ceiling and the latest pullback under short-term moving averages show that upside momentum has cooled and the pair is vulnerable on the downside if the macro tape turns.
BoJ Inflation Shift: Wages, CPI And A Benchmark Rate Up To 0.50%
Japan is no longer the low-inflation outlier it was for decades, and that matters directly for USD/JPY. Average cash earnings growth accelerated from about 2.2% in October to roughly 3.0% in November, while overtime pay climbed from 0.70% to around 1.60%. Headline consumer inflation moved from 2.3% in October to about 2.9% in November and then to roughly 3.6% year-on-year in December, with core CPI (excluding food and energy) up from 2.7% to around 3.0%. Those prints sit comfortably above the Bank of Japan’s 2.0% target and mark the first sustained period in years where Japan’s inflation is running at or above U.S. levels; U.S. headline CPI has risen from about 2.7% to 2.9% in the same window. Against that backdrop, the BoJ has already raised its policy rate twice, lifting the benchmark from negative territory to 0.25% in 2024 and now to around 0.50%, the highest level since 2008. Market pricing at one point assigned close to a 90% probability to another 25-basis-point move, with investors focused on whether the central bank follows through in the coming meetings. Rising wages, core inflation above 3.0% and a weak yen together argue for further normalization, and every incremental BoJ hike chips away at the rate differential that previously justified a structurally weaker JPY.
Japan’s Real Economy: Modest Growth, Diverging PMIs And The Limits Of Tightening
The BoJ’s room to tighten into strength is not unlimited. Japan’s real economy is growing, but not robustly. Recent GDP data showed output expanding about 0.7% in the third quarter, with full-year growth expectations clustered near 0.4%. Survey data underline a two-speed picture: the services PMI has improved from roughly 50.9 to around 52.7, signalling modest expansion, while the manufacturing PMI has slipped from about 49.6 to 48.8, deeper into contraction territory. Higher policy rates risk squeezing an already fragile industrial base at the same time Japanese manufacturers face intense competition from Chinese automakers such as BYD, Nio and Xpeng, which are gaining market share globally. If the BoJ pushes too hard, it risks undercutting the recovery story. That trade-off is one reason the bank is unlikely to hike at every meeting, even with CPI above target, and why USD/JPY traders have to balance the medium-term normalization story with the risk that the tightening cycle pauses quickly if growth slows further.
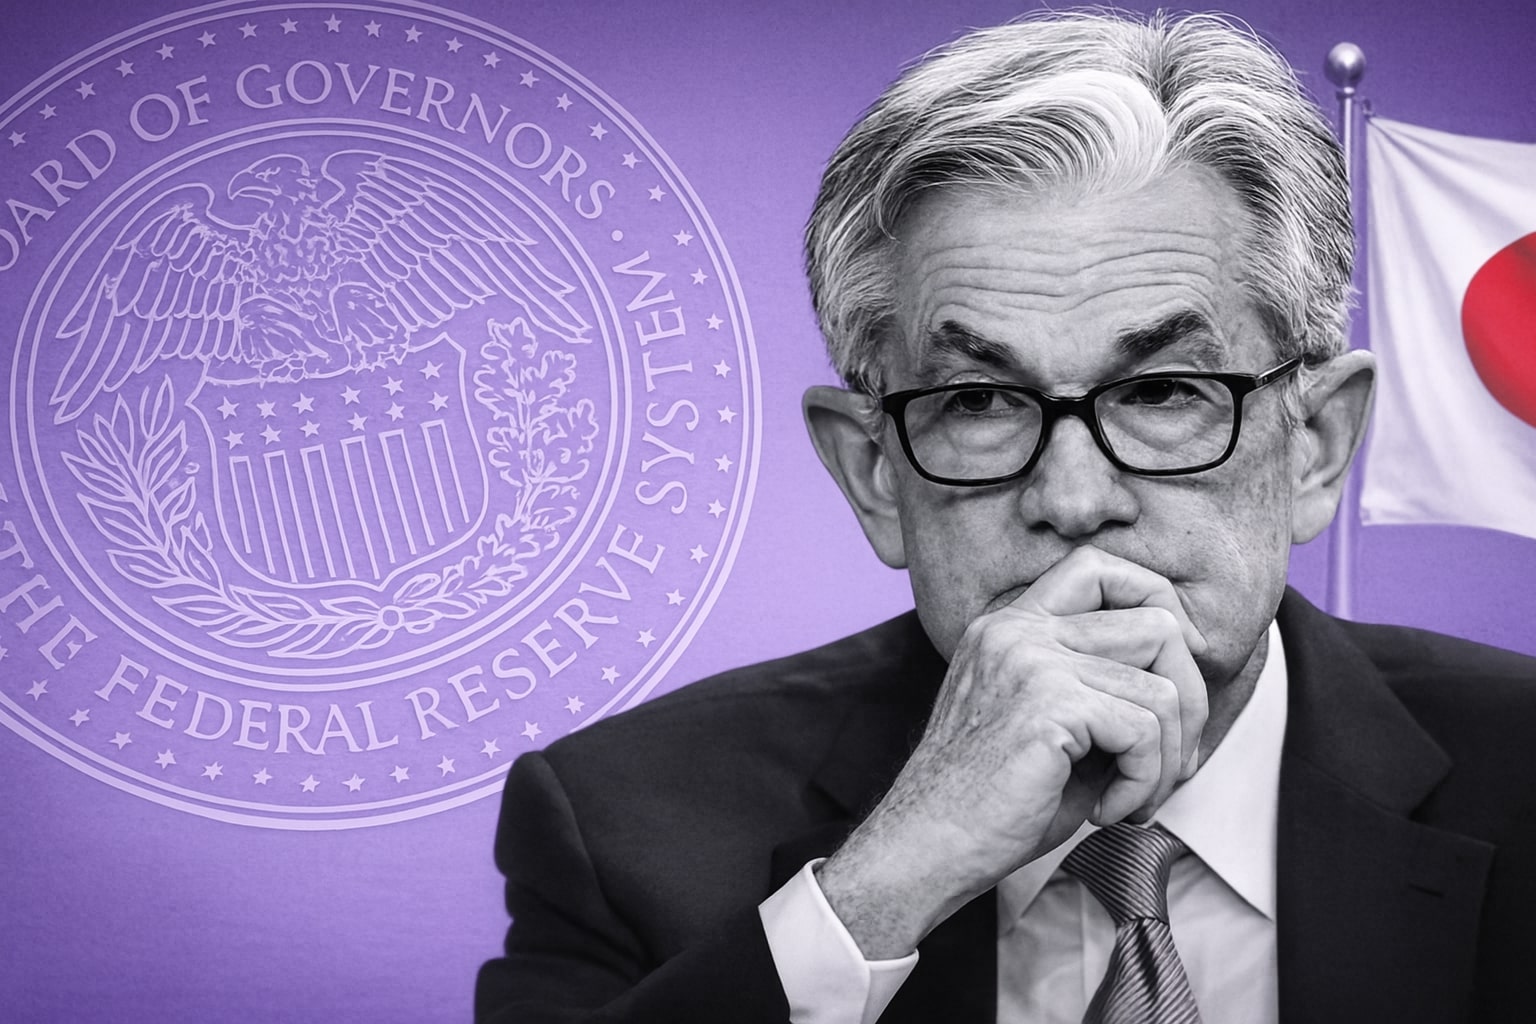
Fed Policy, Trump Tariff Risk And The US Leg Of The USD/JPY Spread
On the U.S. side of USD/JPY, the story is shifting in the opposite direction. The Federal Reserve has already delivered a 25-basis-point rate cut at its final meeting of the year, matching expectations and reinforcing the message that the peak of the cycle is behind. Officials who previously pencilled in roughly four cuts now guide toward about two reductions over the coming year, with markets expecting the first meaningful move around July if inflation drifts closer to 2.0%. Headline CPI has nudged higher from about 2.7% to 2.9%, while core inflation has edged down from roughly 3.3% to 3.2%, leaving real yields positive but no longer rising aggressively. The Fed minutes also flagged concern that a new U.S. administration could push inflation back up via aggressive tariffs; proposals for double-digit levies on imports would be a clear upside risk to prices. Labour data sit at the center of the Fed’s reaction function. Economists expect nonfarm payrolls to add around 150,000 jobs for December in one projection set and roughly 50,000 in another, with the unemployment rate seen around 4.4% on some surveys while recent readings showed a drop from about 4.2% to 4.1%. Private payrolls have disappointed at times, with one ADP print around 122,000 below forecasts, and job vacancies have hovered above 8 million, indicating a market that is cooling but not collapsing. A separate delayed NFP release showed the economy adding about 64,000 jobs in November, reinforcing the picture of slowing but still positive job creation. Taken together, the Fed leg of the spread now leans toward gradual easing rather than more hikes, which tends to cap the dollar’s upside against currencies where policy is moving the other way.
Yields, Intervention Risk And How They Shape The Ceiling In USD/JPY
Rate spreads and intervention risk are now doing as much to define the USD/JPY ceiling as classical trend signals. U.S. Treasury yields recently pulled back from their highs; the 10-year briefly dropped by roughly 5 basis points intraday before retracing to a decline closer to 1.4 basis points. As yields slipped, USD/JPY lost upside momentum, reinforcing how sensitive the pair is to marginal changes in the U.S. curve now that Japanese yields are no longer pinned at zero. At the same time, levels above 155–158 have attracted repeated verbal warnings from Japanese authorities in the past, and the 160.00 region is widely viewed as a line where outright intervention risk becomes acute. Even without visible action, the threat of official selling acts as a psychological cap; traders are less willing to accumulate long USD/JPY aggressively near recent highs when they know a surprise multi-yen drop is always possible. That mixture of softer U.S. yields, a slowly normalizing BoJ and a credible intervention overhang is exactly what has turned a one-directional rally into the current sideways and corrective phase.
Short-Term Technical Map: Moving Averages, Flags And Compression Zones In USD/JPY
Technically, USD/JPY has transitioned from a clean uptrend into a congestion regime with identifiable fault lines. On the daily chart, the pair has held above the prior breakout level near 156.78, which marked the high on 5 November and now acts as an intermediate pivot. Earlier in the move, price broke above the 78.6% retracement of the prior decline, cleared the 50-day moving average, and carved out a bullish flag, all of which supported the thrust toward 158.90 and raised the odds of a test of 160.00. The recent phase looks different. On shorter time frames, the spot rate around 154.90 is now trading beneath both the 15-day moving average near 155.76 and the 20-day moving average around 156.02, a configuration that signals near-term weakness rather than continuation. The RSI(14) has slipped to roughly 47.62, below the midpoint and consistent with fading bullish pressure. Several candles have printed lower highs under the 156.00 zone, confirming that rallies are being sold rather than chased. On the four-hour chart, the 200-bar moving average sits near 155.29 and has been probed from above and below; consecutive sessions have seen price dip under this line into a swing area around 154.78–155.04 and then snap back, signalling that buyers still defend that band on first contact. Above, the 100-bar moving average has acted as rotating resistance, trapping USD/JPY between these two reference lines and defining the current neutral corridor. Clear resistance resides in the 158.00–159.00 band; a sustained break would re-open the path back toward the year’s high at 158.90 and then the 160.00 psychological barrier. On the downside, initial support is anchored around 155.00, followed by a more important level at 154.50, which is the first line that, if lost on a closing basis, would confirm a deeper pullback. Below that, the next target sits near 153.50, with an extension toward roughly 152.50 if sellers gain full control. A separate medium-term roadmap points to about 151.00 as the zone where the rising trendline from mid-September and prior horizontal support converge, making it the key “deeper correction” waypoint if the floor under the mid-150s finally cracks.
Read More
-
FDVV Slips Near $60 as the "High Dividend" ETF's Hidden Tech Top — NVIDIA, Apple, Microsoft — Gets Caught in the AI Air Pocket
26.06.2026 · TradingNEWS ArchiveStocks
-
IBIT Drives Bitcoin ETF Flows Negative for 2026 as $7.2B Exits Across Two Record Streaks — But On-Chain Data Says Cyclical, Not Structural
26.06.2026 · TradingNEWS ArchiveCrypto
-
Natural Gas Holds $3.30 on Expiry Day as Next Week's Heat Wave Overpowers a Bearish Storage Print and Record Production
26.06.2026 · TradingNEWS ArchiveCommodities
-
Dollar-Yen Grinds to 40-Year Highs Near ¥161.70 as the Warsh Fed Keeps the Rate Gap Wide and Tokyo's Intervention Threat Loses Its Bite
26.06.2026 · TradingNEWS ArchiveForex
Momentum, Flows And Positioning Around USD/JPY
Positioning and flow data are consistent with a market that has cooled from euphoria into caution without fully flipping to bearish. Leveraged funds have started trimming long USD/JPY exposure rather than adding to it, reducing the risk of a classic blow-off top but also removing some of the fuel that previously powered every dip-buying attempt. Options markets show a visible increase in demand for short-dated downside protection; more traders are paying for puts that hedge moves lower into the 154.50–153.50 region, which is typical when a trend pauses and participants start to respect the downside. Retail positioning remains net long but is no longer expanding aggressively, another sign that the “easy” long trade from sub-150 levels has passed. The tone of short-term momentum indicators lines up with this behavioural shift: the flattening of key moving averages, the RSI sliding back toward neutral, and the repeated failures to break higher all describe a pair that is digesting gains rather than launching into a fresh leg up.
Event Tape And Catalysts: NFP, CPI, BoJ And Wage Talks As Direction Setters For USD/JPY
The next decisive move in USD/JPY is likely to be triggered by macro catalysts rather than pure chart dynamics. The immediate calendar is loaded. On the U.S. side, traders are watching a cluster of data including nonfarm payrolls, retail sales and inflation. Consensus estimates center around monthly job gains of roughly 50,000–150,000, an unemployment rate near 4.4%, and headline CPI hovering around 2.9% with core near 3.2%. The recent delayed NFP release showing about 64,000 new jobs in November has already demonstrated how sensitive markets are to signs of labour-market cooling; another soft print would reinforce expectations for multiple Fed cuts in 2026, weigh on U.S. yields and favour downside in USD/JPY. On the Japanese side, the focus is on the upcoming BoJ decision and inflation data. With policy already lifted to about 0.50% and inflation running around 3.6% year-on-year, the central bank’s guidance on future hikes matters as much as the actual move. Spring wage negotiations are a key structural driver; major unions are targeting pay increases on the order of 5%, and if those settlements land near that mark, the BoJ has a stronger case to keep tightening, which in turn supports the yen. Parallel commentary from market desks stresses that a break below the 50-day moving average and the rising trendline from 16 September would validate the idea that the BoJ–Fed divergence is finally feeding through fully into price, with 154.00–151.00 the logical follow-through band. Until those catalysts hit, the pair is essentially coiling between defined supports and resistances waiting for a shove.
Strategic Stance On USD/JPY: Bearish Bias, Sell Rallies Into 158–159 With Targets Toward 154 And 151
After combining the macro, technical and positioning signals, the balance of evidence argues for a bearish bias on USD/JPY, with a preference to sell strength rather than chase the prior uptrend. The bullish case rests on the Fed staying tighter for longer than markets expect, U.S. yields re-accelerating higher and the BoJ blinking in the face of weak growth despite inflation above target. The numbers at the moment do not fully support that path. Japan has moved its policy rate from negative levels up to around 0.50%, wage growth has accelerated from 2.2% to roughly 3.0%, core CPI has climbed to about 3.0%, and headline inflation sits near 3.6%, all of which justify further normalization. In the U.S., the Fed has already cut once, telegraphed only about two more reductions, and is watching an economy where payroll growth has slowed toward 64,000–150,000 per month and unemployment is drifting around 4.1–4.4%. Short-term technicals show USD/JPY trading below the 15-day and 20-day moving averages, with the RSI near 47.6, repeated failures above 156.00 and heavy resistance in the 158–159 area. Key support sits around 155.00, then 154.50, with a more meaningful downside objective near 153.50–151.00 if those levels break. In this configuration, the highest-quality trade expression is to treat spikes toward 158.00–159.00 as opportunities to establish or add to short USD/JPY exposure, with stop levels defined above the 158.90–160.00 band and downside targets staged first around 154.50, then 153.50, and ultimately near 151.00 if BoJ–Fed divergence and softer U.S. data continue to assert themselves. That profile aligns with a Sell stance on USD/JPY rather than Buy or Hold, recognizing that intervention risk and event-driven volatility remain high but that the data now lean in favour of a stronger yen over the next leg.
That's TradingNEWS
Related Articles


