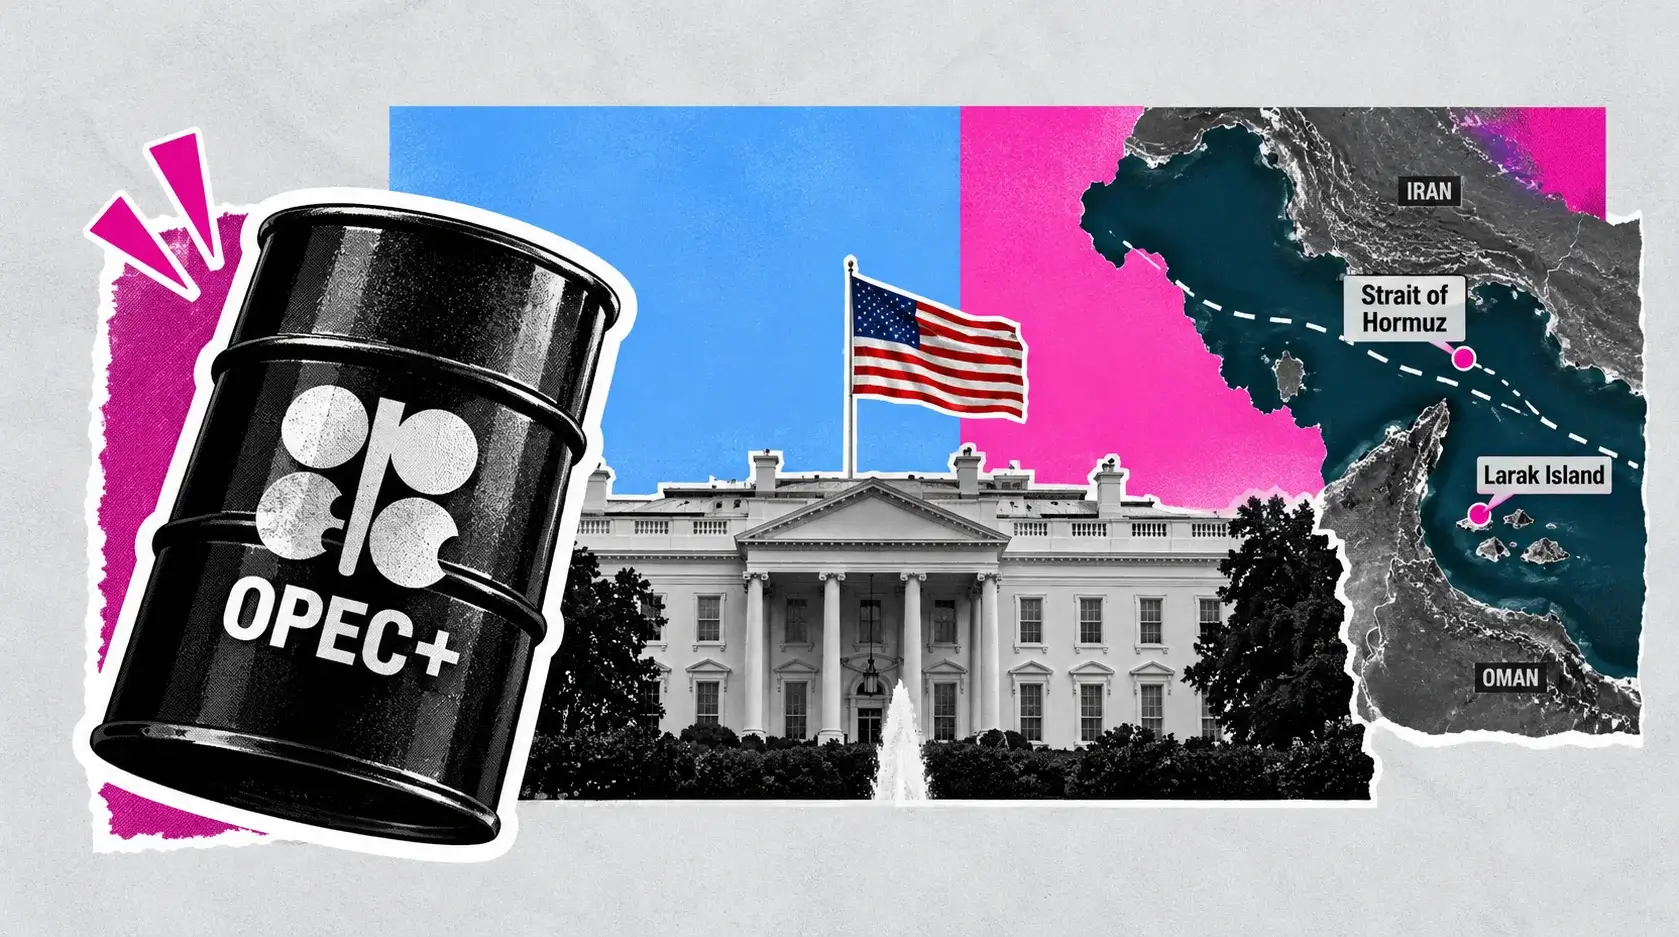
WTI at $87.47 Slides to a Four-Week Low, Brent BZ=F Trades $98.08 — Sellers Eye the 100-Day Average at $84.35
Saudi Aramco cut November Arab Light to Asia by $3 and Kuwait is back to 75% of pre-war output | That's TradingNEWS
Key Points
- WTI trades $87.47, down 2.19%, after breaking the $88.06 October low; Brent is $98.08, down 2.23%.
- Saudi Aramco set November Arab Light to Asia at $5 under benchmark, from $2 under in October.
- WTI support sits at $85.76 and the 100-day average at $84.35; resistance is $92.90.
West Texas Intermediate crude for November delivery fell $1.96 to $87.47 a barrel on Tuesday, a decline of 2.19%, and traded as low as $87.09. Brent for December dropped $2.24 to $98.08, down 2.23%, with a session low of $97.89. Both benchmarks had been higher in Asian hours. WTI touched $90.01 and Brent reached $100.94 before sellers took control in the European morning.
Two levels gave way. WTI went through $88.06, the low from October 2 and the weakest print in four weeks, which had been the last reference holding the September range together. Brent closed Monday at $100.32 and spent most of Tuesday under $100, a level that had been treated as a floor since the Gulf conflict pushed prices to their highs.
The catalyst is supply returning faster than the market had priced. Saudi Aramco cut its November official selling price for Arab Light to Asia to $5 a barrel below the regional benchmark, from a $2 discount for October. A $3 deepening of the discount in one month is what a producer does when it has barrels to place and competitors to undercut. Gulf oil flows excluding Iran recovered to more than 81% of pre-war levels in September. The Group of Seven committed 100 million barrels of emergency stocks over four months. Kuwait says it is producing at 75% of pre-war capacity.
The thesis of this piece is that crude is repricing the war premium out of the front of the curve, and the move has further to run in WTI. The next supports are $85.76, $85.58 and the 100-day moving average at $84.35. Rallies back toward $89.36 to $92.90 are likely to be sold while the supply data keep improving.
That view comes with a hard limit. Global inventories have fallen by 400 million barrels this year. The U.S. Strategic Petroleum Reserve is at 283 million barrels, the lowest since October 1982. Tankers are still being attacked in and around the Strait of Hormuz. Prices are 49% above where they were a year ago for a reason, and the physical cushion that would normally absorb a new disruption has been spent. Crude can fall another $3 on better flows and still be one incident away from $100.
WTI is down 5.98% over a month and 25.6% below its 52-week high of $117.63. The 52-week low is $54.98.
Tuesday's Session: Up in Asia, Down $2.92 From the High by New York
The day reversed sharply between the Asian and European sessions.
Crude opened firm. At 03:30 GMT Brent was up 27 cents at $100.59 and WTI was up 30 cents at $89.73. The bid came from overnight security headlines. Saudi-backed Yemeni government forces had retaken the coast around the Bab el-Mandeb Strait up to the city of Mocha on Monday, and the Houthis responded by claiming strikes on targets inside Saudi Arabia, including an Aramco refinery at Rabigh. The claims were not verified. WTI extended to $90.01 and Brent to $100.94, each up 0.62%.
That was the high. WTI had recovered above $89.43 after a pullback to $89.11, and technicians were watching whether former resistance at that level would hold as support. It did not. Immediate resistance at $89.80 to $89.84 capped the move, and the $90 round number rejected price within minutes of the test.
The selling built through the London morning as the details of the Saudi price cut circulated and as shipping data on September flows were digested. By 06:00 Eastern, WTI was at $87.48, down 2.18%. It printed $87.09 around 09:08, down 2.62%, the low of the day. A modest bounce to $87.88 followed at the U.S. equity open, and the contract settled into a range around $87.27 to $87.47.
From the Asian high to the New York low, WTI fell $2.92, or 3.2%. Brent's range was $97.89 to $100.94, a $3.05 swing.
The break of $88.06 was the technical event. That level had been identified as the low on the continuous chart from October 2. Beneath it, a published support at $87.30 was tested almost immediately. A four-hour setup issued Tuesday morning had looked for a bounce from $89.36, a pullback support just below a 61.8% retracement, with a target of $95.45. Price went straight through, which activates the alternative scenario pointing to $85.76.
Equities took the decline as good news. The S&P 500 opened at a record. American Airlines rose 3.00%. Offshore driller Transocean fell 2.35%. The Brent-to-WTI spread held at $10.61, wide by historical standards and a reflection of how much of the supply risk sits in seaborne barrels east of Suez.
The Saudi Price Cut: From $2 Under to $5 Under the Benchmark
The single most informative data point of the week is a price list.
Saudi Aramco set its November official selling price for Arab Light crude to Asian buyers at $5 a barrel below the regional benchmark. The October price had been $2 below. Asia takes the majority of Saudi exports, and the monthly price is the kingdom's main tool for signaling how it sees supply and demand.
Three things can be inferred from a $3 deepening of the discount.
The first is that the barrels are there. A producer struggling to load cargoes does not cut prices to attract buyers. Saudi exports led the September recovery in Gulf flows, and the kingdom is now loading crude from both its Persian Gulf terminals and its Red Sea coast. The East-West pipeline, which carries crude across the peninsula to bypass the Strait of Hormuz, has returned to service. It had been shut on September 11 as a precaution after an attack on a pumping station the previous day, and its 7 million barrel-a-day capacity is the difference between Saudi Arabia being a constrained exporter and a flexible one.
The second is competition. Other Gulf producers are also restoring output. Kuwait is at 75% of pre-war levels. Regional crude exports exceeded pre-war volumes on four days in the last week of September. One estimate puts total Gulf exports, including shipments that are not publicly declared, at 23.3 million barrels a day, in line with the 2025 average. When several sellers return to the same market at once, the largest one defends its share with price.
The third is delivered cost. Freight from the Gulf to Asia has climbed to record highs because of insurance, rerouting and the shortage of ships willing to transit the region. A wider discount on the crude offsets part of the higher shipping bill for the buyer. Some of the $3 is compensation for freight and not a pure view on oversupply.
That last point is the caution in reading the price cut too bearishly. Barrels are moving, but the cost, insurance, routing and security risk of moving them remain elevated. A recovery in volume that depends on a military escort and record freight rates is more fragile than one that does not.
For price, the message was unambiguous on Tuesday. The marginal barrel in Asia just got $3 cheaper relative to benchmark, and futures followed.
The G7 Release: 100 Million Barrels, and How Many Are New
Consuming governments added to the supply picture on Friday, and the fine print matters.
The Group of Seven agreed to release 100 million barrels of oil and petroleum products through the International Energy Agency over four months, beginning immediately. The statement specified a frontloaded, substantial diesel release within the first 20 days by members and partners. Members also pledged to refrain from energy export restrictions on one another. The decision followed a week of pressure from Washington on European governments to release diesel stocks.
Spread evenly, 100 million barrels over four months is 833,000 barrels a day. Concentrated in diesel over 20 days, the early flow is much larger in the product that has been tightest. U.S. diesel averaged $6.37 a gallon at the time of the announcement, a record. European discussions had contemplated 50 million barrels of diesel from European stocks with a further 50 million barrels of crude from other agency members.
The open question is whether the barrels are additional. The agency coordinated a 400-million-barrel emergency release in March after the conflict began, and roughly two-thirds of that has been delivered. The G7 statement can be read as implementing the remainder of the March commitment on a defined schedule, and several market participants have interpreted it that way. If so, the 100 million barrels were already in supply forecasts and what changed is the timing and the diesel emphasis.
Either reading is bearish for near-term prices, which is how the market traded it. A scheduled flow of stocks into a tight product market caps rallies for the next several weeks.
The longer-term arithmetic runs the other way. Every barrel released from emergency reserves is a barrel that has to be bought back. The U.S. Strategic Petroleum Reserve has fallen to 283 million barrels, its lowest level since October 1982, and the administration is planning a further sale. The head of Saudi Aramco said crude and refined fuel supplies are expected to remain stretched and that refilling global stockpiles after the emergency withdrawals may take two years.
Washington has also acted on the product side directly. An executive order signed Monday evening temporarily allows red-dyed off-road diesel, which is exempt from the 24.4-cent federal highway tax, to be used on public roads and defers the related taxes through year-end.
Reserve releases lower today's price by borrowing from tomorrow's supply. With government inventories at multi-decade lows, there is less left to borrow.
Gulf Flows: 81% of Pre-War Levels, With Iran at Zero
The recovery in Middle East exports is the foundation of the bearish case, and its composition deserves a close look.
Gulf oil flows excluding Iran rose to more than 81% of pre-war levels in September. Saudi Arabia led the rebound despite attacks on its infrastructure. On four days during the final week of the month, regional crude exports exceeded pre-war volumes outright. For half of September, Gulf exporters as a group shipped more than they had before the conflict.
The mechanisms were logistical. Producers shifted loadings to terminals outside the Strait of Hormuz where they could. Saudi Arabia ran its cross-country pipeline to the Red Sea. Tankers transiting the strait have used a southern route close to the coast of Oman under U.S. naval protection. Kuwait restored three-quarters of its production.
Iran is the exception. Its exports fell to zero in September under a U.S. blockade. That removes a supplier that had been shipping well over a million barrels a day before the war, and it means the 81% figure for the rest of the Gulf understates how much total regional supply is still missing.
The producer group has not added to the pressure. OPEC+ agreed on Sunday to keep output quotas unchanged for the coming month. It also delayed a review of 2027 quotas, citing the disruption the conflict has caused to capacity expansion projects across the region. Spare capacity, concentrated in Saudi Arabia and the United Arab Emirates, was estimated before the war at 2.5 million barrels a day, less than 3% of world supply.
The security situation is the qualifier on all of this. Almost 20 commercial vessels, most of them tankers, have been attacked over the past month while sailing through the Strait of Hormuz, the Persian Gulf or off Oman. Iran struck two ships for every 100 that crossed the strait in the third quarter. The number of incidents has risen in recent days. The United States has deployed Patriot batteries to protect Saudi oil facilities and Qatari gas installations.
Assessments from energy desks describe the current system as fragile, with terminals and refineries offering targets through which control over regional flows could be reasserted. There has been no progress in talks between Washington and Tehran. There has also been no major escalation, and that quieter backdrop is what has allowed prices to drift lower. Some traders expect the conflict to intensify again after the U.S. midterm elections in November.
The flows have recovered because of military protection and rerouting, and a negotiated settlement is still absent.
Inventories: 400 Million Barrels Drawn, an SPR at a 44-Year Low
The bullish counterweight to recovering flows is how empty the tanks are.
The Energy Information Administration estimated in September that global oil inventories had fallen by 400 million barrels so far in 2026, and it forecast further declines through year-end. That is the stock draw that carried the world through the supply loss. Brent averaged $91 a barrel in August, $7 higher than July, and the agency projected an average near $90 for the second half. Its October outlook was scheduled for release on Tuesday.
Distillates are the tightest part of the system. The agency forecast U.S. distillate fuel inventories would drop below 100 million barrels in September and remain under the five-year low through much of 2027. Global distillate production is running below last year's level, which pulls U.S. product into export markets and keeps domestic diesel prices high. That is the background to a national average above $6 a gallon and to the G7's decision to lead its release with diesel.
Strategic stocks are depleted. The U.S. reserve holds 283 million barrels. Members of the International Energy Agency have delivered two-thirds of a 400-million-barrel emergency commitment made in March. Asia's capacity to keep absorbing the shock has been described by a multilateral lender as too thin.
Weekly U.S. data have been mixed. The most recent government report showed commercial crude inventories rising by 1.02 million barrels, an unexpected build that took some heat out of the late-September rally. Product stocks fell: distillates by 2.25 million barrels and gasoline by 1.68 million. Refinery utilization slipped 1.5 percentage points. The industry's weekly estimate arrives Tuesday evening after a prior build of 1.02 million barrels, and the official figures follow Wednesday.
Low inventories change how the market behaves. With a normal cushion, a supply interruption is met from storage and prices rise modestly. With 400 million barrels already drawn and government reserves at multi-decade lows, the same interruption has to be met by destroying demand, and that requires much higher prices. This is why market participants remain reluctant to believe lower prices can be sustained, even on a day when they are falling.
The result is an asymmetric distribution. On improving flows, crude can grind down a few dollars at a time. On a successful strike against a terminal, a pipeline or a loaded tanker, it would reprice by $10 or more in a session.
Read More
-
Yen Stalls at 160 Despite a 3% JGB and Tokyo Core CPI at 2.0% — Intervention Sits at 164, Friday's Payrolls Decide
02.09.2026 · TradingNEWS ArchiveEnergy
-
Nebius Breaks Above $250 After 30% September Drawdown — Buy on Pullbacks Toward $237–$244
06.10.2026 · TradingNEWS ArchiveStocks
-
XRP at $1.52 Tests the Top of Its 4-Hour Triangle — Breakout Above $1.66 Opens $2.00, Support at $1.457
06.10.2026 · TradingNEWS ArchiveCrypto
-
Gold ($4,170) Bounces $66 Off Session Low on Softer Treasuries — Reversal Needs a Close Above $4,230
06.10.2026 · TradingNEWS ArchiveCommodities
-
S&P 500 Sets Record Above 7,816, Nasdaq Hits 27,638, Dow Adds 335 Points; Option Care OPCH +32.9%
06.10.2026 · TradingNEWS ArchiveMarkets
-
Pound at 1.3247 Holds 3-Day Range After 3 Weekly Losses — BoE Speakers and October 28 Budget Decide the Break
06.10.2026 · TradingNEWS ArchiveForex
WTI Technicals: Below the 50-Day, With $85.76 and $84.35 Underneath
The chart turned more negative on Tuesday with the loss of several closely spaced supports.
WTI had been holding a shelf between $88.06 and $88.64. That band included the October 2 low, a flat support at $88.52 to $88.54 that had held on September 6 and September 23, a price pivot at $88.35, and the August swing high at $88.64. The 50-day moving average was near $89.39. All of those are now above the market. A four-hour pullback support at $89.36, close to a 61.8% retracement, failed in the European morning.
The next references are $87.30, tested on Tuesday, then $85.76, which lines up with the 78.6% retracement and is the stated target once $89.36 broke. The lower Bollinger Band on the daily chart is at $85.58. A further level sits at $85.09. Beneath those, a rising channel that has contained the advance has its lower boundary near $84.60, and the 100-day moving average is at $84.35. That cluster between $84.35 and $85.76 is the first zone where a durable low could form.
A clean break of the 100-day average would open a deeper correction. Published supports below it are $82.67, $80.53 and $80.29, with a model level at $79.62.
Overhead, broken supports become resistance. The first band is $88.06 to $88.64. Then come $89.36 to $89.51, $89.80 to $89.84 and $90. Above that the levels are $91.20, $91.88 to $92.02, and $92.90, where a descending trendline from the September high meets horizontal resistance. One technical view is explicit that it favors the downside until WTI trades above $92.90. The middle Bollinger Band is at $93.35.
Further out, $95.06 is the level bulls need to reclaim quickly to keep the broader uptrend channel intact, with $95.45 and $95.54 beside it. Thursday's bullish reversal topped at $96.25. Resistance continues at $96.74 and $97.68, and $100.43 to $100.63 would have to be decisively recovered to restore the larger advance. The upper Bollinger Band is at $101.10 and the cycle high anchor on the four-hour chart is $101.85.
Trend-strength readings are weak. The average directional index is at 9, far below the 25 to 30 that marks a strong trend, which fits a market moving on headlines more than on momentum. Intraday signals on the 30-minute and four-hour charts read sell. Price has found acceptance below the 200-period average on the four-hour chart.
WTI is down 16% from its September high.
Brent Technicals: $98.71 Broken, $95.64 Next, $103.89 the Ceiling
Brent's structure is simpler and hinges on the round number it lost.
The international benchmark had bounced from $95.64 support in late September and was holding above $98.71 on the four-hour chart heading into Tuesday. It traded as high as $100.94 in Asia. The decline to $97.89 took out $98.71 and returned price to the lower half of the recent range.
Support now sits at $95.64, the base of the prior bounce. That is $2.44 below the current price, a decline of 2.5%. A break would mark a new low for the move and would shift attention to the low $90s, where the agency's second-half average forecast of $90 sits.
Resistance begins at $100 and the Monday settlement of $100.32. Above that, the daily pivot grid places first support-turned-resistance at $103.37, and $103.89 is identified as the key breakout test. Brent has not cleared $103.89 since the selloff began. Further resistance is at $108.14.
The $100 level carries more than technical weight. It was described as an anchor for the market as recently as Tuesday morning, and governments have treated triple-digit crude as the threshold of political pain. Brent above $100 has been cited as high enough to feed inflation expectations and keep central banks from easing. A sustained move below it changes that conversation, which is part of why equity markets responded so positively.
Longer-term context shows how elevated the price still is. Brent was at $65.94 a year ago, so $98.08 is 48.7% higher. Over the past month the benchmark is up 0.95%, while WTI is down 5.98%. That divergence has widened the spread between them to $10.61.
The spread itself is information. WTI reflects conditions in the landlocked U.S. market, where production is high and exports are constrained by shipping capacity. Brent reflects the seaborne market, where the supply loss occurred. A wide spread encourages U.S. exports and signals that the tightness is concentrated outside North America. If Gulf flows keep normalizing, the spread should narrow, with Brent falling faster than WTI.
Model-based projections for quarter-end are well above current prices: $106.60 for Brent and $95.28 for WTI. Average published forecasts for 2026 as a whole sit lower, at $92 for Brent and $86 for WTI. Spot WTI at $87.47 is within $1.50 of that full-year average, while spot Brent is $6 above its equivalent.
Demand and Macro: A Record S&P 500, a 5.27% Ten-Year and $6 Diesel
The demand side of the ledger is steadier than the supply side, with one notable weak spot.
U.S. growth is firm. Third-quarter output is tracking at a 3.7% annualized rate. The August trade report showed imports rising $17.2 billion to $420.8 billion, a sign of strong domestic demand. Corporate earnings for the third quarter are forecast to grow almost 30%. The S&P 500 set a record on Tuesday.
Consumers are paying for it. Americans are spending an estimated $700 million more per day on gasoline and diesel than a year ago. Diesel at more than $6 a gallon feeds directly into freight, farming and construction costs. A services-sector survey for September showed prices paid rising at the fastest pace in more than four years. Consumer confidence remains depressed by high mortgage rates and fuel prices.
That inflation is shaping monetary policy, which in turn affects oil demand. The Federal Reserve raised rates in September. The 10-year Treasury yield closed Monday at 5.31%, the highest in 24 years, and eased to 5.27% on Tuesday as crude fell. Futures assign a 78% probability to no change at the October meeting, with December still open. Lower oil prices are among the few things that could let the central bank stand down, and the bond market's reaction on Tuesday showed how closely the two are linked.
The dollar is a headwind for crude. The dollar index reached an 18-month high of 102.535 on Monday before slipping to 101.79. A strong dollar raises the local-currency cost of oil for importers in Europe and Asia, where demand is already under pressure from high prices.
Europe is the soft spot. German factory orders fell 10.6% in August. Euro-area retail sales rose 0.1%. French industrial production declined 0.3%. Producer prices in the euro area are 8.2% higher than a year ago, largely on energy. The region is a large net importer and has borne more of the price shock than the United States.
Asia's position is mixed. Record freight rates from the Gulf raise delivered costs, and a multilateral lender has warned that the region's buffers are too thin to keep absorbing the shock. The deeper Saudi discount helps at the margin.
Gas markets add to the picture. Liquefied natural gas prices have surged, and the head of a major Asian producer warned of severe risks for the sector. High gas prices support demand for oil-based fuels in power generation where switching is possible.
Demand has held up better than $100 Brent would suggest, mainly because the U.S. economy is growing at close to 4%. Lower crude from here would support it further.
Geopolitical Risk: Hormuz, Bab el-Mandeb and the Rabigh Claim
The risk premium has shrunk, and the events that created it are still unfolding.
The conflict between the United States, Israel and Iran remains unresolved. Talks between Washington and Tehran are stalled. Iran's oil exports are at zero under a U.S. blockade. The Treasury has issued a notice to foreign banks doing business with Iran. The U.S. president described the war as almost over at a rally this week, and there is no agreement that would make that formal.
Shipping is the pressure point. Almost 20 commercial ships have been attacked in a month across the Strait of Hormuz, the Persian Gulf and the waters off Oman. The attack rate of two per 100 transits in the third quarter is high enough to keep insurance costs and freight at records, and low enough that most cargoes get through. Flows through the strait depend on a U.S. military commitment to protect tankers along a southern route.
A second front runs through Yemen. Saudi-backed government forces advanced on Monday to retake the Red Sea coast up to Mocha, near the Bab el-Mandeb Strait. Control of that waterway matters for Saudi exports from the Red Sea terminals that the East-West pipeline feeds. The Houthis denied losing ground and claimed to have struck Saudi Arabia's main airport, a refinery and other sites, with a claimed toll of 200 Saudi security personnel killed or wounded. One of the named targets was the Aramco refinery at Rabigh. None of the claims has been independently confirmed.
Saudi infrastructure has been hit before in this conflict. The pumping-station attack on September 10 shut the kingdom's main bypass pipeline for a period, and in mid-September at least two European refiners were told they would receive no Saudi crude in October. The system recovered within weeks. It showed how quickly a single strike can remove millions of barrels a day from the market.
Two scenarios bracket the outlook. In the first, the current stalemate continues, military protection keeps tankers moving, and exports keep normalizing. Crude drifts lower in that case, as it has for a month. In the second, an attack succeeds against a major terminal, the pipeline or a refinery, or the conflict escalates after the U.S. midterm elections as some expect. In that case the absence of spare inventory would turn a supply loss directly into a price spike.
A negotiated settlement would be the most bearish outcome of all for crude, since it would restore Iranian exports and remove the security cost from every Gulf cargo. There is no sign of one.
The market on Tuesday was trading the first scenario. Positioning for it means accepting exposure to the second.
Positioning and Cross-Asset Signals
How other markets traded Tuesday's decline shows what lower oil is worth to them.
Equities rallied on it. The S&P 500 gained 0.53% at the open to a record, the Dow added more than 300 points at its high, and the Russell 2000 rose 0.50%. Airlines were among the most direct beneficiaries, with American Airlines up 3.00%. Energy shares lagged after leading the index on Monday. Sunoco had already dropped 6.48% in the prior session.
Bonds moved with crude. The 10-year yield fell 4.5 basis points to 5.268% and the 30-year fell 3.9 basis points to 5.625%. Energy is the largest swing factor in headline inflation, and the long end has been trading oil as a proxy for how long the Federal Reserve has to stay restrictive. Speculators hold a net short of 900,615 contracts in 10-year Treasury futures, so any further decline in crude that pulls yields lower would force covering.
Gold rose as oil fell, an unusual pairing that makes sense in this cycle. Spot gold gained 0.71% to $4,169.74 because lower crude meant lower yields. In 2026 gold has traded inversely to rate expectations more than as an inflation hedge.
Currencies of energy importers benefited. The euro rose 0.34% to 1.1260, helped by calmer French bond markets and by the improvement in the euro area's terms of trade when crude falls. European equities gained 1.0%, with the move attributed in part to the decline across the energy complex.
Natural gas diverged, with U.S. futures up 0.46% at $3.08.
Credit markets tied to energy are worth watching. U.S. shale producers are profitable at $87 WTI, and the decline so far does not threaten drilling budgets. Offshore and service names are more sensitive.
For crude itself, the absence of a strong trend on technical measures and the dominance of headline risk suggest positioning is light on both sides. Rallies have been sold at trendline resistance on each attempt since early September, and dips had been bought at $88 until Tuesday. The break of that level removes the buyers who were defending it and leaves the market looking for the next group, most likely near the 100-day average.
The API report on Tuesday evening and the government inventory data on Wednesday are the next scheduled inputs. A second consecutive crude build would reinforce the move. A large draw, especially in distillates, would remind the market how thin stocks are.
What to Watch: Inventory Data, the EIA Outlook and the November Midterms
The near-term calendar is dense, and the longer-dated risks are political.
Tuesday evening brings the American Petroleum Institute's weekly estimate. Last week it showed a crude build of 1.02 million barrels. Wednesday's government report covers crude, gasoline, distillates, refinery runs and exports. Distillate stocks, already forecast below 100 million barrels, are the number most likely to move prices. Cushing inventories rose 553,000 barrels in the prior week.
The Energy Information Administration's October Short-Term Energy Outlook was due Tuesday. The September edition forecast Brent near $90 for the second half and continued inventory draws through year-end. Any change to the stock-draw estimate or to the price path will be read as the official view of how quickly the market is rebalancing.
The first 20 days of the G7 release run to late October. Evidence that diesel is actually reaching the market, in the form of lower crack spreads and retail prices, would confirm the policy is working. U.S. diesel at $6.37 is the benchmark to watch.
Saudi export data and tanker tracking for early October will show whether the September recovery is holding after the latest Houthi claims. Any confirmed damage at Rabigh or to the East-West pipeline would change the picture immediately.
OPEC+ meets monthly. The group left quotas unchanged for the coming month and postponed its 2027 review. A decision to add supply into a falling market is unlikely, and a decision to cut would be difficult to justify with Brent near $100.
On the macro side, the U.S. consumer price index for September is due October 14. Energy will lift the headline. The Federal Reserve meets at the end of the month. U.S. bond markets are closed Monday, October 12.
Then come the midterm elections in early November. Fuel prices are a central issue, which explains the pressure on allies to release stocks, the dyed-diesel order and the planned reserve sale. Several market participants expect military action against Iran to intensify once the vote has passed. If that view is correct, the weeks before the election are the window in which policy is most focused on pushing prices down, and the weeks after carry the higher escalation risk.
Winter is the final variable. Northern Hemisphere heating demand rises from November, distillate inventories are at multi-year lows, and the emergency release is scheduled to taper by February.
Verdict: Bearish Near Term, Sell Rallies Below $92.90, With $84.35 the Target
Crude is falling for sound reasons, and the decline has room to extend before it meets the factors that will stop it.
The near-term case is bearish. Saudi Arabia deepened its Asian discount by $3 in a month. Gulf flows outside Iran are above 81% of pre-war levels and exceeded them on several days. The G7 is putting 100 million barrels into the market with diesel first. Kuwait is back to 75%. OPEC+ is holding quotas steady. WTI has broken $88.06 and trades below its 50-day average, with a descending trendline capping every rally since early September. Brent has lost $100.
The targets follow from the chart. For WTI, the first is $85.76, then $85.58, and then the 100-day moving average at $84.35, a decline of 3.6% from $87.47. For Brent, the objective is $95.64, 2.5% lower. Rallies into $89.36 to $92.90 on WTI and toward $100.32 on Brent are opportunities to sell while the supply data hold.
The stance changes on a daily close above $92.90 for WTI, which would break the downtrend line. A close above $95.06 would restore the broader uptrend channel and point back toward $100.43.
The reason to size any short position conservatively is the inventory picture. Stocks are down 400 million barrels this year. The U.S. strategic reserve is at a 44-year low and being drawn further. Distillate inventories are below 100 million barrels. Spare capacity is under 3% of world supply. Freight is at records. Tankers are being attacked at a rate of two per 100 transits. The recovery in flows depends on naval escorts and a pipeline that was shut by an attack four weeks ago.
For that reason the $84.35 to $85.76 zone is also where the trade should be closed. A market with no cushion does not sustain prices far below its 100-day average while a war is unresolved, and model forecasts for quarter-end sit at $95.28 for WTI and $106.60 for Brent.
For longer-horizon positions the call is hold. The structural floor under crude is higher than it was a year ago, when Brent was $65.94, and the eventual need to rebuild 400 million barrels of commercial stocks and several hundred million of strategic reserves is a source of demand that will last into 2028.
The next $3 in WTI is more likely down than up. A single confirmed strike on Gulf export infrastructure would be worth $10 or more in the other direction, and positions should be sized with that in mind.