Brent Crude Stays Above $100 and WTI Slides Toward $88 as Gulf Exports Top Pre-War Levels While Hormuz Remains Shut
The Brent-WTI spread widens to $11.30 with Murban at $110 and U.S. crude stocks up 922,000 barrels | That's TradingNEWS
Key Points
- WTI trades at $90.00, down 1.2%, after holding the $88.06 to $88.79 zone on six sessions.
- Brent is at $101.30, down 0.9%, with an $11.30 premium to WTI, up from $8.41 on October 1.
- The G7 will release 100M barrels over four months against a 507M-barrel global stock draw.
Crude is lower on Monday. West Texas Intermediate for November trades at $90.00 a barrel, down $1.11 or 1.2% from Friday's $91.11 settlement. Brent for December is at $101.30, down $0.95 or 0.9% from $102.25. Brent had been higher earlier in the session, touching the $102.90 to $103.00 area in European hours before sellers took control. The spread between the two stands at $11.30.
The day's news explains the split within the session. Over the weekend OPEC+ agreed to hold November output targets unchanged. The G7 is preparing to release 100 million barrels of emergency crude and fuel. Middle East exports exceeded pre-war levels on four days in the final week of September. Saudi Arabia cut its official selling price for November Arab Light. Each of those points to more barrels reaching the market, and they pushed WTI toward the bottom of its range.
Against that, the chief executive of Saudi Aramco told an industry forum in London that global oil inventories have become dangerously thin, that the seven-month conflict has removed nearly 3 billion barrels of regional supply, and that rebuilding stocks could take two years after the Strait of Hormuz reopens. Iran restated that the strait stays shut until Washington meets seven conditions. Fighting intensified around the Bab el-Mandeb Strait in Yemen.
The market is pricing both sets of facts at once, and it is doing so through different instruments. WTI reflects a well-supplied U.S. system with crude stocks above the five-year average and production near 13.9 million barrels a day. Brent reflects a seaborne market where physical cargoes are scarce and Abu Dhabi's Murban grade trades at $110.
That divergence is the forecast. Flows are improving, which caps the upside and explains why WTI is down 14.8% from its September 16 high of $105.63. Stocks are depleted, which holds the floor and explains why Brent has not closed below $96.76 in the same period. Until Hormuz reopens or inventories stop falling, Brent trades between roughly $97 and $104 with spikes on headlines, and WTI's $88 shelf is the level that matters for the next leg.
The Path Here: From $105.63 to an $88 Floor
WTI has spent three weeks unwinding a spike and two weeks building a base.
The September peak came on the 16th, when front-month WTI traded to $105.63 and settled at $102.43 after a fresh round of attacks in the Gulf. Two days later the contract fell 5.7% in one session to $96.08 as reports emerged of rising tanker traffic through Hormuz. Further declines of 3.9% on September 21 and 3.5% on September 29 carried it to $89.38.
Since then the tape has been violent and directionless. WTI gained 2.7% on September 24, lost 2.3% the next day, dropped 3.5% on September 29, rose 2.7% on October 1 when China suspended fuel exports, and fell 1.9% on Friday. Daily ranges of $4 to $5 have been normal. Friday's range ran from $93.51 to $88.06, a span of $5.45.
Through that noise one feature has been constant. WTI has found buyers between $88.06 and $88.79 on six separate sessions: $88.67 on September 22, $88.71 on September 23, $88.78 on September 29, $88.58 on September 30, $88.79 on October 1 and $88.06 on October 2. Friday's low was a one-month low, and it was rejected within hours as the G7 release was announced and price recovered toward $92.
Rallies have been capped just as consistently. The highs since September 21 are $96.78, $96.54, $94.74, $93.68 and $93.51. Each is lower than the one before.
Brent has followed a different course. It traded as low as $96.76 on October 1 before reversing to $100.15 on the China headline, and settled Friday at $102.25. Over the past month Brent is up 4.3% while WTI is down 3.2%. The gap between them has widened from $8.41 on October 1 to $11.30.
Against a year ago the picture is stark. WTI is up 46% and Brent 55%. Brent's 52-week range runs from $58.72 to $126.41. The current price sits $24 below that peak, reached in the early weeks of the war, and $42 above the low.
For the year, the chronology is one of repeated shocks. Brent finished January at $70.69. The conflict began on February 28. By mid-March the Brent-WTI spread had exceeded $15, the widest since 2012. Prices peaked in the spring, fell back as emergency stocks were released and alternative routes opened, and have oscillated around $100 Brent since late summer.
Aramco's Warning: Nearly 3 Billion Barrels Gone
The most consequential statement of the day came from the world's largest oil producer.
Amin Nasser, chief executive of Saudi Aramco, said on Monday that the inventories which normally cushion markets against shocks have become dangerously thin. He put the supply lost from the region during seven months of conflict at nearly 3 billion barrels. That is roughly half of the crude and refined fuel that would have passed through the Strait of Hormuz over the period.
He made three further points. Each additional week of closure removes on the order of 100 million barrels. Releasing strategic reserves buys time for consuming economies and does not correct the underlying gap between supply and demand. And even after the strait reopens, refilling stockpiles while meeting ongoing demand could take up to two years.
He also said refined fuel prices have risen more sharply than crude, and that pressure at both ends of the barrel will intensify until Hormuz fully reopens and confidence returns.
On Aramco's own operations, Nasser said the system is intact and that the company's maximum sustainable capacity of 12 million barrels a day can be made available within days. He credited the East-West pipeline to the Red Sea with preventing a far worse outcome, suggesting prices could have reached $200 without it. Shipments from the main Gulf terminal at Ras Tanura have increased over the past month. The company is seeking additional export routes and overseas storage.
The remarks need context. Aramco benefits from high prices, and its chief has argued for years that the world has underinvested in oil. His framing is not neutral.
The figures stand on their own regardless. A separate estimate holds that less than 10% of the world's 6 billion barrels of commercial stocks can be drawn without impairing operations. Pipelines need fill, refineries need working inventory and tanks cannot be emptied. The usable buffer is far smaller than headline numbers suggest.
For price, the statement matters in two ways. It tells the market that the producer with the most spare capacity sees no quick fix. And it reframes the G7 release. One hundred million barrels equals one week of the losses Nasser described.
Brent rose on the comments in the European morning and then gave the gain back. The market has heard versions of this warning before and has learned that flows, not stocks, drive the day-to-day price. Stocks set the floor and the risk of a spike. That is where the comment belongs in the forecast: it is the reason dips toward $97 Brent have been bought.
The G7 Release: 100 Million Barrels Against a 507 Million Draw
Consuming governments have reached for reserves again, and the arithmetic limits what it can do.
The G7 and partner countries agreed on Friday to release up to 100 million barrels of crude and refined products from emergency stocks over four months, coordinated through the International Energy Agency. A substantial share of the diesel is to be delivered in the first 20 days. The U.S. contribution is up to 40 million barrels from the Strategic Petroleum Reserve, offered as exchanges that borrowers must repay with additional barrels.
Spread evenly, 100 million barrels over four months is 0.8 million barrels a day. Front-loading the diesel makes the near-term effect on products larger.
The release was shaped by the diesel market. U.S. diesel futures reached $5.1175 a gallon last week. Distillate stocks are 12% below the five-year average heading into the northern winter. The White House had considered banning diesel exports, a step that would have lowered U.S. prices and sent European and Latin American prices sharply higher. The coordinated release came with a commitment to refrain from export restrictions.
That trade-off was the main result. Removing the threat of a U.S. export ban took a tail risk out of global product markets, and it helps explain Friday's reversal in WTI from $88.06.
The scale problem is plain. Global observed inventories fell by 507 million barrels between February and August, including 95 million in August alone. The new release replaces less than one-fifth of that. At August's rate of decline it covers 36 days.
This is also not the first draw. The IEA approved a record 400 million barrel release in March. The U.S. reserve has fallen from 404.7 million barrels a year ago to 286.6 million. Every release reduces what remains for the next emergency, and every barrel must eventually be bought back. Exchanges with a premium attached mean the United States will be a buyer of crude at a later date.
Japan said on Monday it has no plans for a fresh release from national reserves, having already contributed.
The market's reaction fits the numbers. WTI bounced on the announcement because the export-ban risk disappeared. Brent stayed above $100 because 0.8 million barrels a day does not close a gap that has been draining stocks at three times that rate.
For the forecast, the release is a ceiling on product spikes over the next three weeks and a neutral factor for crude beyond that. Its largest effect may be psychological: it shows governments will act at $5 diesel, which discourages speculative length above $105 Brent.
OPEC+ Holds at 31 Million Barrels a Day
The producer group did nothing on Sunday, and that was the expected outcome.
Seven core OPEC+ members led by Saudi Arabia and Russia agreed at a video conference on October 4 to keep November production targets at September levels. Combined quotas for the seven total 31 million barrels a day. It is the second consecutive monthly pause after six months of gradual increases. The group will keep meeting monthly, with the next session on November 1.
The background is that quotas have become largely theoretical. In September the group finished unwinding 1.65 million barrels a day of voluntary cuts dating from 2023. A further 2 million barrels a day of reductions agreed in 2022 remains in place through year-end. Most members are producing below their assigned levels because the war has shut in output and blocked exports. Actual production in Saudi Arabia, Iraq and Kuwait is still well under pre-conflict rates.
More than 10 million barrels a day of Gulf production was shut in during August by one estimate, with global supply at 100.1 million barrels a day.
When members cannot reach existing targets, raising those targets changes nothing. The constraint is physical: how many barrels can leave the Gulf through Hormuz, the East-West pipeline and other routes.
That is why the decision had little price effect. It confirmed that the group has limited control over the barrels that reach buyers while the strait is restricted.
The more informative signal came from Riyadh's pricing. Saudi Aramco lowered its official selling price for November Arab Light. Cuts in official prices typically reflect softer demand from refiners or competition from other grades. With Murban at $110 and physical premiums running $10 to $15 above futures a week ago, a reduction suggests the extreme tightness in prompt Middle East crude is easing as export volumes recover.
Aramco's chief said capacity of 12 million barrels a day could be brought on within days. That is the largest block of spare capacity in the world, and its availability depends on export routes. If Hormuz reopens, Saudi Arabia alone could add several million barrels a day in short order, and other Gulf producers would follow.
This defines the downside scenario. A reopening would release shut-in production, spare capacity and floating storage simultaneously. OPEC+ would then face the opposite problem, managing a surge, and its quota framework would matter again.
For now, the group is a bystander. The November 1 meeting will be worth watching only if conditions in the Gulf have changed by then.
Hormuz and Bab el-Mandeb: Flows Recover, Risks Do Not
The physical situation in the Gulf has improved more than the diplomatic one.
Middle Eastern crude exports rose above pre-war levels on four days during the last week of September, according to tanker-tracking data. Gulf exports excluding Iran recovered to 16.5 million barrels a day for the month. The increase came from more vessels transiting Hormuz and from alternative routes, chiefly Saudi Arabia's pipeline to the Red Sea. Iraq has chartered a supertanker through the strait for the first time in decades.
That recovery is the main reason crude fell 15% from its mid-September peak. Barrels that the market assumed were lost are moving.
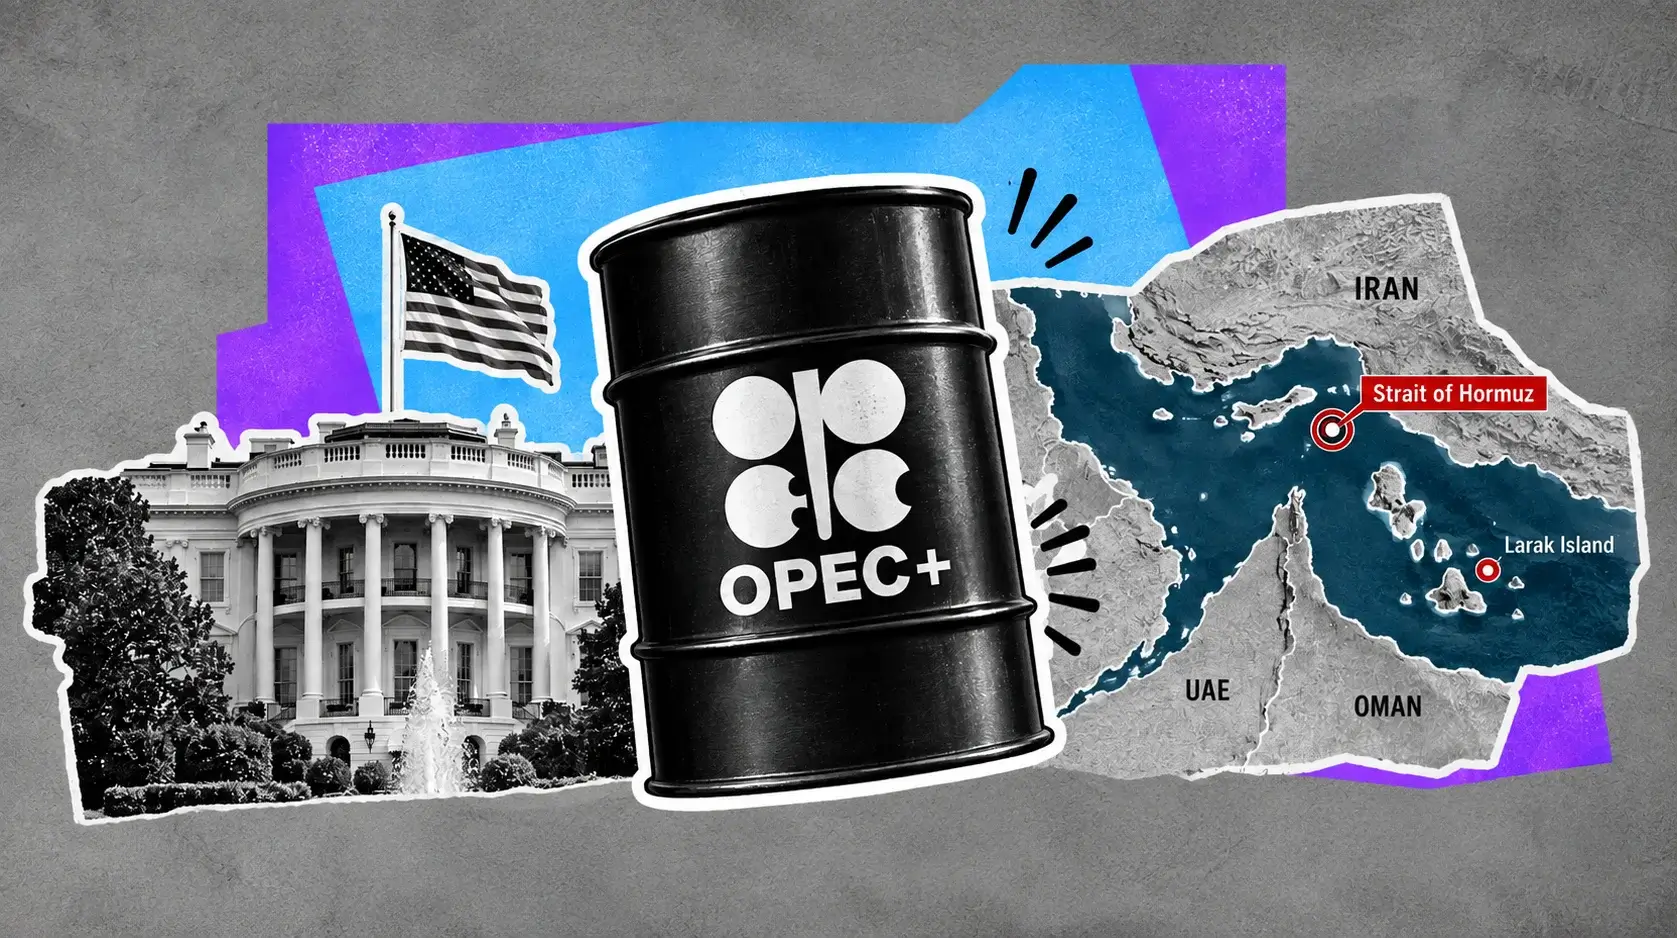
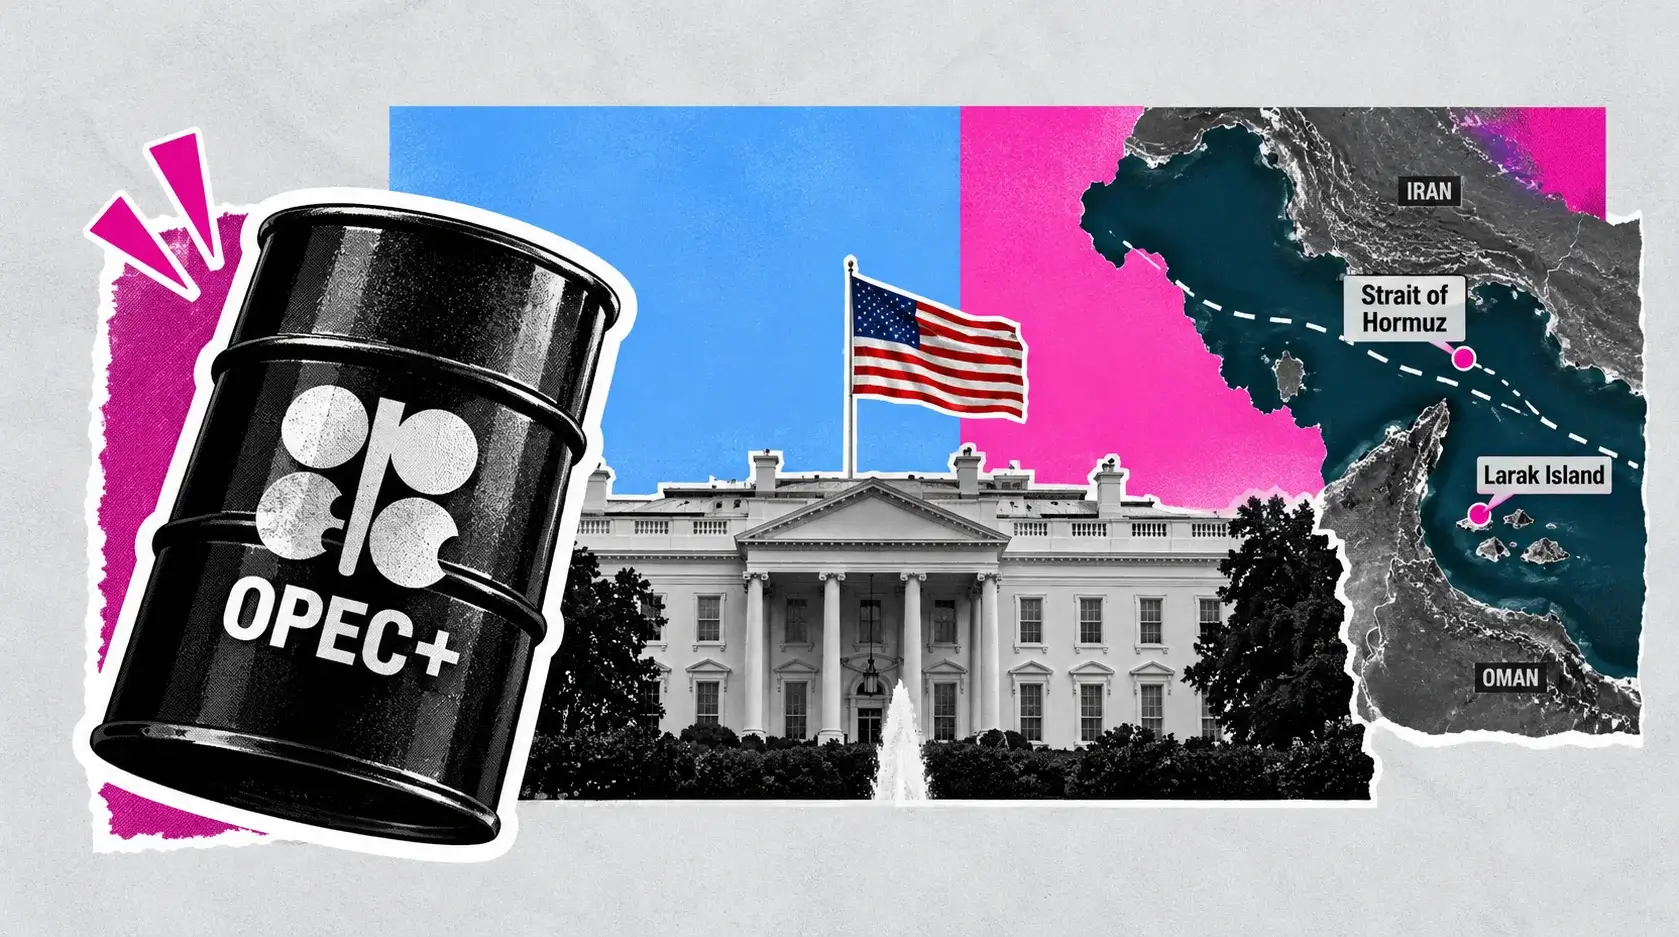
The limits are clear. The Strait of Hormuz, which carried a fifth of the world's crude and liquefied natural gas before the war, has been functionally closed to normal commercial traffic since February 28. Ships that do transit face attack. Iran struck vessels in the strait as recently as last week. Insurance costs are high, and many owners will not send tankers in.
Tehran's position has not softened. Officials said the strait will not fully reopen until the United States meets seven conditions set out in an earlier agreement. Indirect talks are deadlocked. Iran warned of a stronger military response to any American strike as additional U.S. troop deployments are planned, and Iranian officials are reported to be preparing for another round of fighting. The foreign minister said there is no military solution while insisting the country is ready to defend itself.
A second front has opened. Yemen's internationally recognized government announced a strategic offensive toward the Houthi-held capital, Sanaa, after retaking positions around the Bab el-Mandeb Strait. That waterway is the southern gate of the Red Sea and the outlet for the Saudi pipeline that has kept exports flowing. Heavy fighting there threatens the very route that replaced Hormuz.
Proxies in Iraq and Yemen have also attacked Aramco pipelines, refineries and ports in recent weeks.
So the market faces improving averages and fat tails. Daily export figures are rising. The probability of a sudden loss, from a tanker strike, a pipeline hit or closure of the Red Sea route, has not fallen and may be increasing.
This is what keeps Brent above $100 while flows normalize. Buyers of seaborne crude are paying for delivery risk. Thin inventories mean any interruption cannot be bridged from storage.
The asymmetry is large in both directions. A disruption at Bab el-Mandeb could add $10 to $15 to Brent within days. A credible deal that reopens Hormuz could remove $15 to $20.
The Brent-WTI Spread at $11.30
The gap between the two benchmarks is itself a price signal.
At $11.30, Brent's premium over WTI is up from $8.41 on October 1. Before the war it averaged $4 to $5. It exceeded $15 in March, the widest since 2012.
The spread measures the difference between a landlocked, well-supplied market and a seaborne one short of prompt cargoes. WTI is priced at Cushing, Oklahoma, where stocks have risen for two weeks to 24.3 million barrels. Brent is priced off North Sea cargoes that compete directly with Middle Eastern grades for European and Asian refiners.
A wide spread should correct itself through trade. When Brent trades $11 above WTI, exporting U.S. crude is highly profitable, and American barrels flow to Europe and Asia until the gap narrows. U.S. exports have been running near record levels all year for this reason.
The spread has widened anyway, which points to bottlenecks. Gulf Coast export terminals have finite capacity. Tanker rates have risen with longer voyages and war-risk premiums. And the grades do not substitute perfectly: U.S. light sweet crude yields less diesel than the medium sour barrels the Gulf normally supplies, and diesel is the product in shortest supply.
Monday's widening has a specific cause. News that increases Gulf flows tends to pressure both benchmarks. News about depleted inventories and delivery risk supports Brent more. Both arrived together, so WTI fell 1.2% and Brent 0.9%.
Murban at $110 extends the same logic. Abu Dhabi's flagship grade loads outside the Strait of Hormuz, at Fujairah, which makes it one of the few Gulf crudes with secure delivery. It trades $8.70 above Brent as a result.
The spread has implications beyond trading. U.S. refiners buying domestic crude at WTI-linked prices and selling products at world prices are earning exceptional margins. U.S. producers are receiving less than international competitors. And the American consumer, though paying far more than a year ago, is partly insulated compared with Europe and Asia.
For direction, the spread is a gauge of how the Hormuz situation is being priced. A narrowing toward $8 would indicate the market believes seaborne supply is normalizing. A move toward $15 would signal renewed stress in the Gulf or the Red Sea.
A reopening of the strait would compress the spread quickly, with Brent falling faster than WTI. That makes Brent the more exposed contract to peace and WTI the more exposed to any weakening in U.S. demand.
U.S. Inventories: Crude Builds, Distillates Drain
American data show a market that is comfortable in crude and tight in products.
Commercial crude inventories rose 922,000 barrels to 427.3 million in the week ended September 25, against expectations of a draw between 264,000 and 700,000 barrels. It was the second straight build after a 3.0 million barrel increase the week before. Stocks are 2% above the five-year average. Inventories at Cushing rose 553,000 barrels to 24.3 million, 32% of capacity. Industry data for the same week showed a 1.02 million barrel build.
Part of the build came from refineries. Crude runs fell 554,000 barrels a day and utilization dropped 1.5 percentage points to 92.5% as autumn maintenance began. Less crude processed means more left in tanks.
Products went the other way. Distillate stocks, which include diesel and heating oil, fell 2.3 million barrels to 105.2 million. The expected decline was 190,000 barrels, so the draw was more than twelve times the forecast. Distillate inventories are 12% below the five-year average. Gasoline stocks also fell.
That mix explains U.S. price behavior. Abundant crude at Cushing weighs on WTI. Scarce diesel lifts refining margins and keeps crude demand from refiners firm once maintenance ends. The diesel crack spread is the mechanism that pulls crude higher from the product side.
Supply is steady. U.S. production was 13.95 million barrels a day in July, up from 13.84 million. The oil rig count rose by one to 456 last week, with total rigs at 598. Drilling activity has barely responded to $90 crude. Producers have prioritized shareholder returns, and the forward curve is steeply backwardated, so the price available for hedging future output is well below the spot price.
The strategic reserve holds 286.6 million barrels, and up to 40 million more will go out under the G7 plan.
The next Energy Information Administration report is due Wednesday, October 7, at 10:30 a.m. ET, covering the week ended October 2. Three items matter. A third consecutive crude build would reinforce the $88 to $90 test in WTI. Another large distillate draw would support products and Brent. And exports will show whether the $11 spread is pulling more American crude overseas.
Seasonal patterns favor crude builds through October as refineries stay in maintenance, then draws from November as runs recover and heating demand rises. That timing suggests WTI faces headwinds for another three to four weeks before the balance tightens.
Home heating costs are already rising sharply for households that use oil, which adds political pressure for further government action.
Read More
-
Yen Stalls at 160 Despite a 3% JGB and Tokyo Core CPI at 2.0% — Intervention Sits at 164, Friday's Payrolls Decide
02.09.2026 · TradingNEWS ArchiveEnergy
-
MELI Stock Gap to $1,843 High as Ibovespa Surges 8.76% and Rate-Cut Bets Lift a $16.4B Credit Book — $2,270 Upside Case
05.10.2026 · TradingNEWS ArchiveStocks
-
XRP-USD ($1.52) Coils Under a $1.55 Ceiling as Whales Add 1.6B Tokens and RLUSD Tops $2.4B — $1.60 Breakout in Focus
05.10.2026 · TradingNEWS ArchiveCrypto
-
Gold ($4,158) Rebounds Off $4,110 2-Month Low but High Yields Block $4,230 — Downside Risk to $4K Before Recovery
05.10.2026 · TradingNEWS ArchiveCommodities
-
S&P 500, Nasdaq and Dow Futures Dip as 5.28% Yields Test Friday's Rally; PTC Soars 36%, INTC Falls 3.9%
05.10.2026 · TradingNEWS ArchiveMarkets
-
Pound Sterling at 1.3228 Pinned Near a 3-Month Low as the Dollar Index Hits 102.53
05.10.2026 · TradingNEWS ArchiveForex
Demand: High Prices and High Rates Begin to Bite
The demand side has held up better than expected this year, and the strain is showing.
Global oil demand has recovered to 104.8 million barrels a day by one estimate, a figure that explains why inventories keep falling despite improved flows. Consumption did not collapse when prices doubled, in part because fiscal support in several large economies insulated households and because substitution takes time.
The warning signs are accumulating. In the United States, payrolls grew by just 29,000 in September, consumer confidence fell to a 12-year low last week, and the 10-year Treasury yield stands at 5.28%. Higher borrowing costs and weak hiring are a combination that reduces driving, freight and industrial activity with a lag.
Europe is under more pressure. Inflation reached 3.8% in September on energy costs. The European Central Bank's chief economist said on Monday that the latest surge in energy prices poses downside risks to growth and that demand destruction from high costs can limit how far rates need to rise. He described the increase in long-term bond yields as a material tightening of financial conditions. France's 10-year yield is near 5%.
Demand destruction is the technical term for what high prices eventually do. Consumers and businesses cut usage, switch fuels or close operations. It is the market's own balancing mechanism, and it is the main route by which the deficit closes without a reopening of Hormuz.
China adds uncertainty. Refiners there suspended fuel exports on October 1 through the Golden Week holiday, which ends October 7. That removed product supply from Asian markets and lifted diesel. Whether exports resume this week is unknown. A resumption would ease products. An extension would tighten them further.
The dollar is another headwind for demand outside the United States. The dollar index is at 102.17, near its high for the year. Oil priced in dollars costs more in local currency terms when the dollar rises, and importers in emerging markets feel it most.
There are offsetting supports. AI-related investment and government spending have kept activity firmer than models implied. Euro-area purchasing managers' indices showed the fastest expansion in more than three years. Jet fuel and petrochemical demand remain solid.
The balance is shifting slowly toward weaker consumption. That does not produce a sharp fall in price while stocks are this low. It does lower the ceiling. Each month at $100 Brent removes some demand, and by early 2027 the cumulative effect could be large enough to start rebuilding inventories even without more supply.
For the next few weeks, demand is a secondary driver. Supply headlines move the daily price.
Technical Structure: WTI Compresses Above $88, Brent Holds a Higher Range
The charts for the two benchmarks have diverged.
WTI is in a short-term downtrend within a broader range. The sequence of lower highs since September 21 runs $96.78, $96.54, $94.74, $93.68 and $93.51. Lows have been flat between $88.06 and $88.79. Falling highs against a horizontal floor form a descending triangle, a pattern that more often breaks lower. The floor has held six times, and each successive test weakens a level.
Momentum favors sellers in the near term. Price is below its short-term moving averages, which have turned down. The decline from $105.63 has retraced the bulk of the September spike. Volume on down days, including 422,680 contracts on September 22 and 370,330 on September 28, has exceeded volume on most up days.
The measured move from the triangle is its height at the widest point, roughly $8.70, projected from the floor. A daily close below $88.06 would target $79 to $80. Before that, intermediate supports sit in the mid-$80s, where WTI traded in the second half of August.
The pattern fails on a close above $93.68, which would break the sequence of lower highs and open $96.54 to $96.78.
Brent looks sturdier. It made a higher low at $96.76 on October 1 and recovered above $100 the same day. It has traded mostly between $98 and $104 for two weeks, a range centered on the round number. Its monthly change is positive at 4.3%. The structure is sideways with a slight upward tilt.
Brent resistance is defined by this week's high near $103.00 to $103.98 and then $105.07. Support is at $100.00, $98.03 to $98.44 and $96.76.
Volatility is high in both. Average daily ranges of $4 to $5 in WTI equal 4.5% to 5.5% of price. Stops placed within $2 of entry are routinely hit by noise.
The forward curve remains in steep backwardation, with prompt contracts priced well above later ones. That structure reflects scarcity today and expectations of more supply later. It rewards holders of long positions who roll forward and penalizes producers who hedge. A flattening of the curve would be an early sign that prompt tightness is easing.
Model-based projections for the end of the quarter cluster near $95 for WTI and $106.60 for Brent, both above current prices and consistent with a view that the $11 spread persists.
The technical message is that WTI is the weaker chart and is close to a decision at $88. Brent is range-bound with support that has been tested and held.
The Level Map
For WTI, resistance begins at $91.11, Friday's settlement, and $91.85, Sunday's high. Above that, $93.51 to $93.68 marks the last two session highs and the level that must break to end the pattern of lower highs. Further resistance stands at $94.74, then $96.54 to $96.78. Beyond those, $98.01, the $100 round number, $102.47 and the September peak at $105.63 complete the map.
WTI support is at $90.00, where price sits. Below it lies the shelf: $88.79, $88.58 and $88.06. A daily close under $88.06 is the breakdown trigger. Next supports are $85.50, a late-August reference, and $84.58 from mid-August, followed by the $79 to $80 pattern target.
For Brent, resistance is at $102.25, Friday's settlement, then $102.90 to $103.98. Above that, $105.07 and the $106.60 model projection are next, followed by $107 and $109.96 to $110.00, where Murban currently trades.
Brent support starts at $101.00 and the $100.00 mark. Under it, $98.03 to $98.44 is a band of prior settlements and lows, and $96.76 is the October 1 low that defines the range. A close below $96.76 would open $94.29 and $93.11.
From current prices, WTI is $1.94 above its floor and $3.68 below the level that would turn the chart positive. Risk to the downside trigger is 2.2%. Brent is $4.54 above its range low, 4.5%, and $2.68 below the top of this week's range.
Trade construction differs by contract. A WTI long at $90.00 with a stop under $87.80 risks $2.20 for $3.68 to $93.68 and $6.78 to $96.78. That is a reasonable ratio against a level that has held six times, with the caveat that descending triangles tend to resolve lower.
A WTI short on a break of $88.06 with a stop above $90.50 risks $2.44 for $3.50 to $84.58 and $8 to $80.
A Brent long between $98 and $100 with a stop under $96.50 risks $1.50 to $3.50 for $6.60 to $8.60 toward $106.60. At the current $101.30 the same stop risks $4.80 for $5.30, which is less attractive. Waiting for a dip improves the entry.
For the spread, a move back toward $8.41 would require WTI to outperform Brent by nearly $3.
For holders of the main U.S. crude fund (USO), the WTI levels apply directly, and backwardation adds a positive roll return each month the curve holds its shape.
Scenarios for the Week and the Month
The base case is continued range trading with headline-driven swings. Brent holds between $97 and $104, WTI between $88 and $94. Gulf exports stay near pre-war levels on good days and dip on bad ones. The G7 diesel release caps product prices for three weeks. Inventories keep falling at a slower rate. Wednesday's EIA report shows another modest crude build and a distillate draw. This path carries the highest probability and favors buying Brent near the bottom of its range and selling near the top.
The bullish case requires a supply event. Candidates include a successful attack on a tanker or on the East-West pipeline, closure of Bab el-Mandeb as fighting in Yemen escalates, a renewed exchange between U.S. and Iranian forces, or China extending its fuel export suspension past October 7. With stocks as low as they are, any of these would send Brent through $105.07 toward $110 within days and WTI back above $96.78. A serious disruption to the Red Sea route would put $115 to $120 Brent in view. The trigger is unpredictable, and the reaction would be fast.
The bearish case has two versions. The gradual one is a WTI close below $88.06 on rising U.S. stocks, weak demand data and steady Gulf flows. That targets $84.58 and then $80, with Brent following to $96.76 and $94.29. The abrupt one is diplomatic: a deal between Washington and Tehran that reopens Hormuz. Shut-in production of 10 million barrels a day, Saudi spare capacity and floating storage would reach the market together. Brent could fall $15 to $20 in a week, toward $82 to $87, and the Brent-WTI spread would compress toward $5.
Probabilities shift with the news. The diplomatic track is deadlocked, which lowers the odds of the abrupt bearish outcome near term. Fighting is intensifying in Yemen, which raises the odds of a supply event. Flows are improving, which supports the gradual bearish path for WTI.
Putting those together, Brent's risks are skewed to the upside from the low end of its range, and WTI's are skewed to the downside from the middle of its range. The spread is likely to stay wide.
Scheduled events this week are Wednesday's EIA report, the Fed minutes the same afternoon, the end of China's holiday on October 7, and monthly reports from the major forecasting agencies in the following days. The OPEC+ meeting on November 1 is the next policy date.
Beyond the month, the dominant variable is unchanged. Each week of closure costs the world on the order of 100 million barrels. Inventories cannot fall indefinitely. Either flows normalize or prices rise far enough to cut demand.
Verdict: Bullish Brent on Dips to $98 to $100, Neutral WTI Above $88.06
The forecast separates the two benchmarks.
For Brent, the call is bullish on pullbacks. Global stocks have fallen 507 million barrels since February and continue to decline. The largest producer in the world describes the cushion as dangerously thin and sees two years to rebuild. The G7 release of 100 million barrels replaces a fifth of the draw. Hormuz remains shut under seven unmet conditions, and a second chokepoint is now contested. Brent has made a higher low at $96.76 and held $100 through a week of bearish supply headlines. The plan is to buy between $98 and $100 with a stop below $96.50, targeting $106.60 to $107. At the current $101.30 the position is a hold.
Brent's bullish case is invalidated by a daily close below $96.76. That would indicate the market has decided that flows are sufficient, and it would open $94.29.
For WTI, the call is neutral. U.S. crude stocks have risen for two weeks and stand 2% above the five-year average. Refinery maintenance will keep adding to them through October. Production is near 13.95 million barrels a day. The chart shows lower highs pressing on a floor that has been tested six times. Buying at $90.00 against $88.06 offers a defined risk of 2.2%, and it is a trade for a bounce to $93.68. A daily close below $88.06 turns the outlook bearish toward $84.58 and $80.
WTI turns bullish on a close above $93.68.
The spread is the cleaner expression of the view. Brent over WTI at $11.30 reflects the difference between seaborne scarcity and inland surplus, and both conditions persist. It widens further if the Red Sea route is threatened and narrows sharply only if Hormuz reopens.
The principal risk to the entire outlook is a diplomatic breakthrough. A reopening would take $15 to $20 off Brent in days, and no stop would protect a long position through that gap. Position size should reflect that. The principal upside risk is a physical disruption, which with stocks this low would produce an equally fast move in the other direction.
For equity holders, integrated producers and refiners continue to benefit from $100 Brent and record distillate margins, and the sector remains a hedge against the scenario that hurts everything else.
The rating is buy Brent on dips with a $107 target, hold at $101.30, and stay neutral on WTI while it trades between $88.06 and $93.68. Wednesday's inventory report and the next development at Bab el-Mandeb will determine which side of that range gives first.