





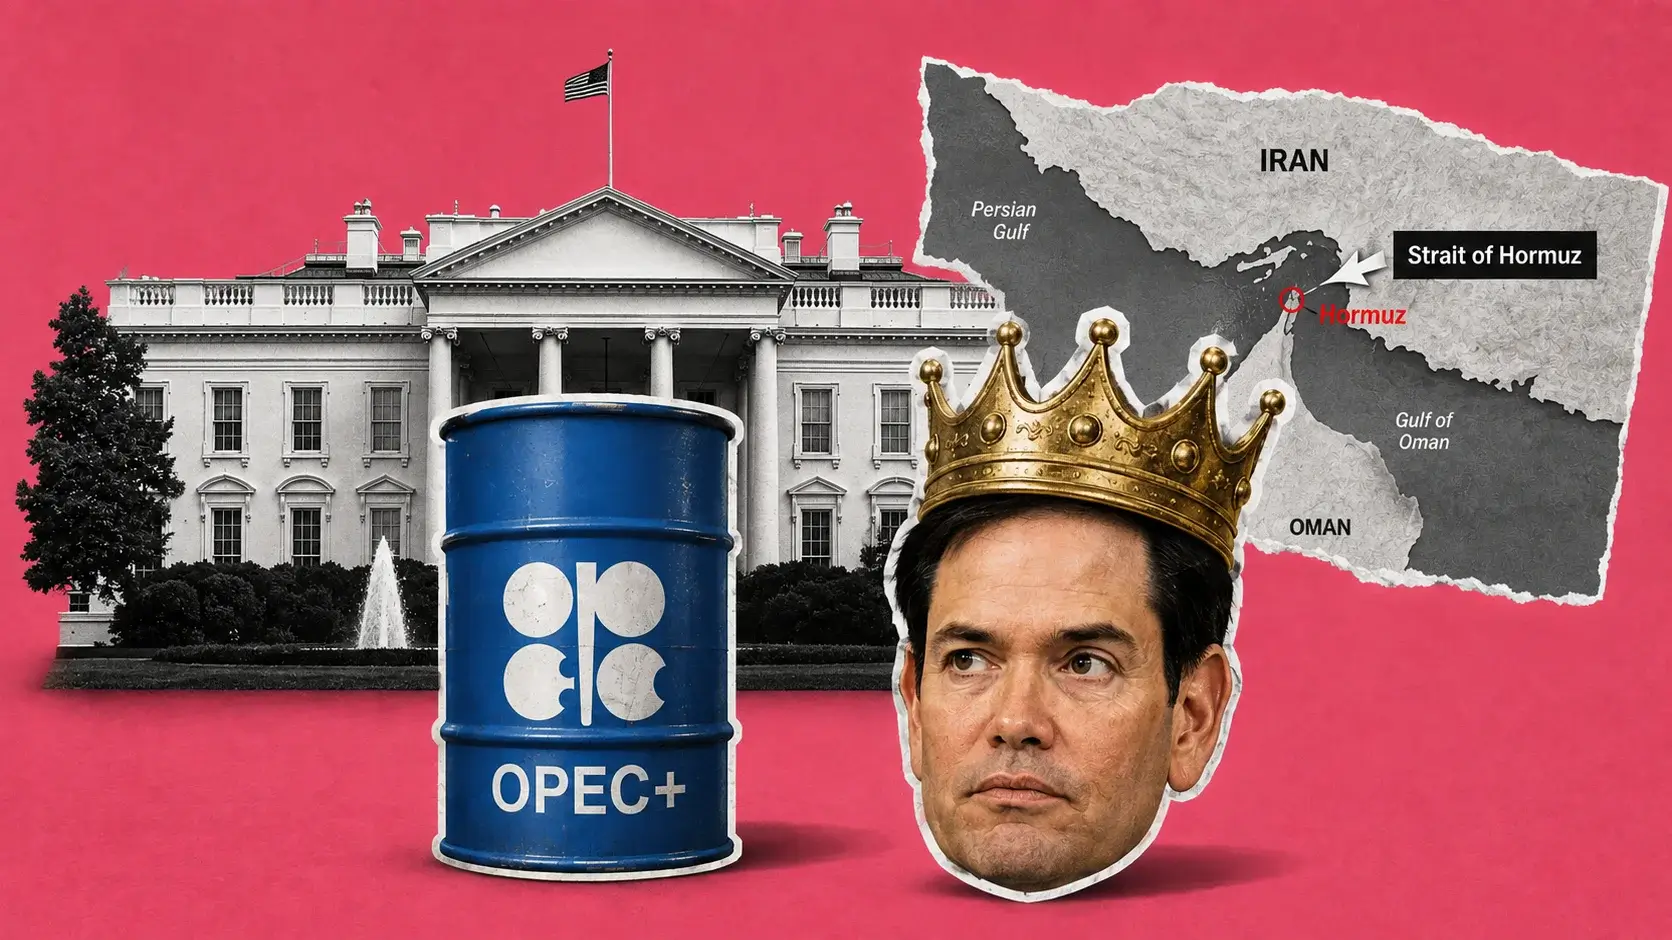
Crude Grinds Toward $90 As Hormuz Transits Hit A 1-Week Low
The Strategic Petroleum Reserve sits below 300M barrels, the lowest since 1983 | That's TradingNEWS
Key Points
- Brent $89.63 and WTI $83.91 after five straight gains; Brent up nearly $10 week-over-week
- EIA raised 2026 Brent to $86.81 and WTI to $80.88; sees $78 in Q4 and $69.39 in 2027
- API showed a 9.1M barrel crude build, the largest since February; gasoline drew 1.531M
Crude is grinding into resistance on the back of a supply story that refuses to resolve. Brent traded near $89.63 a barrel while West Texas Intermediate climbed to $83.91, both benchmarks pushing toward levels that have capped every attempt since the early-August decline.
Brent held above $89 on Wednesday after rising for five consecutive sessions. The front-month contract touched $90 in the morning, with WTI pushing toward $84. Tuesday's close set the base: Brent finished at $89.08, up 1.55% on the day and nearly $10 per barrel higher week-over-week, while WTI gained $1.18 or 1.42% to $84.22, up more than $8 from the prior week. September WTI futures traded $83.53 to $83.64 in the premarket, up 0.33 to 0.44.
That is a $10 move in Brent inside five sessions with no single day exceeding 2%. Grinding advances on geopolitical supply risk are more durable than gap-driven spikes, and this one has held every dip.
The macro backdrop turned supportive at 8:30 a.m. ET. July CPI printed 3.4% headline and 2.5% core, both in line, per the July 2026 CPI release. That shifted September FOMC pricing toward a hold, weakened the dollar toward 99.85 on the index, and removed the demand-destruction narrative that a hawkish repricing would have imposed on crude.
The thesis is a two-sided trade with a violently asymmetric payoff. Brent sits at $89.63 with 5.5 million barrels per day of Middle East production shut in, Strait of Hormuz traffic at 8 vessels against a 10-day average of 12, and the Strategic Petroleum Reserve below 300 million barrels for the first time since 1983. Against that, US crude inventories built 9.1 million barrels last week — the largest increase since February — and Iran-Oman talks on restoring maritime traffic have reached an advanced stage.
The levels that decide it: Brent's $90 print and the $93 to $95 resistance zone above it, WTI's $84.37 to $84.70 band. Break both and $102 comes into frame. Reject with a confirmed inventory build and $78 is the EIA's own fourth-quarter number.
The EIA Raised 2026 Brent To $86.81 And Cut 2027 To $69.39
The official forecast update is the most important document on the tape this week, and it reframes the entire curve.
The agency now expects Brent crude to average $86.81 per barrel in 2026, up from a previous forecast of $81.91, and raised its 2026 WTI average to $80.88 from $76.26. For 2027 it forecasts Brent at $69.39 and WTI at $65.39.
The quarterly path is more instructive than the annual figures. The Brent spot price is forecast to average around $85 per barrel in the third quarter of 2026 — $11 higher than the prior month's projection. Once traffic through the Strait of Hormuz gradually increases and shut-in production restarts, prices are forecast to fall, decreasing to an average of $78 by the fourth quarter. Most shut-in production is assessed as largely restored in the first quarter of 2027, with global inventories building again and prices gradually lowering to an average of $69 in 2027.
Read that against spot. Brent at $89.63 sits $4.63 above the third-quarter forecast average, $11.63 above the fourth-quarter number, and $20.63 above the 2027 average. The official view is that current prices are the peak and the curve declines from here.
The assumption underneath it: Middle East shut-in crude oil production estimates were increased versus the July forecast due to continued severe constraints on Hormuz transits, which are assumed to persist through August. Most regional production is expected to return to near pre-conflict averages in early 2027, with ongoing disruptions of about 0.6 million barrels per day continuing through the end of next year.
The forecast was completed August 6 and released August 11. The next release is September 9. That five-day lag between completion and publication matters — the document does not capture the five-session rally that took Brent from $80 to $89.63.
A 0.6 million barrel per day permanent impairment through 2027 is the structural number. Against roughly 103 million barrels of daily global consumption, that is 0.6% of supply removed indefinitely, which is enough to keep the curve backwardated but not enough to justify $90.
5.5 Million Barrels Per Day Are Shut In And Hormuz Traffic Is Collapsing
The physical disruption is larger than most price forecasts imply, and it is the reason spot trades above every institutional target.
Approximately 5.5 million barrels per day — more than 5% of global oil consumption — remained shut in during July because of conflict-linked disruptions. The agency expects roughly 600,000 barrels per day to remain offline through the end of 2027.
Read those two figures together. The market is currently absorbing a 5.5 million barrel per day outage and the official view is that 4.9 million barrels of that returns within eighteen months. Every dollar of the current risk premium is a bet on the timing of that restoration.
Shipping traffic tells you it has not started. Commercial transits through the Strait of Hormuz have dropped sharply as shipowners continue avoiding the waterway. Eight vessels transited the strait on Tuesday, below the 10-day average of around 12 — the lowest daily traffic level since August 5. Vessel traffic has fallen sharply as Iran continues targeting tankers that disregard its demands.
Eight transits against a normal-state flow that historically moved roughly 20 million barrels per day is a functional closure, not a constraint. Global crude supplies are gradually tightening as shipping volumes through the waterway decline.
The regional production response amplified it. In response to disrupted navigation, many Middle East countries — including Iraq, Saudi Arabia and the UAE — shut in oil production. Attacks on energy infrastructure and the threat of additional attacks supported the price increase.
OPEC+ is releasing barrels into the gap at a pace that barely registers. Seven participating producers agreed to adjust output by 188,000 barrels per day in August while retaining flexibility to pause or reverse those changes if market conditions deteriorate. That is 3.4% of the shut-in volume.
The escalation continues at the margins. A Houthi attack killed four crew members in the Bab el-Mandeb Strait, a US Navy strike disabled a cargo ship off Pakistan, drone activity hit Iraq, and Washington enforced its blockade by firing on a Panama-flagged vessel attempting to cross the Gulf of Oman on Tuesday.
The 9.1 Million Barrel Build Is The Bear Case And It Reports At 10:30
The single bearish counterweight on the tape is domestic, and it gets confirmed or refuted within hours.
Industry data showed US crude inventories rose by 9.1 million barrels last week, marking their largest increase since February and arriving against expectations for a decline. The official Weekly Petroleum Status Report is due Wednesday at 10:30 a.m. Eastern.
A 9.1 million barrel build in a market where 5.5 million barrels per day are shut in globally is a genuine contradiction. It says US refiners are running below capacity, imports arrived faster than expected, or domestic production has stepped up into the price. Whichever explanation holds, a nine-million-barrel weekly surprise is enough to cap a rally.
The product side runs the other direction and it is tighter. Gasoline inventories fell by 1.531 million barrels in the week ending August 7, after increasing 156,000 barrels the prior week. Gasoline stocks were already 7% below the five-year average for this time of year. Distillate inventories fell by 596,000 barrels after dropping 1.2 million the week before.
That divergence — crude building while products draw — is the signature of a refining bottleneck rather than a demand problem. Crude is accumulating because refiners cannot process it fast enough, while gasoline and diesel tighten because end demand is intact. Products lead crude in that configuration.
The pump price confirms it. The national regular gasoline average hit $4.03 per gallon on Wednesday. That figure sits against a July CPI print showing gasoline down 2.9% on the month — a reading that reflects late-June and early-July prices and reverses in the August survey.
The strategic reserve is the structural constraint nobody can fix quickly. Crude inventories held in the Strategic Petroleum Reserve have fallen below 300 million barrels, the lowest level since 1983 and the lowest in more than four decades. That removes the policy tool that suppressed prices in prior supply shocks.
Confirmation of a large crude build slows WTI's advance. A smaller increase or a draw leaves geopolitical supply concerns in control of the tape.
Brent's $90 And WTI's $84.37 Are The Only Levels That Matter Today
The technical structure is clean and the decision points are tight.
The four-hour Brent chart shows a strong recovery from the early-August decline with momentum improving as price moves back toward higher resistance. The main resistance zone sits at $93 to $95. A sustained break above that area strengthens the recovery structure and shifts attention toward the previous major high around $102.
Immediate resistance is the $90 round number, sitting 37 cents above spot at $89.63. Brent touched it Wednesday morning and did not hold. That level has now been tested twice in five sessions.
WTI's resistance zone is $84.37 to $84.70. Spot at $83.91 sits 46 cents below the lower bound. Tuesday's close at $84.22 penetrated it and failed to hold, which makes the band a confirmed supply pocket rather than an untested level.
Both benchmarks are pinned within half a dollar of the level that decides the next move. Brent clearing $90 and holding opens $93 to $95. WTI clearing $84.70 confirms it. Rejection at both, combined with a confirmed nine-million-barrel build, triggers another pullback.
The downside structure for WTI is wide. The estimated pivot point sits at $77.05, revised up from $67.00 in the prior assessment. August range projections span $67.93 to $106.74 — a 57% band that tells you how little conviction exists in either direction.
Contract-month spreads add noise that traders need to respect. Brent October traded $84.11 on Monday against a front-month print near $89, and one quote showed Brent futures at $87.78 against a previous close of $87.86. That backwardation — front month above deferred — is the physical market pricing immediate scarcity, and it is the single most bullish structural feature on the board.
The Brent-WTI spread sits at $5.72 at current prices. During the Hormuz crisis, Brent has traded at a larger premium to WTI because Middle East disruptions affect Brent-priced barrels more directly than US domestic production. That spread widening beyond $8 signals escalation; compression toward $4 signals resolution.
July Delivered A 21% Surge And The Drivers Are Still Live
The month that reset the trade is worth reconstructing because the same catalysts remain in place.
Oil prices surged more than 20% in July amid rising geopolitical tensions and global supply shocks. The escalation between the United States and Iran, Houthi attacks in the Red Sea, and Saudi Arabian retaliatory actions against Iran-aligned forces significantly heightened risks to key maritime trade routes. A decline in US crude inventories provided an additional bullish catalyst.
That 21% July advance came off a base of $69. Following the June signing of a memorandum of understanding between the United States and Iran, the Brent spot price fell as low as $69 per barrel on July 2. From that low to Wednesday's $89.63 is a 29.9% advance in six weeks.
The June collapse is the template for what a resolution looks like. Prices fell under $70 in mid-June on supply and demand rebalancing after a Hormuz reopening. Crude had traded at or above $100 for most of the second quarter before that.
The full 2026 arc frames the volatility. Brent began the year at $61 per barrel and finished the first quarter at $118 — the largest quarterly price increase on an inflation-adjusted basis in the available data. Brent surpassed $100 on March 12 and pushed above $114 later that month. Military action began February 28.
The March 11 session shows how fast the premium evaporates on intervention headlines. WTI fell to $86.55, down $8.22 or 8.67%, while Brent dropped to $89.80, down $9.16 or 9.26%, and Murban settled at $102.20, down $8.02 or 7.28%. Traders unwound long positions within hours on reports of potential US military action to seize control of the strait and restore open access.
Brent at $89.63 sits 24.1% below the March peak of $118 and 46.8% above the January starting point of $61. The global benchmark is up roughly 16% compared with pre-conflict levels.
Position accordingly. This market has delivered two 9% single-session collapses and two 20%-plus monthly rallies inside six months. Size for the tails.
The Diplomacy Is Live And Contradictory In The Same 48 Hours
The negotiation track is the volatility source, and the signals arriving this week point in opposite directions.
The bullish read: Iran's latest demands dampened hopes for a return to stability, with Tehran insisting the critical waterway will not reopen without major concessions from Washington. Iranian official Mohsen Rezaei stated the strait remains closed until the United States meets Tehran's conditions. Iran confirmed it has no ongoing discussions with Washington regarding a ceasefire extension.
The bearish read arrived the same week. Pakistan's defense minister said recent developments suggested Washington and Tehran were close to some sort of arrangement, with conditions appearing to move in favor of peace. Reports indicated talks between Iran and Oman on reopening the strait to some maritime shipping had reached an advanced stage, cited via a Qatari foreign ministry spokesperson.
Those comments prompted prices to reverse earlier gains, which highlights the market's sensitivity to conflicting signals. Brent fell toward $87 on Tuesday before recovering to $88.7.
The complication is the reparations dispute. Tehran reiterated calls for war compensation as part of negotiations to wind down the conflict, issuing sweeping demands over the weekend. The US president responded by insisting Iran should pay reparations for those killed in attacks linked to the Islamic Republic and directed US representatives to demand compensation in any future negotiations.
That is a structural impasse, not a bargaining gap. Both sides are demanding payment from the other as a precondition, which means the arrangement Pakistan describes as close requires one party to abandon a stated position.
The political clock is the variable to watch. Iran is playing for time as midterm elections approach, which changes the incentive structure on both sides through November.
A separate escalation vector is opening. The House has taken up a bipartisan sanctions package targeting Russian energy revenues, banks and sanctions-evasion networks while threatening steep tariffs on major buyers of Russian energy. Constraining Russian barrels while Middle East supply is impaired is additive to the risk premium.
Read More
-
Yen Stalls at 160 Despite a 3% JGB and Tokyo Core CPI at 2.0% — Intervention Sits at 164, Friday's Payrolls Decide
02.09.2026 · TradingNEWS ArchiveEnergy
-
QQQ ETF ($706.22) Slides 7.4% Below Its High as the Market Reprices the AI Capex Bill — $686.57 Target if $700 Breaks
22.10.2026 · TradingNEWS ArchiveStocks
-
XRPI ($7.00) and XRPR ($10.74) Slide Toward 52-Week Lows as Spot XRP ETF Flows Stall at $708,510
22.10.2026 · TradingNEWS ArchiveCrypto
-
NG ($2.775) Decoupled From Europe’s €88 Gas Crisis as LNG Feedgas Hits 18.9 Bcf/d — $3.30 Upside on Cold Weather
22.10.2026 · TradingNEWS ArchiveCommodities
-
Dollar-Yen (157.35) Loses 157.65 as the Yen Rallies on Haven Demand — 155 Target if 156 Breaks
22.10.2026 · TradingNEWS ArchiveForex
Institutional Forecasts Span $69 To $96 And Nobody Agrees
The sell-side dispersion on 2026 crude is as wide as the physical uncertainty justifies.
One rating agency raised its 2026 annual average Brent forecast to $70 from $63, assuming the Strait of Hormuz remains effectively closed for about a month before prices fall to the mid-$60s in the second half. That revision did not materially change base-case economic forecasts. An adverse scenario — oil rising to $100 and remaining there — would constitute a significant global supply shock, reducing world GDP by 0.4% after four quarters and adding 1.2 to 1.5 percentage points to inflation in Europe and the United States.
A major bank published its first upward revision in two months in mid-May, projecting Brent averaging $96 for full-year 2026 and $75 in 2027, with WTI at $89. That same institution has since revised its end-2026 projection to $78, down from a prior $95.
The official forecast splits the difference at $86.81 for 2026 Brent and $80.88 for WTI, with 2027 at $69.39 and $65.39.
Spread the estimates: $70, $78, $86.81 and $96 for 2026 Brent, against spot at $89.63. The range is $26 wide — 29% of the current price — on a twelve-month average.
The 1.2 to 1.5 percentage point inflation sensitivity is the number that connects this market to everything else. Modeling from the European central bank puts every $10 sustained increase in oil prices at 0.5 percentage points on eurozone consumer inflation. Oil is up more than $40 since the conflict began in late February, implying two full percentage points of imported inflation pressure working through the euro area.
That is why the Fed is stuck at 3.50%-3.75% with three dissenters wanting to hike, and why the ECB has a September 10 increase priced at 70% to 79% despite forecasting 0.8% growth. Crude at $90 is the reason both central banks are leaning hawkish into weakening economies.
Resolution collapses that pressure. Escalation compounds it. The oil market is currently the primary transmission channel for global monetary policy, and that is a position it has not occupied since 2022.
The Fourth-Quarter Fade Is The Consensus Trade And It Is Crowded
Every major forecast points the same direction beyond September, which is precisely what makes it interesting.
The official path runs $85 average in the third quarter, $78 in the fourth, and $69 across 2027. The rating agency sees mid-$60s in the second half. The bank cut its end-2026 target to $78 from $95. Even the most bullish 2026 annual figure at $96 pairs with $75 for 2027.
The mechanism is identical across all of them: Hormuz traffic normalizes, the 5.5 million barrels per day of shut-in production restarts, global inventories rebuild, and the risk premium evaporates. Most shut-in production is assessed as largely restored in the first quarter of 2027.
The problem with a crowded consensus is the positioning it implies. If every institutional forecast expects lower prices by December, hedging programs and speculative books are already tilted short the back end. That leaves the curve vulnerable to a squeeze if restoration slips even one quarter.
The evidence for slippage is on the tape today. Hormuz traffic at 8 vessels is the lowest since August 5, not the highest. Iran has confirmed no ongoing discussions on a ceasefire extension. Both sides are demanding reparations as a precondition. The reserve that would cushion a further disruption sits below 300 million barrels, the lowest since 1983.
The counter-evidence is equally concrete. Iran-Oman talks on restoring maritime traffic have reached an advanced stage. Pakistan describes the parties as close to an arrangement. And the 9.1 million barrel US crude build says the physical market found workarounds faster than the forecasts assumed.
The trade off that setup: own the front, not the back. Front-month Brent above deferred contracts prices immediate scarcity, and immediate scarcity is the one thing every dataset confirms. October Brent at $84.11 against a front month near $89 is the market already pricing a $5 decline within two months.
If restoration happens on schedule, the front collapses toward the back. If it slips, the back rallies toward the front. Backwardation of that magnitude pays for the wait.
Product Cracks Are The Cleanest Expression Of The Squeeze
The refined product picture is tighter than crude and it is where the fundamental case is strongest.
Gasoline inventories fell 1.531 million barrels in the week ending August 7 after a 156,000-barrel build the prior week, and stocks were already 7% below the five-year average for this time of year. Distillates drew 596,000 barrels after a 1.2 million-barrel decline the week before.
Two consecutive weeks of product draws against a nine-million-barrel crude build is a refining-constrained market. Crude accumulates at the wellhead and the terminal while the barrels that consumers actually buy tighten.
The consumer-level evidence: the national regular gasoline average printed $4.03 per gallon Wednesday. July CPI recorded gasoline down 2.9% on the month and up 24.6% over 12 months, with fuel oil up 39.1% annually and the total energy index up 14.7%.
That annual gasoline figure — 24.6% — is what the refining squeeze looks like in a consumer price index. Energy inflation at 14.7% year-over-year with the monthly reading at negative 1.5% is a market where the level is punishing even as the rate of change temporarily improved.
The August survey reverses it. A $4.03 pump price in August against a July print that captured a 2.9% decline sets up a mechanical upside surprise in the September 11 CPI release — five days before the FOMC votes.
For crude traders, the read-through is directional. Product tightness pulls refinery runs higher, which draws crude inventories down, which validates the geopolitical premium. The nine-million-barrel build is a one-week signal. Two consecutive weeks of product draws with stocks 7% below the five-year average is a trend.
The seasonal timing works against the bears. Driving season demand persists into September, and refiners entering autumn maintenance with gasoline 7% below normal have no cushion for an unplanned outage.
Watch the crack spread rather than the flat price for confirmation. Widening cracks with crude building means refiners are being paid to run harder, and that resolves the inventory contradiction within two to three weeks.
What The Curve Is Actually Pricing
Strip the narrative and the forward structure tells you the market's own probability distribution.
Front-month Brent at $89.63 against October at $84.11 implies a $5.52 decline over roughly two months — a 6.2% backwardation. The official forecast has the third quarter averaging $85 and the fourth averaging $78, which is a $7 decline over the same horizon.
The curve is therefore pricing a slower normalization than the official view. That is the trade: the market believes the disruption persists longer than the agency assumes, and the market has been right about this conflict more often than the forecasts have.
The 2027 gap is where the real disagreement lives. The official 2027 average of $69.39 for Brent implies a 22.6% decline from spot. The most bullish institutional 2027 figure sits at $75, a 16.3% decline. Nobody forecasts 2027 above current levels.
That unanimity rests on one assumption: that 4.9 million of the 5.5 million barrels per day currently shut in comes back. The residual 0.6 million barrels per day of permanent impairment is the only structural loss anyone models.
The scenario nobody prices: infrastructure damage that makes restoration slower or partial. Attacks on energy infrastructure have supported prices throughout the conflict, and shut-in wells in the region are not uniformly restartable at prior rates. If restoration delivers 4.0 million barrels per day instead of 4.9 million, the 2027 curve is wrong by $10.
The opposite tail is equally real and faster. The March 11 precedent — a 9.26% single-session Brent collapse on intervention headlines — is what a genuine breakthrough produces. An Iran-Oman arrangement that restores partial maritime traffic would take Brent through $84 and toward the July 2 low of $69 inside weeks, because the entire premium above the mid-$70s is geopolitical.
Price the tails, not the base case. The base case is a $5 fade to October that everyone already owns.
Verdict: Long Brent Above $87 Targeting $93–$95, Stop Below $86.50
The trade is long the front month with tight risk, and the justification is physical rather than technical.
Brent at $89.63 has risen for five consecutive sessions on a supply disruption of 5.5 million barrels per day, Hormuz traffic at 8 vessels against a 10-day average of 12, a strategic reserve below 300 million barrels for the first time since 1983, gasoline stocks 7% below the five-year average, and two consecutive weeks of product draws. Both negotiating parties are demanding reparations from each other as a precondition. The forecast that lifted 2026 Brent to $86.81 was completed August 6, before the entire rally.
Entry at $89.63 with a stop on a close below $86.50 risks 3.5%. First target is $93 for 3.8%. Second target is $95 for 6.0%. The structural objective on a confirmed break of that zone is the prior major high near $102 for 13.8%. Risk-reward to $95 runs 1.7 to 1; to $102, 3.9 to 1.
For WTI, the equivalent structure is long above $83.50 with a stop below $81.50, targeting the $84.37 to $84.70 breakout and then $88. That risks 2.4% for 4.9%.
The decision point is 10:30 a.m. Eastern. Confirmation of the 9.1 million barrel crude build slows the advance and likely rejects Brent at $90 for a third time. A smaller build or a draw leaves geopolitical supply concerns in control and takes both benchmarks through resistance on the same session.
The bear case is specific and it is a headline risk rather than a fundamental one. Iran-Oman talks at an advanced stage, a Pakistani intermediary describing the parties as close, and the March 11 precedent of a 9.26% single-session collapse on intervention news. That scenario takes Brent through $84.11 toward the July 2 low of $69, a 23% decline, and it can execute overnight. Do not carry unhedged length into a weekend.
The official path — $85 in the third quarter, $78 in the fourth, $69 across 2027 — is the consensus and it is crowded. Own the front month where scarcity is confirmed, not the back where every forecaster is already positioned for the fade.
Beyond the trade, crude at $90 is currently the primary transmission channel for global monetary policy. A $10 sustained increase adds 0.5 percentage points to euro area inflation, and oil is up more than $40 since late February. Whatever happens at $90 decides what the Fed does on September 16 and what the ECB does on September 10.





