
Bitcoin Price Fluctuations Driven by Federal Reserve Rate Decisions
Analyzing Bitcoin's Response to Potential Rate Cuts and Market Sentiment | That's TradingNEWS
Bitcoin’s Seasonal Patterns and Market Dynamics
Seasonality and Historical Trends of Bitcoin (BTC)
Bitcoin (BTC) has historically shown distinct seasonal patterns. A statistical study from 2015 to 2023 indicates that July, August, and September are generally stagnant months for Bitcoin. However, a significant bullish phase often starts from late September to December, with Bitcoin prices rising 62% of the time during this period and an average increase of over 70%. This summer, Bitcoin's price behavior could be pivotal, potentially marking a turning point for a new bullish wave.
Recent Price Movements and Market Volatility
Current Bitcoin Price Analysis
Bitcoin has recently faced downward pressure, slipping below $64,000 and reaching an intra-day low of $63,580. This decline is attributed to escalating geopolitical tensions between Iran and Israel and a dovish outlook from the Federal Reserve. Despite this, Bitcoin’s long-term growth potential remains strong, with some economists predicting that BTC could surpass $500,000 by 2028.
Federal Reserve Policies and Their Impact on Bitcoin
Fed Hints at Rate Cuts and Bitcoin’s Reaction
The Federal Reserve has maintained interest rates at 5.25%-5.50% but hinted at a potential cut in September if inflation remains in check. This announcement briefly pushed Bitcoin below $65,000. Fed Chair Jerome Powell suggested that a rate reduction might be on the horizon, supported by weaker economic data. This potential easing of monetary policy could positively impact Bitcoin and other cryptocurrencies, creating a more favorable investment environment.
Technical Analysis of Bitcoin
Key Technical Levels and Market Sentiment
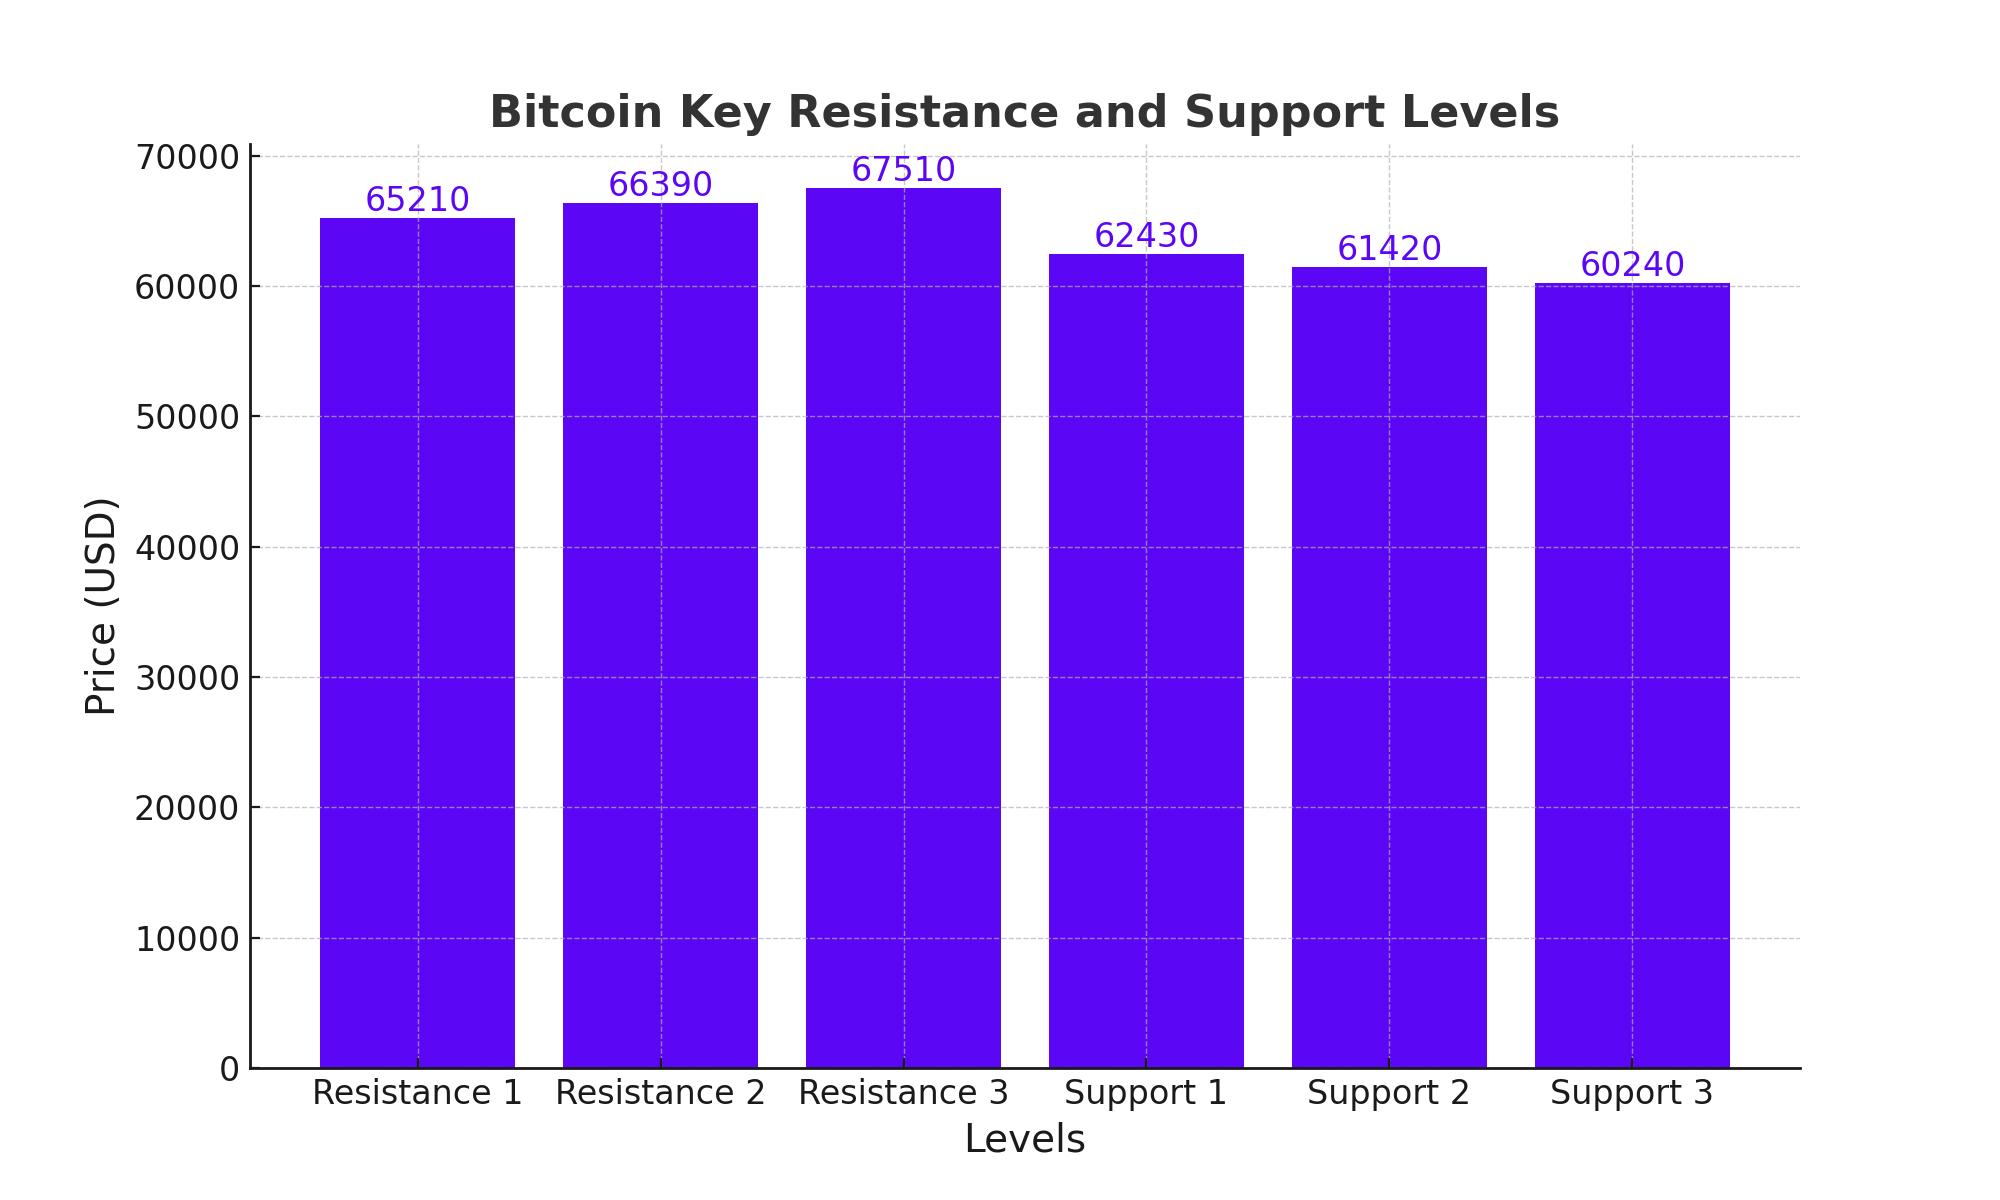
Bitcoin is currently trading at $64,360, reflecting a slight decrease of 0.40%. The 4-hour chart indicates a crucial pivot point at $63,450, determining the market’s next move. Immediate resistance levels are at $65,210, $66,390, and $67,510, while support is found at $62,430, $61,420, and $60,240. The Relative Strength Index (RSI) at 35 suggests oversold conditions, indicating potential for a rebound. The 50-day Exponential Moving Average (EMA) at $66,350 highlights resistance to upward movement.
Future Outlook for Bitcoin
Bullish Sentiment and Long-Term Potential
Despite current market pressures, the outlook for Bitcoin remains bullish. Seasonal patterns suggest that the end of summer could mark the beginning of a strong bullish phase. Additionally, Federal Reserve policies and ongoing geopolitical tensions are likely to continue influencing Bitcoin prices. Economists like Timothy Peterson forecast that Bitcoin’s price could surpass $500,000 by 2028, driven by historical trends and increasing adoption.
Investors should closely monitor key technical levels and market developments, as these factors will play crucial roles in Bitcoin’s price trajectory in the coming months.
Thta's TradingNEWS
Read More
-
Yen Stalls at 160 Despite a 3% JGB and Tokyo Core CPI at 2.0% — Intervention Sits at 164, Friday's Payrolls Decide
02.09.2026 · TradingNEWS ArchiveEnergy
-
VOO ETF at $705 as Record $13B Weekly Inflows Absorb the Rate Shock — $700 Floor Guards the Path to a New High
28.09.2026 · TradingNEWS ArchiveStocks
-
XRPR and XRPI Ride XRP's $1.50 Test as Bitwise Takes 78% of a $75.59M Week — October 1 Escrow and Bitget Hack Supply Cap the Upside
28.09.2026 · TradingNEWS ArchiveCrypto
-
Henry Hub ($3.11) Pulls Back From 13-Week High as 112.8 Bcf/d Output Meets Record LNG Pull — $3.10 Pivot Guards the Path to $3.529
28.09.2026 · TradingNEWS ArchiveCommodities
-
Dollar-Yen Trapped Between Carry and Intervention — 159.03 High Marks Where Tokyo Pushed Back Last Week
28.09.2026 · TradingNEWS ArchiveForex