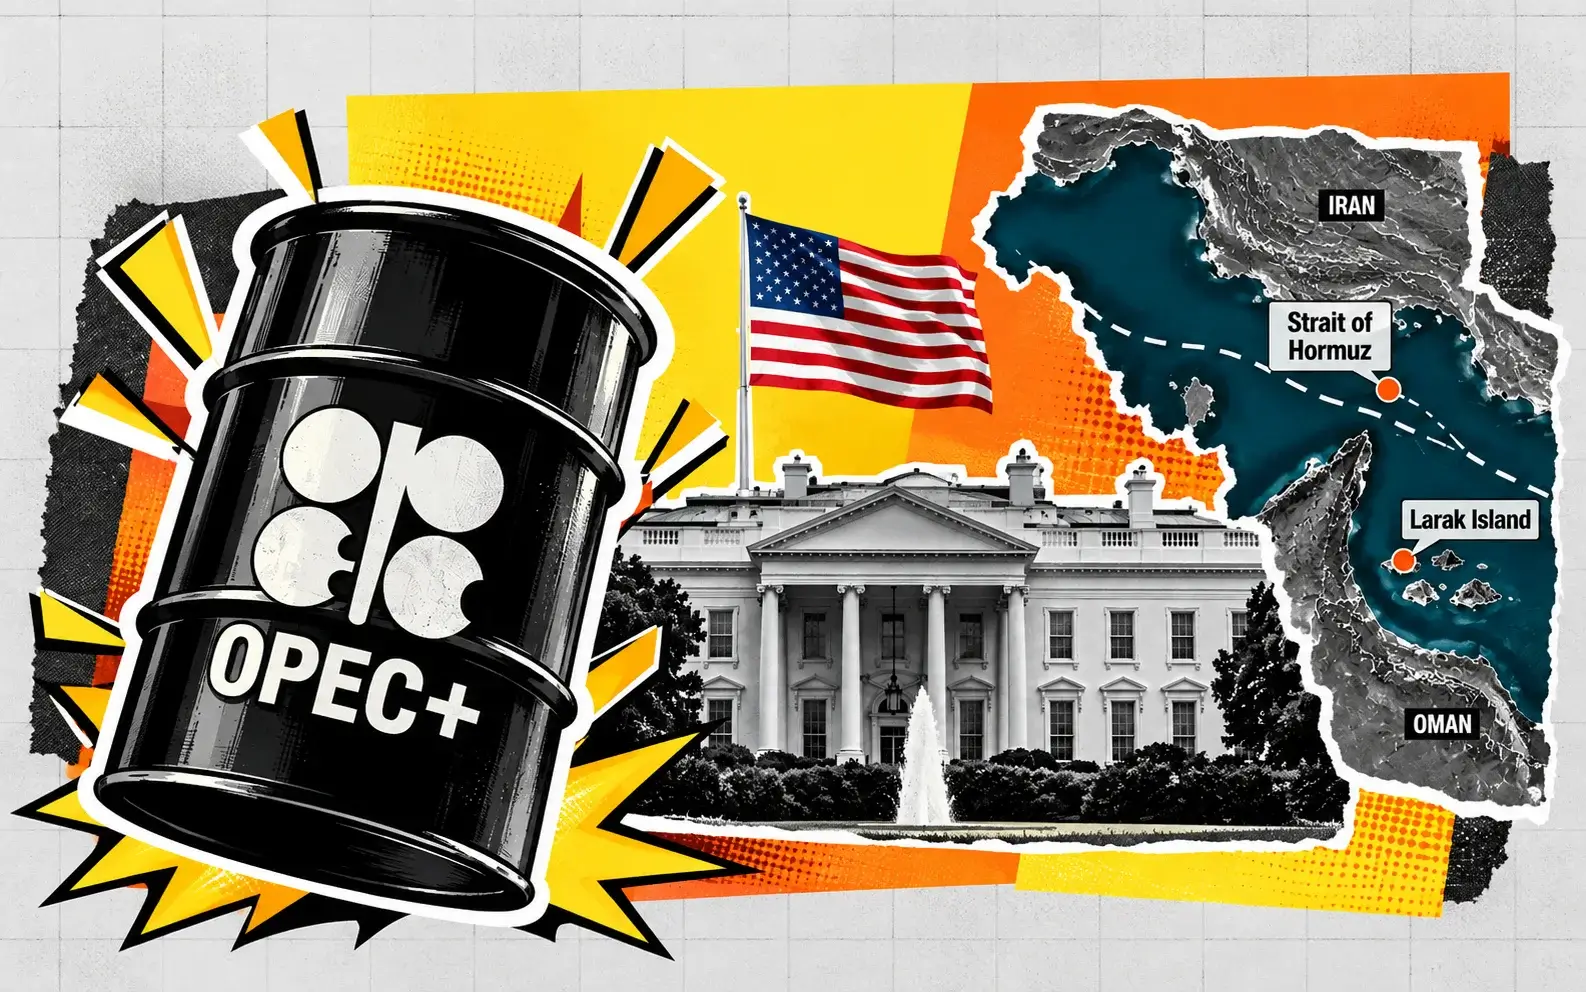
Brent $101 and WTI $89 Split on War Risk and Recovering Supply — EIA Sees $105, Support at $88
Weekly Hormuz flows fell to 10.3M bpd, 23% below baseline, as freight hit $1M a day per tanker | That's TradingNEWS
Key Points
- Brent trades at $101.10, up 0.55%, while WTI slips 0.23% to $89.23 for an $11.87 spread.
- Nine tanker attacks in Hormuz so far in October equal half of September's full-month total.
- WTI support sits at $88.52 and resistance at $92.90; Brent's range is $97 to $103.90.
Brent crude traded at $101.10 a barrel on Wednesday, October 7, up 55 cents or 0.55% on the day. West Texas Intermediate changed hands at $89.23, down 21 cents or 0.23% from Tuesday's $89.44 settlement. Murban, the Abu Dhabi grade that prices Gulf barrels headed to Asia, stood at $106.40, a gain of 20 cents.
The session started stronger than it finished. Brent reached $102 in early European trading, a 1.4% advance, and WTI touched $90.55 around 10:00 a.m. ET, up 1.24%. Both gave ground through the U.S. morning. WTI surrendered its entire gain and slipped into the red, while Brent kept roughly a third of its move.
That divergence is the key to reading this market. The international benchmark is being bid on fresh attacks in the Middle East. Saudi airports at Jazan and Najran were struck on Monday evening. Iran has accelerated its campaign against tankers in the Strait of Hormuz, with nine attacks recorded already in October. Brent had fallen for three straight sessions and touched $97 early Tuesday before those headlines turned it around.
The American benchmark is being held down by a different set of facts. Gulf crude exports have recovered to prewar levels. The United States and its allies are releasing emergency stocks. Saudi Arabia cut prices for Asian buyers. U.S. output is running near record levels, and a stock market down 0.6% with the 10-year Treasury at 5.345% is not a backdrop for chasing commodities.
The gap between the two contracts now stands at $11.87. That spread is the war premium in its purest form. It is the cost of moving a barrel by sea through contested water, and it attaches to Brent and Murban while leaving landlocked WTI comparatively untouched.
Supply through the Gulf has largely come back. The cost and danger of delivering it have risen sharply. Prices are caught between those two realities, and the forecast below treats the current range as a balance point: WTI between $88.52 and $92.90, Brent between $97 and $103.90, with the next move decided by whether Iran's attacks start reducing flows or merely make them more expensive.
A Year That Began at $61
Brent opened 2026 at $61 a barrel. It ended the first quarter at $118, the largest quarterly increase on an inflation-adjusted basis in records going back to 1988. The trigger was the outbreak of war between the United States, Israel and Iran in late February and the effective closure of the Strait of Hormuz on March 1, when tanker traffic through the main shipping lanes stopped.
Seven months later the market has adjusted without returning to normal. Brent at $101.10 is 14% below that quarter-end peak and 66% above where it started the year. It is up 4% over one month, 38% over three months and more than 50% from a year ago. WTI at $89.23 is down 3.4% over one month and up 44% over twelve.
The recent path has been volatile. WTI reached a September high of $106.83 and traded at $95.61 on September 28. Brent closed at $102.25 on October 1. The next day it fell 2.62% to $99.63 while WTI dropped 3.54% to $89.58, after G7 governments announced a coordinated release of emergency stocks. On Monday prices dropped again when Saudi Aramco lowered its official selling prices to Asia. By Tuesday morning Brent was near $97, down for a third straight session.
Then the direction changed. News of stepped-up Iranian strikes on tankers and a reported blast off Qeshm island near the strait brought buyers back. Brent recovered to $100.55 by Tuesday's close and extended to $102 on Wednesday.
The round trip from $102.25 to $97 and back to $102 in five sessions captures the market's condition. Each bearish development, a stock release, a price cut, a recovery in exports, knocks $3 to $5 off the price. Each new attack puts it back. Neither side has been able to establish a trend.
WTI has been the weaker of the two throughout. It is 16% below its September high and has spent the past week pinned near $89, unable to follow Brent back above its early-October levels. That underperformance reflects the supply cushion in North America and is the reason the spread has widened.
At $101.10, Brent sits $3.90 below the government's forecast average for the fourth quarter.
Hormuz: Flows Have Recovered, Security Has Not
The central fact of the oil market in October is that crude is moving through the Gulf again. Middle East Gulf crude exports, excluding Iran, have returned to prewar levels seven months after the strait closed. Crude transiting Hormuz reached a seven-day average of 13.5 million barrels a day as of September 28, matching the prewar baseline. The Gulf's oil industry has adapted to prolonged disruption better than almost anyone forecast in March.
Two things made that possible. U.S. military escorts have allowed tankers to transit under protection. And pipelines have rerouted a large share of exports around the chokepoint: 40% of Gulf crude now bypasses Hormuz, compared with 17% before the war. Saudi Arabia's East-West pipeline, which carries crude to the Red Sea, has restored pumping capacity to 5.8 million barrels a day after being attacked.
The recovery is real and it is fragile. Iran has increased the pace of its attacks just as shipments approached normal. UK maritime authorities have recorded nine attacks in the waterway so far in October, half the total for all of September in the strait and the Persian Gulf combined. Four of September's attacks came in the final two days of the month. Eight merchant vessels were hit between September 28 and October 4. Strikes are now landing almost daily.
The effect on volumes is starting to show. Shipments averaged 10.3 million barrels a day in the week ended October 3, 23% below the 13.5 million baseline. On October 3, outbound crude totaled 9.17 million barrels across seven crossings, down from 13.15 million the day before. Flows fluctuate sharply from one day to the next depending on the security picture.
The human cost is rising. Twelve seafarers were injured when a Panama-flagged tanker was struck by a projectile. On Monday Iran's Revolutionary Guard hailed an inbound tanker and ordered it to turn back or be targeted. The vessel complied.
Refined products have recovered less than crude. Combined crude and product shipments stood at 14.2 million barrels a day in late September, 80% of the 17 million prewar baseline. That shortfall in diesel and jet fuel explains why product prices have stayed elevated even as crude eased.
The assessment from maritime intelligence is that Iran's campaign is raising costs without closing the strait. That distinction matters for price. A closed strait means $118 Brent. A dangerous but open one means something close to $100.
Freight and Insurance: The New Phase of the Crisis
With barrels flowing, the bottleneck has shifted from production to transport. The cost of shipping crude from the Persian Gulf to China has reached $1 million a day per tanker. Every major crude freight index is at a record. The head of the world's largest independent oil trader described the crisis this week as entering a new phase defined by a shortage of ships.
Several forces produced that shortage. Rerouting 40% of Gulf exports through pipelines to the Red Sea and other terminals changes voyage patterns and ties up vessels for longer. Operating under naval escort means sailing in convoys, which reduces the number of trips a tanker can complete. Using smaller vessels to limit exposure to attack requires more hulls to move the same volume. Some owners simply refuse to send ships into the Gulf at any price, shrinking the available fleet. And war-risk insurance premiums have multiplied.
The result is that a barrel of Gulf crude costs far more to deliver than its wellhead price suggests. A very large crude carrier holds 2 million barrels. At $1 million a day on a voyage of roughly three weeks to China, freight alone adds $10 or more per barrel, before insurance.
This is why the benchmarks have diverged. Brent and Murban price seaborne crude and embed these costs. Murban at $106.40 trades $5.30 above Brent and $17.17 above WTI. West Texas Intermediate prices crude delivered by pipeline to Cushing, Oklahoma, where none of this applies. The $11.87 Brent-WTI spread is to a large degree a freight and risk differential.
It also explains a feature of the market that has puzzled observers: exports back at prewar levels with prices 66% above where they started the year. Volume has normalized but cost has not.
For the forecast this matters in two ways. First, freight costs are sticky. Even if attacks stopped tomorrow, insurers and shipowners would take weeks or months to reprice risk, so Brent's premium would compress gradually. Second, record freight rates create an incentive problem for buyers. Asian refiners facing $106 Murban plus record shipping are being squeezed on margins, which is part of why Saudi Aramco cut its official selling prices on Monday. Producers are absorbing some of the transport cost to keep customers.
The wide spread is also pulling U.S. crude into export markets, which should support WTI at the margin and limit how far the differential can stretch.
U.S. Inventories: A 3.2 Million Barrel Draw
The weekly data offered support that the price did not fully reflect. U.S. commercial crude inventories fell by 3.2 million barrels in the week ending October 2, according to the Energy Information Administration. Distillate stocks held steady. Industry figures released Tuesday evening had shown a smaller decline of 2.1 million barrels.
The draw reverses two weeks of builds. Stocks had risen by 922,000 barrels in the week ending September 25, against expectations for a 700,000 barrel decline, and by 2.969 million barrels the week before that. A 3.2 million barrel drop more than offsets the prior week's increase and takes back most of the two-week gain of 3.89 million barrels.
WTI's reaction was muted. The contract was near $90.55 around the time of the release and drifted lower afterward to $89.23. A bullish inventory number that fails to lift the price is a sign of a market with other concerns, and on Wednesday those concerns were the stock market selloff and a firmer dollar.
The mechanics behind the draw are consistent with the spread. With Brent trading $11.87 above WTI, U.S. crude is highly competitive in export markets. Barrels leaving the Gulf Coast for Europe and Asia reduce domestic stocks. The wider the spread, the stronger that pull, and the more inventories should decline in the weeks ahead.
Distillates holding steady is the less comfortable detail. Diesel prices are at record highs. Refined product flows from the Middle East remain 20% below prewar levels. U.S. distillate stocks are the buffer against a winter heating season that begins in a matter of weeks, and they are not being rebuilt.
Policy has been leaning against the tightness. The government announced exchanges of 40 million barrels from the Strategic Petroleum Reserve on September 29. Those barrels add to commercial supply as they are delivered, which may obscure the underlying pace of draws in coming reports.
A third factor could affect next week's data. Tropical Storm Isaias is forecast to reach the Gulf Coast as a hurricane late Friday or early Saturday. Storms disrupt offshore production, refinery runs and port operations in ways that can swing weekly inventory figures by several million barrels in either direction.
Taken alone, the 3.2 million barrel draw argues for a floor under WTI near current levels.
The Supply Response: G7 Stocks, the SPR and Saudi Pricing
Governments and producers have thrown considerable resources at bringing prices down, and the results have been limited.
On October 2, G7 countries agreed to release 100 million barrels from emergency reserves. That announcement drove the 2.62% drop in Brent and the 3.54% fall in WTI that day. The detail has been less impressive than the headline. European Union member states expect the release to largely enact commitments already made, and the International Energy Agency has convened an informal meeting on releasing both crude and diesel reserves. Critics have called the measure a temporary fix, on the reasoning that drawing down inventories that are already low leaves the market more exposed to the next disruption.
The U.S. contribution is the 40 million barrel exchange from the Strategic Petroleum Reserve announced on September 29. An exchange differs from a sale: the barrels must be returned later with a premium, which means the government becomes a buyer at some future date.
Saudi Arabia has acted on two fronts. The restoration of the East-West pipeline to 5.8 million barrels a day gives the kingdom a route to export from the Red Sea without passing Hormuz. And Aramco's decision to lower official selling prices for Asian customers sent crude lower on Monday. The price cut tells the market something important: the world's largest exporter sees demand at current delivered costs as soft enough to require a discount.
There is a hidden cost to the Saudi recovery. Exporting through the Red Sea exposes cargoes to Houthi attacks near the Bab-el-Mandeb strait, where a tanker reported multiple explosions nearby on October 4. Moving barrels from one chokepoint to another reduces one risk and adds a second.
The combined effect of these measures was to push Brent from $102.25 to $97 in three sessions. It took one day of attack headlines to recover most of that.
This pattern has held since the spring. Emergency releases, price cuts and rerouting have each bought time and capped rallies. None has addressed the underlying constraint, which is the security of the waterway. Reserves are finite. The G7 release and the SPR exchange together amount to 140 million barrels, equal to roughly ten days of normal Hormuz crude flows.
For the forecast, the supply response sets a ceiling on prices in the near term without setting a direction. Each release makes the next one harder, because the stocks being drawn must eventually be replaced.
The Official Forecast: $105 Brent in the Fourth Quarter
The U.S. government's energy statistics agency raised its price outlook sharply this week. In the Short-Term Energy Outlook published October 6, the EIA projected that Brent will average $105 a barrel in the fourth quarter of 2026. That is $14 higher than its forecast a month earlier.
The agency expects oil production and flows from the Middle East to increase. It raised its price forecast anyway. The reasoning is that attacks on the East-West pipeline in Saudi Arabia show the potential for continued volatility in physical flows, at a time when global inventories are being drawn down. The EIA estimates that world oil stocks fell by an average of 1.9 million barrels a day over the period it reviewed. Prices are expected to remain elevated until constraints on Middle East flows are resolved and inventories can be replenished.
For the full year the agency sees Brent averaging $96 in 2026 and $84 in 2027. U.S. crude production is projected at 13.9 million barrels a day this year and 14.3 million next year, both records.
The forecast was finalized on October 1. It incorporates the 40 million barrel SPR exchange announced September 29 but does not account for the G7's October 2 announcement, which would add supply and argue for a somewhat lower number.
Several things stand out. A $14 upward revision in one month is large for an agency that typically adjusts by a few dollars. It reflects how much the security situation deteriorated in September. The implied path is also notable. With Brent at $101.10 on October 7 and a quarterly average of $105, prices would need to spend much of November and December above $105 to reach that mean.
The longer-term numbers tell a different story. An $84 average in 2027 implies a decline of $21 from the fourth-quarter forecast, on the assumption that flows normalize and record U.S. output fills the gap. The futures curve reflects the same view, with later-dated contracts trading below near-term ones.
Model-based projections sit in the same area for the near term, with one placing Brent at $106.60 by the end of the quarter and WTI at $95.28.
The government's outlook supports a constructive stance on Brent over the next three months. Its own caveats apply: the forecast predates the largest coordinated stock release of the year.
Read More
-
Yen Stalls at 160 Despite a 3% JGB and Tokyo Core CPI at 2.0% — Intervention Sits at 164, Friday's Payrolls Decide
02.09.2026 · TradingNEWS ArchiveEnergy
-
LLY Reclaims $1,200 as Mounjaro and Zepbound Deliver $14.9B a Quarter — Buy Rating, $1,292 High in Sight
07.10.2026 · TradingNEWS ArchiveStocks
-
XRP-USD ($1.42) Underperforms Bitcoin as Weekly ETF Inflows Fade to $4.74M — Hold, Buy Zone at $1.37 to $1.40
07.10.2026 · TradingNEWS ArchiveCrypto
-
Gold ($4,102) Sinks to a 2-Month Low on 24-Year-High Yields and a 102.45 Dollar — Sell Rallies to $4,190, Buy Zone at $3,920
07.10.2026 · TradingNEWS ArchiveCommodities
-
Dow Sheds 539 Points, S&P 500 Back Under 7,800, Nasdaq Off 0.75% as Yields Reach 2002 Highs; PENG +17%
07.10.2026 · TradingNEWS ArchiveMarkets
-
Pound Retreats From 1.3284 Trendline as U.S. Yields Hit 2002 Highs — Sell Rallies to 1.3303, Downside to 1.3139
07.10.2026 · TradingNEWS ArchiveForex
Tropical Storm Isaias Adds a Domestic Supply Risk
A threat closer to home is building in the Gulf. Tropical Storm Isaias formed early Wednesday, and the National Hurricane Center expects rapid strengthening over the next two days. It is forecast to become the first hurricane of the 2026 Atlantic season. Computer models show the system tracking east-northeast before turning north, with landfall projected late Friday or early Saturday between eastern Louisiana and the western Florida Panhandle.
That stretch of coast and the waters off it host a significant share of U.S. offshore oil production, along with refineries, export terminals and the Louisiana Offshore Oil Port. Operators have already responded. Chevron (CVX), Shell (SHEL) and BP (BP) have pulled nonessential workers from platforms in the region. Florida has declared a state of emergency in 25 counties.
Hurricanes affect oil prices through several channels that can work in opposite directions. Shutting in offshore platforms reduces crude supply, which is bullish. Refinery outages reduce crude demand, which is bearish for crude and bullish for gasoline and diesel. Port closures halt both imports and exports. The net effect depends on the storm's track and intensity and on how long facilities stay offline.
The timing magnifies the significance. In a normal year a Gulf storm removes barrels from a well-supplied market. This year U.S. production and exports are the main substitute for disrupted Middle East supply, the Brent-WTI spread is drawing record volumes out of the Gulf Coast, and diesel prices are at all-time highs. A disruption to Gulf Coast refining would tighten a product market that has no slack.
The forecast track matters a great deal. A landfall on the eastern end of the projected zone, toward the Florida Panhandle, would miss most energy infrastructure. A track toward southeast Louisiana would cross the heart of the offshore fields and threaten refineries along the Mississippi River.
For WTI, the storm is a reason the contract held $89 on a day when equities fell and the dollar rose. Evacuations are a precaution, but they precede production shut-ins. If Isaias strengthens as forecast and holds a western track, announcements of reduced output would be likely by Thursday.
Past storms have produced short-lived price spikes that faded once damage assessments came in. The effect on refined products has usually lasted longer than the effect on crude.
Demand, the Dollar and 5.345% Treasury Yields
The macro backdrop is working against oil. The 10-year Treasury yield reached 5.345% on Wednesday, the highest since 2002. The Dollar Index rose 0.4% to 102.45, a level last seen in April 2025. The S&P 500 fell 0.6% from a record close and the Russell 2000 dropped more than 1%.
A stronger dollar makes crude more expensive for buyers paying in other currencies. With the euro at 1.1192, within 32 pips of a 17-month low, European importers face oil prices that have risen further in their own currency than the dollar price implies. Brent at $101.10 costs €90.33 a barrel at Wednesday's exchange rate. That weighs on demand in a region already dealing with its own fiscal stress.
High prices are affecting consumers. Diesel is at a record. Wholesale used-vehicle prices fell 1.2% from a year ago in September, with fuel costs and rising interest rates cited as the cause, and the full-year forecast for the main used-car price index was cut to a 0.2% gain from 2%. A major brewer reported falling sales at grocery and convenience stores. These are early signs of demand destruction, the process by which high prices reduce consumption.
The Federal Reserve is tightening into this. The central bank raised rates in September for the first time in three years, and futures price an 86% chance of another hike by December. The minutes of the September meeting are due at 2:00 p.m. ET. Higher rates slow economic activity and with it oil demand.
Oil sits at the center of the feedback loop driving every other market. Brent above $100 keeps inflation elevated. Elevated inflation pushes the Fed to tighten and lifts long-term yields. Higher yields weaken growth, which eventually reduces oil demand. The International Monetary Fund warned on Wednesday that the energy supply shock, alongside record public debt, threatens global growth, with the largest forecast downgrades reserved for economies directly affected by war.
China is on holiday for Golden Week, removing the world's largest crude importer from the market temporarily.
The demand side sets a ceiling that supply risk alone cannot break. At $118 Brent in March, consumption fell sharply. At $101 the damage is slower but visible. Sustained prices above $105 would accelerate it, and that is the main reason the bullish case has limits even if attacks continue.
WTI Technical Picture: A Descending Triangle Reaches Its Apex
The WTI chart has been coiling for three weeks and is running out of room.
On the four-hour chart the contract has traded inside a descending triangle since its September high. The upper boundary is a falling trendline connecting lower highs. The lower boundary is horizontal support at $88.52. The falling trendline meets horizontal resistance at $92.90, and the two lines of the pattern converge around October 7. A triangle that reaches its apex has to resolve one way or the other.
Support at $88.52 has significance beyond the pattern. It is the 38.2% Fibonacci retracement of the rally from the summer low, and WTI has tested it repeatedly since late September without a close below. At $89.23 the contract is 71 cents above it.
Momentum indicators lean bearish. WTI has found acceptance below its 200-period simple moving average on the four-hour chart. The relative strength index is below its average. Of 22 daily technical indicators, 13 signal sell and 7 signal buy, and the composite reading was downgraded from neutral to sell on Tuesday.
A longer-term rising trendline, drawn from the lows earlier in the year, sits in the high $80s and adds to support in the same area as the Fibonacci level.
Descending triangles are usually classified as bearish continuation patterns, because the lower highs show sellers becoming more aggressive while buyers merely hold a line. In this case the pattern formed after a 16% decline from $106.83, which fits that reading. The counterargument is the setting. Every dip toward $88.52 has coincided with a bearish supply headline, and each one has been bought.
The levels are well defined. On the upside, a break above $92.90 would clear both the trendline and horizontal resistance. The next targets would be $96.74 and $100.63, with the September high at $106.83 beyond. A daily close above $106.83 would open an extended target at $119.49.
On the downside, a close below $88.52 would complete the triangle. The 50% retracement at $84.40 is the first objective, followed by the 61.8% level at $80.29. Major support and the level that would invalidate the broader bullish structure is $79.66.
Volatility-based ranges are consistent with those boundaries. The projected range for Thursday is $87.30 to $92.61, and this week's implied range runs from $82.55 to $99.68.
With the pattern at its apex and three scheduled catalysts ahead, a hurricane, Fed minutes and the next round of Hormuz headlines, a resolution this week is likely.
Brent Levels and the Spread
Brent's chart is less compressed than WTI's and has a clearer short-term range.
The lower boundary is $97 to $98, where Tuesday's selloff ran out of sellers. The three-day decline from $102.25 stopped there and reversed $5 within 24 hours. That reaction established the area as the first meaningful support. Below it, the market would be looking at the mid-$90s, where Brent traded before September's escalation.
The $100 level sits in the middle. It carries psychological weight and has acted as a pivot all month, with Brent closing above it on October 1, below it on October 2, and back above it on Tuesday. Wednesday's price of $101.10 keeps the contract on the upper side.
Resistance begins at $102, Wednesday's early high, and $102.25, the October 1 close. Above that, $103.90 has been identified as the next objective. The government's fourth-quarter forecast of $105 and a model-based quarter-end projection of $106.60 mark the zone beyond.
The Brent-WTI spread deserves separate attention. At $11.87 it is exceptionally wide. Before the war the two benchmarks typically traded within a few dollars of each other. The spread widened in March because Brent rose faster than WTI, reflecting higher shipping costs and reduced flows near Hormuz, while ample U.S. inventories and reserve releases limited WTI's gains.
A spread this wide tends to correct over time through arbitrage. U.S. exporters ship more crude abroad, which tightens the domestic market and lifts WTI. The 3.2 million barrel inventory draw is consistent with that process. The limiting factor is the same one driving the spread: tanker availability. With freight rates at records, moving American crude to Europe or Asia is expensive, which slows the arbitrage and allows the gap to persist.
Two scenarios narrow it. In the first, security improves, freight rates fall and Brent declines toward WTI. In the second, U.S. supply is disrupted, by a hurricane for example, and WTI rises toward Brent. Tropical Storm Isaias makes the second a live possibility this week.
Murban's $5.30 premium to Brent is a third reference. It shows that barrels originating inside the Gulf carry the highest risk charge of all.
For traders the spread offers a way to express a view without taking outright price risk. Those who expect security to deteriorate would favor Brent over WTI. Those who expect a diplomatic breakthrough or a Gulf Coast supply disruption would favor the reverse.
Three Scenarios Into Mid-October
The base case is a continuation of the range. Iran's attacks keep raising the cost of transit without closing the strait. Flows fluctuate between 10 million and 13.5 million barrels a day. Emergency stock releases and Saudi price cuts cap rallies, while each new strike puts a floor under dips. In this scenario WTI trades between $88.52 and $92.90 and Brent between $97 and $103.90 through the middle of the month, with the spread holding near $11 to $12. The descending triangle in WTI resolves with a false break in one direction that reverses.
The bullish scenario requires flows to fall, not just costs to rise. If attacks reduce Hormuz crude shipments toward the 9 million barrel a day level seen on October 3 and hold them there, the market loses 4 million barrels a day against the prewar baseline. Emergency releases of 140 million barrels would cover that shortfall for five weeks. A hit on the East-West pipeline or a Saudi export terminal would compound it. Hurricane damage to Gulf Coast production would add a domestic leg. WTI would break $92.90 and target $96.74 and $100.63. Brent would clear $103.90 and move toward the $105 to $106.60 zone, with the September highs in view. The government's fourth-quarter forecast effectively assumes a version of this.
The bearish scenario starts with diplomacy. Iran reportedly offered a deal to reopen the strait within seven days, and the president rejected it on October 6. The vice president has said any agreement requires a meaningful reduction in Iranian enrichment capacity. A revival of those talks, or a provisional ceasefire like the one brokered in June, would remove the risk premium quickly. Brent fell from $118 to the low $90s the last time peace looked possible. In that case WTI would break $88.52 and head for $84.40, with $80.29 beneath. Brent would lose $97 and trade into the low $90s. Demand destruction and Fed tightening would reinforce the move.
Each scenario has an identifiable trigger. For the range, it is more of the same. For the breakout, it is a multi-day drop in tanker crossings or infrastructure damage. For the breakdown, it is a credible diplomatic channel.
The range is the most probable outcome for the coming week. Between the two tails, the bullish one has more immediate catalysts: a hurricane arriving Friday, attacks accelerating, and a rejected peace offer.
The bearish tail has the larger potential move. A settlement would take $10 to $15 off Brent in days, while escalation short of a full closure adds $5 to $8.
Verdict on Oil: Hold With a Bullish Bias on Brent, Buy WTI Dips Toward $88.52
Crude at $101.10 Brent and $89.23 WTI is a Hold, with a bullish lean for the next several weeks and a clear set of levels to act on.
The case for higher prices rests on the direction of risk. Iran has recorded nine attacks in the first week of October, half of September's entire total. Weekly Hormuz crude flows dropped to 10.3 million barrels a day, 23% below baseline. Freight costs are at records. U.S. inventories fell 3.2 million barrels. A hurricane is forecast to strike the Gulf Coast within three days. Washington rejected Tehran's offer to reopen the strait. The government's own forecaster raised its fourth-quarter Brent estimate by $14 to $105. Each of the past week's bearish developments, including a 100 million barrel stock release and a Saudi price cut, was absorbed within days.
The case against chasing the market is equally concrete. Gulf crude exports have recovered to prewar levels at times, and 40% of them now bypass the strait. Governments have committed 140 million barrels of reserves. U.S. production is at a record. The dollar is at an 18-month high, Treasury yields are at a 24-year high, and consumer data show demand weakening. WTI could not hold a gain on Wednesday despite a bullish inventory report, and its daily technical signal reads sell.
Those forces produce a market that should be bought on weakness and not on strength. For WTI the level is $88.52, the 38.2% retracement and triangle floor, 71 cents below the current price. Buying near it with a stop on a daily close below offers a first target at $92.90, a gain of $4.38, and a second at $96.74. A daily close above $92.90 would confirm an upside break and justify adding. A close below $88.52 turns the outlook bearish, with $84.40 the objective.
For Brent the buy zone is $97 to $98, and the targets are $103.90 and then $105. A sustained break below $97 would signal that the supply response is winning.
The Brent-WTI spread at $11.87 is the cleaner expression of the war premium, and it should stay wide as long as tankers are being hit.
One event would override this view entirely. A credible ceasefire would remove $10 or more from Brent in short order, and long positions should be sized with that possibility in mind. Until diplomacy produces something concrete, the balance of evidence favors holding existing exposure, adding on dips toward support, and expecting Brent to trade closer to $105 than to $95 by the end of the quarter.